Threat actors behind the relatively new Venus Ransomware are hacking into publicly-exposed Remote Desktop services to encrypt Windows devices.
Venus Ransomware appears to have begun operating in the middle of August 2022 and has since encrypted victims worldwide. However, there was another ransomware using the same encrypted file extension since 2021, but it is unclear if they are related.
BleepingComputer first learned of the ransomware from MalwareHunterTeam, who was contacted by security analyst linuxct looking for information on it.
Linuxct told BleepingComputer that the threat actors gained access to a victim’s corporate network through the Windows Remote Desktop protocol.
Another victim in the BleepingComputer forums also reported RDP being used for initial access to their network, even when using a non-standard port number for the service.
How Venus encrypts Windows devices
When executed, the Venus ransomware will attempt to terminate thirty-nine processes associated with database servers and Microsoft Office applications.
When encrypting files, the ransomware will append the .venus extension, as shown below. For example, a file called test.jpg would be encrypted and renamed test.jpg.venus.
Files encrypted by the Venus Ransomware Source: BleepingComputer
In each encrypted file, the ransomware will add a ‘goodgamer’ filemarker and other information to the end of the file. It is unclear what this additional information is at this time.
Goodgamer file marker in an encrypted file Source: BleepingComputer
The ransomware will create an HTA ransom note in the %Temp% folder that will automatically be displayed when the ransomware is finished encrypting the device.
As you can see below, this ransomware calls itself “Venus” and shares a TOX address and email address that can be used to contact the attacker to negotiate a ransom payment. At the end of the ransom note is a base64 encoded blob, which is likely the encrypted decryption key.
At this time, the Venus ransomware is fairly active, with new submissions uploaded to ID Ransomware daily.
As the ransomware appears to be targeting publicly-exposed Remote Desktop services, even those running on non-standard TCP ports, it is vital to put these services behind a firewall.
Ideally, no Remote Desktop Services should be publicly exposed on the Internet and only be accessible via a VPN
If you’re new to the world of virtualization, networking configuration can be one of the toughest concepts to grasp. Networking is also different in Hyper-V than in other hypervisors, so even those with years of experience can stumble a bit when meeting Hyper-V for the first time. This article will start by looking at the conceptual design of virtual networking in Hyper-V, configuration and then work through implementation best practices.
Networking Basics
Before beginning, it might be helpful to ensure that you have a solid grasp of the fundamentals of Ethernet and TCP/IP networking in general. Several articles that explain common aspects begin with this explanation of the OSI model.
The Hyper-V Virtual Switch
The single most important component of networking in Hyper-V is the virtual switch. There’s an in-depth article on the Hyper-V Virtual Switch on this blog, but for the sake of this article I’ll give you a basic introduction to the concept, within the bigger picture.
The key to understanding is realizing that it truly is a switch, just like a physical switch. It operates in layer 2 as the go-between for virtual switch ports. It directs packets to MAC addresses. It handles VLAN tagging. It can even perform some Quality of Service (QoS) tasks. It’s also responsible for isolating network traffic to the virtual adapter that is supposed to be receiving it. When visualized, the Hyper-V network switch should be thought of in the same way as a standard switch:
The next part of understanding the virtual switch is how it interacts with the host. To open that discussion, you must first become acquainted with the available types of virtual switches.
Virtual Switch Modes
There are three possible modes for the Hyper-V switch: private, internal, and public. Do not confuse these with IP addressing schemes or any other virtual networking configuration in a different technology.
Hyper-V’s Private Switch
The private switch allows communications among the virtual machines on its host and nothing else. Even the management operating system is not allowed to participate. This switch is purely logical and does not use any physical adapter in any way. “Private” in this sense is not related to private IP addressing. You can mentally think of this as a switch that has no ability to uplink to other switches.
Hyper-V’s Internal Switch
The internal switch is similar to the private switch with one exception: the management operating system can have a virtual adapter on this type of switch. This allows the management operating system to directly communicate with any virtual machines that also have virtual adapters on the same internal switch. Like the private switch, the internal switch does not have any relation to a physical adapter and therefore also cannot uplink to any another switch.
Hyper-V’s External Switch
The external switch type must be connected to a physical adapter. It allows communications between the physical network and the management operating system and the virtual adapters on virtual machines. Do not confuse this switch type with public IP addressing schemes or let its name suggest that it needs to be connected to an Internet-facing system. You can use the same private IP address range for the adapters on an external virtual switch that you’re using on the physical network it’s attached to. External in this usage means that it can connect to systems that are external to the Hyper-V host.
How to Conceptualize the External Virtual Switch
Part of what makes understanding the external virtual switch artificially difficult is the way that the related settings are worded. In the Hyper-V Manager GUI, it’s worded as Allow management operating system to share this network adapter. In PowerShell’s New-VMSwitch cmdlet, there’s an AllowManagementOS parameter which is no better, and its description — Specifies whether the parent partition (i.e. the management operating system) is to have access to the physical NIC bound to the virtual switch to be created. — makes it worse. What seems to happen far too often is that people read these and think of the virtual switch and the virtual adapters like this:
Unfortunately, this is not at all an accurate representation of Hyper-V’s virtual network stack. Once the virtual switch is bound to a physical adapter, that adapter is no longer used for anything else. TCP/IP, and most other items, are removed from it. The management operating system is quite simply unable to “share” it. If you attempt to bind anything else to the adapter, it’s quite probable that you’ll break the virtual switch.
In truth, the management operating system is getting a virtual network adapter of its own. That’s what gets connected to the virtual switch. That adapter isn’t exactly like the adapters attached to the virtual machines; it’s not quite as feature-rich. However, it’s nothing at all like actually sharing the physical adapter in the way that the controls imply. A better term would be, “Connect the management operating system to the virtual switch”. That’s what the settings really do. The following image is a much more accurate depiction of what is happening:
As you can see, the management operating system’s virtual adapter is treated the same way as that of the virtual machines’ adapters. Of course, you always have the option to take one or more physical adapters out of the virtual switch. Those will be used by the management operating system as normal. If you do that, then you don’t necessarily need to “share” the virtual switch’s adapter with the management operating system:
How to Use Physical NIC Teaming with the Hyper-V Virtual Switch
As of Windows Server 2012, network adapter teaming is now a native function of the Windows Server operating system. Teaming allows you combine two or more adapters into a single logical communications channel to distribute network traffic. Hyper-V Server can also team physical adapters.
When a teamed adapter is created, the individual adapters still appear in Windows but, in a fashion very similar to the virtual switch, can no longer be bound to anything except the teaming protocol. When the team is created, a new adapter is presented to the operating system. It would be correct to call this adapter “virtual”, since it doesn’t physically exist, but that can cause confusion with the virtual adapters used with the Hyper-V virtual switch. More common terms are team adapter or logical adapter, and sometimes the abbreviation tNIC is used.
Because teaming is not a central feature or requirement of Hyper-V, it won’t be discussed in detail here. Hyper-V does utilize native adapter teaming to great effect and, therefore, it should be used whenever possible. As a general rule, you should choose the Dynamic load balancing algorithm unless you have a clearly defined overriding need; it combines the best features of the Hyper-V Port and Transport Ports algorithms. As for whether or not to use the switch independent teaming mode or one of the switch dependent modes, that is a deeper discussion that involves balancing your goals against the capabilities of the hardware that is available to you. For a much deeper treatment of the subject of teaming with Hyper-V, consult the following articles in the Altaro blog:
How to Set Up a Native Team in Hyper-V Server 2012 – This article is mostly focused on the “how-to”. It was written too early to include a discussion of the new Dynamic algorithm. You can choose it as an alternative to the Hyper-V Port and hash algorithms.
Load-Balancing Algorithms – This article includes a complete discussion of all of the available load-balancing algorithms.
[thrive_leads id=’17165′]
Hyper-V and Network Convergence
Network convergence simply means that multiple traffic types are combined in a single communications channel. To a certain degree, Hyper-V always does this since several virtual machines use the same virtual switch, therefore the same network hardware. However, that could all technically be classified under a single heading of “virtual machine traffic”, so it’s not quite convergence.
In the Hyper-V space, true convergence would include at least one other role and it would include at least two physical network adapters. The simplest way to achieve this is by teaming two or more adapters as talked about in the preceding section and then creating a virtual switch atop the team adapter. When the virtual switch is created, use the “share” option or PowerShell to create a virtual adapter for the management operating system as well. If that adapter is used for anything in the management operating system, then that is considered convergence. Other possible roles will be discussed later on.
While the most common convergence typically binds all adapters of the same speed into a single channel, that’s not a requirement. You may use one team for virtual machine traffic and another for the management operating system if you wish.
Hyper-V and Networking within a Cluster
Failover Clustering has its own special networking needs, and Hyper-V extends those requirements further. Each node begins with the same requirements as a standalone Hyper-V system: one management adapter and a virtual switch. A cluster adds the need for cluster-related traffic and Live Migration.
In versions prior to 2012, the only supported configuration required that all of these roles be separated into unique gigabit connections. With the enhancements introduced in 2012 and 2012 R2, these requirements are much more relaxed. There aren’t any published requirements with the new versions (although it could be argued that the requirements for 2008 R2 were never officially superseded, so they are technically still enforced). In practice, it’s been observed that it is absolutely necessary for there to be at least two unique cluster paths, but the rest can be adjusted up or down depending on your workloads.
The following describes each role and gives a brief description of its traffic:
Management: This role will carry all traffic for host-level backups and any host-related file sharing activities, such as accessing or copying ISO images from a remote system. During other periods, this role usually does not experience a heavy traffic load. The typical usage is for remote management traffic, such as RDP and WS-Man (PowerShell), which are very light.
Cluster Communications: Each node in the cluster continually communicates with all the other nodes in a mesh pattern to ensure that the cluster is still in operation. This operation is commonly known as the “heartbeat”, although network configuration information is also traded. Heartbeat traffic is typically very light, but it is extremely sensitive to latency. If it does not have a dedicated network, it can easily be drowned out by other operations, such as large file copies, which will cause nodes to lose quorum and fail over virtual machines even though nothing is technically wrong.
Cluster Shared Volumes: CSV traffic is not a unique role; it travels as part of standard cluster communications. When all is well, CSV traffic is fairly minimal, only passing CSV metadata information between the nodes. If a CSV goes into Redirected Access mode, then all traffic to and from that CSV will be handled by the owner node. If any other node needs to access that CSV, it will do so over a cluster network. The cluster will ensure that the normal cluster communications, such as heartbeat, are not sacrificed, but any struggles for bandwidths will cause virtual machines to perform poorly – and possibly crash. If your cluster does not use CSVs, then this traffic is not a concern.
Live Migration: Without constraints, a Live Migration operation will use up as much bandwidth as it can. The typical configuration provides a dedicated adapter for this role. With converged networking, the requirement is not as strict.
Virtual Machine traffic: VM traffic is arguably the most important in the cluster, but it also tends to not be excessively heavy. The traditional approach is to dedicate at least one adapter to the virtual switch.
While legacy builds simply separated these onto unique, dedicated gigabit pipes, you now have more options at your disposal.
SMB Enhancements for Cluster Communications
Cluster communications have always used the SMB protocol. The SMB protocol was upgraded substantially in 2012 and now has the ability to multichannel. This feature will auto-negotiate between the source and destination host and will automatically spread SMB traffic across all available adapters.
Whereas it used to be necessary to set networks for cluster communications and then modify metric assignments to guide traffic, the preferred approach in 2012 R2 is to simply designate two or more networks as cluster networks. The hosts will automatically balance traffic loads.
SMB Enhancements for Live Migration
If the cluster’s nodes are all set to use SMB for Live Migration, then it will take advantage of the same SMB enhancements that the standard cluster communications use. In this way, management traffic, cluster communications traffic, and Live Migration could all be run across only two distinct networks instead of two. This is potentially risky, especially if Redirected Access mode is triggered.
Converged Networking Benefits for Clustering
By using converged networks, you gain substantially more options with less hardware. SMB multichannel divides traffic across distinct networks – that is, unique subnets. By using converged networks, you can create more subnets than you have physical adapters.
This is especially handy for 10GbE adapters since few hosts will have more than two. It also has its place on 1GbE networks. You can simply combine all physical adapters into one single large team and create the same number of logical networks that you would have for a traditional role, but enable each of them for cluster communications and Live Migration. This way, SMB multichannel will be able to automatically load balance its needs. Remember that even with converged networking, it’s best to not combine all roles onto a single virtual or teamed adapter. SMB multichannel requires distinct subnets to perform its role and teaming balances some traffic according to the virtual adapter.
Quality of Service Benefits for Clustering
While the concern is rarely manifested, it is technically possible for one traffic type to fully consume a converged team. There are a number of QoS (Quality of Service) options available to prevent this from occurring. You can specifically limit SMB and/or Live Migration traffic and set maximums and minimums on virtual adapters.
Before you spend much time investigating these options, be aware that most deployments do not require this degree of control and will perform perfectly well with defaults. Hyper-V will automatically work to maintain a balance of traffic that does not completely drown out any particular virtual network adapter. Because the complexity of configuring QoS outweighs its benefits in the typical environment, this topic will not be investigated in this series. The most definitive work on the subject is available on TechNet.
How to Design Cluster Networks for Hyper-V
The one critical concept is that cluster networks are defined by TCP/IP subnet. The cluster service will detect every IP address and subnet mask on each node. From those, it will create a network for each unique subnet that it finds. If any node has more than one IP address in a subnet, the cluster service will use one and ignore the rest unless the first is removed. If the service finds networks that only some nodes have IP addresses for, the network will be marked as partitioned. A network will also be marked as partitioned if cluster communications are allowed but there are problems with inter-node traffic flow. The following diagram shows some sample networks and how clustering will detect them.
In the illustration, the only valid network is Cluster Network 2. The worst is Cluster Network 4. Due to the way the subnet is configured, it overlaps with all of the other networks. The cluster service will automatically lock the node 2 adapter with IP address 192.168.5.11 out of cluster communications and mark the network as None to indicate that it is disallowed for cluster communications.
Before building your cluster, determine the IP subnets that you’ll be using. It’s perfectly acceptable to create all-new networks if necessary. For cluster communications, the nodes will not intentionally communicate with anything other than the nodes in the same cluster. The minimum number of unique networks is two. One must be marked to allow client and cluster communications; this is the management network. One must be marked to allow cluster communications (client communications optional but not recommended). Further networks are optional, but will grant the cluster the opportunity to create additional TCP streams which can help with load-balancing across teamed adapters.
Hyper-V Networking Best Practices – Configuration in Practice
There isn’t any single “correct” way to configure networking in Hyper-V any more than there is a single “correct” way to configure a physical network. This section is going to work through a number of best practices and procedures to show you how things are done and provide guidance where possible. The best advice that anyone can give you is to not overthink it. Very few virtual machines will demand a great deal of networking bandwidth.
There are a few best practices to help you make some basic configuration decisions:
A converged network results in the best overall bandwidth distribution. It is extremely rare to have any situation in which a single network role will be utilizing an entire gigabit connection constantly. By dedicating one or more adapters to a single role, you prevent any other role from using that adapter, even when its owning role is idle.
A single TCP/IP stream can only use a single physical link. One of the most confusing things about teaming that new-comers face is that combining multiple links into a single team does not automatically mean that all traffic will automatically use all available links. It means that different communications streams will be balanced across available. Or, to make that more clear, you need at least four different communications streams to fully utilize four adapters in a team.
Avoid using iSCSI or SMB 3 directly with teaming. It is supported for both, but it is less efficient than using MPIO (for iSCSI) or SMB multichannel. It is supported to have multiple virtual network adapters on a team that are configured for iSCSI or SMB multichannel. However, you will always get the best performance for network storage by using unteamed adapters that are not bound to a virtual switch. This article explains how to configure MPIO.
If iSCSI and/or SMB connections are made through virtual adapters on a converged team, they will establish only one connection per unique IP address. Create multiple virtual adapters in order to enable MPIO and/or SMB multichannel.
For Failover Clustering, plan in advance what IP range you want to use for each role. For example:
Management: 192.168.10.0/24
Cluster communications/CSV: 192.168.15.0/24
Live Migration: 192.168.20.0/24
SMB network 1: 192.168.30.0/24
SMB network 2: 192.168.31.0/24
The only adapter in the management operating system that should have a default gateway is the management adapter. Assigning default gateways to other adapters will cause the system unnecessary difficulty when choosing outbound connections.
If cluster nodes have adapters that will only be used to communicate with back-end storage (iSCSI or SMB), exclude their networks from participating in cluster communications.
Only the management adapter should register itself in DNS.
Except for the one created by checking Allow the management operating system to share this network adapter, you cannot use the GUI to create virtual network adapters for the management operating system’s use.
You cannot use the GUI to establish a QoS policy for the virtual switch. The only time this policy can be selected is during switch creation.
If desired, virtual machines can have their IP addresses in the same range as any of the cluster roles. Failover Clustering does not see the ranges in use by virtual machines and will not collide with them.
The management operating system will allow you to team network adapters with different feature sets and even different speeds, but it is highly recommended that you not do this. Different features can result in odd behaviors as communication are load balanced. The system balances loads in round-robin fashion, not based on adapter characteristics (for instance, it will not prioritize a 10GbE link over a 1GbE link).
Networking QoS only applies to outbound communications. Inbound traffic will flow as quickly as it is delivered and can be processed.
10GbE links have the ability to outpace the processing capabilities of the virtual switch. A single virtual adapter or communications stream may top out at speeds as low as 3.5 Gbps, depending upon the processing power of the CPU. Balanced loads will be able to consume the entire 10GbE link, especially when offloading technologies, primarily VMQ, are in place and functional.
When teaming, choose the Dynamic load balancing algorithm unless you have a definite, verifiable reason not to. Do not prefer the Hyper-V Port mode simply based on its name; Dynamic combines the best aspects of the Hyper-V Port and Hash modes.
You can use iSCSI on a virtual machine’s virtual adapter(s) to connect it/them directly to network storage. You will have better performance and access to more features by connecting from the host and exposing storage to the guests through a VHDX. Virtual machines can have multiple network adapters, which enables you to connect the same virtual machine to different VLANs and subnets.
Avoid the creation of multiple virtual switches. Some other hypervisors require the administrator to create multiple virtual switches and attach them to the same hardware. Hyper-V allows only a single virtual switch per physical adapter or team. Likewise, it is not advisable to segregate physical adapters, whether standalone or in separate teams, for the purpose of hosting multiple virtual switches. It is more efficient to combine them into a single large team. The most common exception to this guideline is in situations where physical isolation of networks is required.
If your system is running a GUI edition of Windows Server, you can configure TCP/IP for all adapters using the traditional graphical tools. For all versions, you can also use sconfig.cmd for a guided process. This section shows how to perform these tasks using PowerShell. To keep the material as concise as possible, not all possible options will be shown. Refer to the introductory PowerShell article for assistance on using discovering the capabilities of cmdlets using Get-Help and other tools.
See Adapter Status (and Names to Use in Other Cmdlets)
Get-NetAdapter
Rename a Physical or Team Adapter
Rename-NetAdapter Name CurrentName NewName NewName
One final option that you may wish to consider is setting Jumbo Frames on your virtual adapters. A Jumbo Frame is any TCP/IP packet that exceeds the base size of 1514 bytes. It’s most commonly used for iSCSI connections, but can also help a bit with SMB 3 and Live Migration traffic. It’s not useful at all for traffic crossing the Internet and most regular LAN traffic doesn’t benefit much from it either. If you’d like to use it, the following post explains it in detail: https://www.altaro.com/hyper-v/how-to-adjust-mtu-jumbo-frames-on-hyper-v-and-windows-server-2012/. That particular article was written for 2012. The virtual switch in 2012 R2 has Jumbo Frames enabled by default, so you only need to follow the portions that explain how to set it on your physical and virtual adapters.
Configuring Virtual Switches and Virtual Adapters
All of the graphical tools for creating a virtual switch and setting up a single virtual adapter for the management operating system were covered in this previous article in the series. You cannot use the graphical tools to create any further virtual adapters for use by the management operating system. You also must use PowerShell to create your virtual switch if you want to control its QoS policy. The following PowerShell commands deal with the virtual switch and its adapters.
There are several things to note about this particular cmdlet:
The “InterfaceAlias” parameter shown above is actually an alias for “NetAdapterName”. The alias was chosen here because it aligns with the parameter name and output of Get-NetAdapter.
The cmdlet was typed with “vSwitch” as the virtual switch’s name, but you’re allowed to use anything you like. If your chosen name has a space in it, you must enclose it in single or double quotes.
If you do not specify the “AllowManagementOS” parameter or if you set it to true, it will automatically create a virtual adapter for the management operating system with the same name as the virtual switch. Skipping this automatic creation gives you greater control over creating and setting your own virtual adapters.
If you do not wish to enable SR-IOV on your virtual switch, it is not necessary to specify that parameter at all. It is shown here as a reminder that if you’re going to set it, you must set it when the switch is created. You cannot change this later.
The help documentation for Get-VMSwitch indicates that the default for “MinimumBandwidthMode” is “Weight”. This is incorrect. The default mode is “Absolute”. As with SR-IOV support, you cannot modify this setting after the switch is created.
Create a Private Virtual Switch
New-VMSwitch Name Isolated SwitchType Private MinimumBandwidthMode Weight
Many of the notes from the creation of the external switch apply here as well. The “EnableIOV” switch is not applicable to a private or internal switch at all. The “AllowManagementOS” switch is redundant: if the switch type is “Private” then no virtual adapter is created; if the switch type is “Internal”, then one is created. Adding one virtual adapter to the management OS on a Private switch will convert it to internal; removing all management OS virtual adapters from an Internal switch will make it Private.
Permanently Remove a Virtual Switch
Remove-VMSwitch Name vSwitch
This operation is permanent. The entire switch and all of its settings are lost. All virtual adapters in the management operating system on this switch are permanently lost. Virtual adapters in virtual machines connected to this switch are disconnected.
Add a Virtual Adapter to the Management OS
Add-VMNetworkAdapter ManagementOS SwitchName vSwitch Name 'New vAdapter'
The first thing to note is that, for some reason, this cmdlet uses “Add” instead of the normal “New” verb for creating a new object. Be aware that this new adapter will show up in Get-NetAdapter entries as vEthernet (New vAdapter) and that is the name that you’ll use for all such non-Hyper-V cmdlets. Use the same cmdlets from the previous section to configure
Retrieve a List of Virtual Adapters in the Management OS
Get-VMNetworkAdapter –ManagementOS
Rename a Virtual Adapter in the Management OS
Rename-VMNetworkAdapter ManagementOS Name CurrentName NewName NewName
How to Set VLAN Information for Hyper-V Virtual Adapters
Adapters for the management operating system and virtual machines can be assigned to VLANs. When this occurs, the Hyper-V virtual switch will handle the 802.1q tagging process for communications across the virtual switches and for packets to and from physical switches. As shown in the article on Virtual Machine settings, you can use Hyper-V Manager to change the VLAN for any of the adapters attached to virtual machines. You can only use PowerShell to change the VLAN for virtual adapters in the management operating system.
Retrieve the VLAN Assignments for All Virtual Adapters on the Host
GetVMNetworkAdapterVlan
You can use the “ManagementOS” parameter to see only adapters in the management operating system. You can use the “VMName” parameter with an asterisk to see only adapters attached to virtual machines.
Set the VLAN for a Virtual Adapter in the Management Operating System
Remove VLAN Tagging from all of a Virtual Machine’s Adapters
Set-VMNetworkAdapterVlan -VMName svtest –Untagged
If a virtual machine has more than one virtual adapter and you’d like to operate on it separately, that might require a bit more work. When the GUI is used to create virtual adapters for a virtual machine, they are always named Network Adapter, even if there are several. So, you’ll have to use PowerShell to rename them as they are created or you won’t be able to use the “VMNetworkAdapterName” to distinguish them. Instead, you can use Get-VMNetworkAdapter to locate other distinguishing features and pipe the output to cmdlets that accept VMNetworkAdapter objects. For example, you want to change the VLAN of only one adapter attached to the virtual machine named “svtest”. By using the tools inside the guest operating system, you’ve determined that the MAC address of the adapter you want to change is “00-15-5D-19-0A-24”. With the MAC address, you can change the VLAN of only that adapter by using the following PowerShell construct:
It is possible to use PowerShell to configure networking for your Failover Cluster, but it’s very inelegant with the current status of those cmdlets. At this time, they are not well-configured, so you must directly manipulate object property values and registry settings in fashions that are risky and error-prone. It is much preferred that you use Failover Cluster Manager to make these settings as explained in this article earlier on in the series.
Continue Exploring Networking
There’s a lot to digest in Hyper-V virtual networking. What you’ve seen so far truly is only the fundamentals. For a relatively simplistic deployment with no more than a few dozen virtual machines, you might not ever need any more information. As densities start to climb, the need to more closely tune networking increases. With gigabit adapters, your best option is to scale out. 10GbE adapters allow you to overcome physical CPU limitations with a number of offloading techniques, chief among these being VMQ. Begin your research on that topic by starting with the definitive article series on the subject, VMQ Deep Dive.
Otherwise, your best next steps are to practice with the PowerShell cmdlets. For example, learn how to use Set-VMNetworkAdapter to modify virtual adapters in similar fashion to the procedures you saw in the earlier GUI articles. With a little effort, you’ll be able to change groups of adapters at once. Hyper-V’s networking may be multi-faceted and complicated, but the level of control granted to you is equally vast.
Fortinet recently patched a critical authentication bypass vulnerability in their FortiOS, FortiProxy, and FortiSwitchManager projects (CVE-2022-40684). This vulnerability gives an attacker the ability to login as an administrator on the affected system. To demonstrate the vulnerability in this writeup, we will be using FortiOS version 7.2.1
POC
Let’s examine the inner workings of this vulnerability. You can find our POC here. The vulnerability is used below to add an SSH key to the admin user, enabling an attacker to SSH into the effected system as admin.
FortiOS exposes a management web portal that allows a user configure the system. Additionally, a user can SSH into the system which exposes a locked down CLI interface. Our first step after familiarizing ourselves with the system was to diff the vulnerable firmware with the patched firmware.
Firmware Examination
We obtained a VMware zip file of the firmware which contained two vmdk files. First, we examined the vmdk files with virt-filesystems and mounted them with guestmount:
Interestingly, attempting to decompress the xz files fail with corruption errors:
$>xz --decompress *.xz
xz: bin.tar.xz: Compressed data is corrupt
xz: migadmin.tar.xz: Compressed data is corrupt
xz: node-scripts.tar.xz: Compressed data is corrupt
xz: usr.tar.xz: Compressed data is corrupt
Its unclear if this is an attempt at obfuscation, but we find a version of xz in the sbin folder of the firmware. We can’t run it as is, but we can patch its linker to point to our system linker to finally decompress the files:
$>xz --decompress *.xz
xz: bin.tar.xz: Compressed data is corrupt
xz: migadmin.tar.xz: Compressed data is corrupt
xz: node-scripts.tar.xz: Compressed data is corrupt
xz: usr.tar.xz: Compressed data is corrupt
$>find . -name xz
./sbin/xz
$>./sbin/xz --decompress *.xz
bash: ./sbin/xz: No such file or directory
$>file ./sbin/xz
./sbin/xz: ELF 64-bit LSB executable, x86-64, version 1 (SYSV), dynamically linked, interpreter /fortidev/lib64/ld-linux-x86-64.so.2, BuildID[sha1]=eef5d20a9f8760df951ed122a5faf4de86a7128a, for GNU/Linux 3.2.0, stripped
$>patchelf --set-interpreter /lib64/ld-linux-x86-64.so.2 sbin/xz
$>./sbin/xz --decompress *.xz
$>ls *.tar
bin.tar migadmin.tar node-scripts.tar usr.tar
Next, we untar the files and begin examining their contents. We find /bin contains a large collection of binaries, many of which are symlinks to /bin/init. The migadmin folder appears to contain the frontend web code for the administrative interface. The node-scripts folder appears to contain a NodeJs backend for the administrative interface. Lastly, the usr folder contains a libaries folder and an apache2 configuration folder.
The Patch
We apply the same steps to firmware version 7.2.2 to enable diffing of the filesystems. In the bin folder, we find the large init binary has changed and in the node-scripts folder we find the index.js file has changed:
index.js diff
This diff shows that the httpsd proxy handler explicitly sets the forwarded, x-forwarded-vdom, and x-forwarded-cert headers. This gives us a hint as to where to start looking for clues on how to exploit this vulnerability.
HTTPSD and Apache Handlers
After some searching, we discover that the init binary we mentioned earlier contains some strings matching the headers in the NodeJs diff. This init binary is rather large and appears to have a lot of functionality including Apache hooks and handlers for various management REST API endpoints. To aid in our research, we SSH’d into the system and enabled debug output for the httpsd process:
fortios_7_2_1 # diagnose debug enable
fortios_7_2_1 # diagnose debug application httpsd -1
Debug messages will be on for 5 minutes.
fortios_7_2_1 # diagnose debug cli 8
Debug messages will be on for 5 minutes.
While investigating the forwarded header, we find an apache access_check_ex hook that parses the header, extracts the for and by fields, and attaches them to the Apache request_rec structure. You can see that the for field allows us to set the client_ip field on the request record’s connection.
forwarded header parsing
Additionally, we see a log message that mentioned which handler is used for a particular request.
After searching for the handler string, we find an array of handlers in the init binary:
hander array
After investigating some of the handlers, we find that many of them make a call to a function we named api_check_access:
api_check_access
We were immediately drawn to api_check_access_for_trusted_source which first checks if the vdom socket option is trusted, but then falls through to a function we called is_trusted_ip_and_user_agent.
is_trusted_ip_and_user_agent
You can see that this function checks that the client_ip is “127.0.01” and that the User-Agent header matches the second parameter. This function gets called with two possible parameters: “Node.js” and “Report Runner”. The “Node.js” path seems to perform some additional validation, but using “Report Runner” allows us to bypass authentication and perform API requests!
Weaponization
The ability to make unauthenticated request to the the REST API is extremely powerful. However, we noticed that we could not add or change the password for the admin user. To get around this we updated the admin users SSH-keys to allow us to SSH to the target as admin. See our original announcement.
Summary
To wrap things up here is an overview of the necessary conditions of a request for exploiting this vulnerabilty:
Using the Fowarded header an attacker is able to set the client_ip to “127.0.0.1”.
The “trusted access” authentication check verifies that the client_ip is “127.0.0.1” and the User-Agent is “Report Runner” both of which are under attacker control.
Any HTTP requests to the management interface of the system that match the conditions above should be cause for concern. An attacker can use this vulnerability to do just about anything they want to the vulnerable system. This includes changing network configurations, adding new users, and initiating packet captures. Note that this is not the only way to exploit this vulnerability and there may be other sets of conditions that work. For instance, a modified version of this exploit uses the User-Agent “Node.js”. This exploit seems to follow a trend among recently discovered enterprise software vulnerabilities where HTTP headers are improperly validated or overly trusted. We have seen this in recent F5 and VMware vulnerabilities.
Fortinet on Monday revealed that the newly patched critical security vulnerability impacting its firewall and proxy products is being actively exploited in the wild.
Tracked as CVE-2022-40684 (CVSS score: 9.6), the flaw relates to an authentication bypass in FortiOS, FortiProxy, and FortiSwitchManager that could allow a remote attacker to perform unauthorized operations on the administrative interface via specially crafted HTTP(S) requests.
“Fortinet is aware of an instance where this vulnerability was exploited, and recommends immediately validating your systems against the following indicator of compromise in the device’s logs: user=’Local_Process_Access,'” the company noted in an advisory.
The list of impacted devices is below –
FortiOS version 7.2.0 through 7.2.1
FortiOS version 7.0.0 through 7.0.6
FortiProxy version 7.2.0
FortiProxy version 7.0.0 through 7.0.6
FortiSwitchManager version 7.2.0, and
FortiSwitchManager version 7.0.0
Updates have been released by the security company in FortiOS versions 7.0.7 and 7.2.2, FortiProxy versions 7.0.7 and 7.2.1, and FortiSwitchManager version 7.2.1.
The disclosure comes days after Fortinet sent “confidential advance customer communications” to its customers, urging them to apply patches to mitigate potential attacks exploiting the flaw.
If updating to the latest version isn’t an option, it’s recommended that users disable the HTTP/HTTPS administrative interface, or alternatively limit IP addresses that can access the administrative interface.
Update: The U.S. Cybersecurity and Infrastructure Security Agency (CISA) on Tuesday added the Fortinet flaw to its Known Exploited Vulnerabilities (KEV) catalog, requiring federal agencies to apply patches by November 1, 2022.
Details and proof-of-concept (PoC) code for the vulnerability are expected to become publicly available in the coming days, in a move that could enable other threat actors to adopt the exploit to their toolset and mount their own attacks.
“Vulnerabilities affecting devices on the edge of corporate networks are among the most sought after by threat actors because it leads to breaching the perimeter, and CVE-2022-40684 allows exactly this,” Zach Hanley, chief attack engineer at Horizon3.ai, said.
Actions to Help Protect Against APT Cyber Activity:
• Enforce multifactor authentication (MFA) on all user accounts. • Implement network segmentation to separate network segments based on role and functionality. • Update software, including operating systems, applications, and firmware, on network assets. • Audit account usage.
From November 2021 through January 2022, the Cybersecurity and Infrastructure Security Agency (CISA) responded to advanced persistent threat (APT) activity on a Defense Industrial Base (DIB) Sector organization’s enterprise network. During incident response activities, CISA uncovered that likely multiple APT groups compromised the organization’s network, and some APT actors had long-term access to the environment. APT actors used an open-source toolkit called Impacket to gain their foothold within the environment and further compromise the network, and also used a custom data exfiltration tool, CovalentStealer, to steal the victim’s sensitive data.
This joint Cybersecurity Advisory (CSA) provides APT actors tactics, techniques, and procedures (TTPs) and indicators of compromise (IOCs) identified during the incident response activities by CISA and a third-party incident response organization. The CSA includes detection and mitigation actions to help organizations detect and prevent related APT activity. CISA, the Federal Bureau of Investigation (FBI), and the National Security Agency (NSA) recommend DIB sector and other critical infrastructure organizations implement the mitigations in this CSA to ensure they are managing and reducing the impact of cyber threats to their networks.
Download the PDF version of this report: pdf, 692 KB
For a downloadable copy of IOCs, see the following files:
Note: This advisory uses the MITRE ATT&CK® for Enterprise framework, version 11. See the MITRE ATT&CK Tactics and Techniques section for a table of the APT cyber activity mapped to MITRE ATT&CK for Enterprise framework.
From November 2021 through January 2022, CISA conducted an incident response engagement on a DIB Sector organization’s enterprise network. The victim organization also engaged a third-party incident response organization for assistance. During incident response activities, CISA and the trusted –third-party identified APT activity on the victim’s network.
Some APT actors gained initial access to the organization’s Microsoft Exchange Server as early as mid-January 2021. The initial access vector is unknown. Based on log analysis, the actors gathered information about the exchange environment and performed mailbox searches within a four-hour period after gaining access. In the same period, these actors used a compromised administrator account (“Admin 1”) to access the EWS Application Programming Interface (API). In early February 2021, the actors returned to the network and used Admin 1 to access EWS API again. In both instances, the actors used a virtual private network (VPN).
Four days later, the APT actors used Windows Command Shell over a three-day period to interact with the victim’s network. The actors used Command Shell to learn about the organization’s environment and to collect sensitive data, including sensitive contract-related information from shared drives, for eventual exfiltration. The actors manually collected files using the command-line tool, WinRAR. These files were split into approximately 3MB chunks located on the Microsoft Exchange server within the CU2\he\debug directory. See Appendix: Windows Command Shell Activity for additional information, including specific commands used.
During the same period, APT actors implanted Impacket, a Python toolkit for programmatically constructing and manipulating network protocols, on another system. The actors used Impacket to attempt to move laterally to another system.
In early March 2021, APT actors exploited CVE-2021-26855, CVE-2021-26857, CVE-2021-26858, and CVE-2021-27065 to install 17 China Chopper webshells on the Exchange Server. Later in March, APT actors installed HyperBro on the Exchange Server and two other systems. For more information on the HyperBro and webshell samples, see CISA MAR-10365227-2 and -3.
In April 2021, APT actors used Impacket for network exploitation activities. See the Use of Impacket section for additional information. From late July through mid-October 2021, APT actors employed a custom exfiltration tool, CovalentStealer, to exfiltrate the remaining sensitive files. See the Use of Custom Exfiltration Tool: CovalentStealer section for additional information.
APT actors maintained access through mid-January 2022, likely by relying on legitimate credentials.
Use of Impacket
CISA discovered activity indicating the use of two Impacket tools: wmiexec.py and smbexec.py. These tools use Windows Management Instrumentation (WMI) and Server Message Block (SMB) protocol, respectively, for creating a semi-interactive shell with the target device. Through the Command Shell, an Impacket user with credentials can run commands on the remote device using the Windows management protocols required to support an enterprise network.
The APT cyber actors used existing, compromised credentials with Impacket to access a higher privileged service account used by the organization’s multifunctional devices. The threat actors first used the service account to remotely access the organization’s Microsoft Exchange server via Outlook Web Access (OWA) from multiple external IP addresses; shortly afterwards, the actors assigned the Application Impersonation role to the service account by running the following PowerShell command for managing Exchange:
This command gave the service account the ability to access other users’ mailboxes.
The APT cyber actors used virtual private network (VPN) and virtual private server (VPS) providers, M247 and SurfShark, as part of their techniques to remotely access the Microsoft Exchange server. Use of these hosting providers, which serves to conceal interaction with victim networks, are common for these threat actors. According to CISA’s analysis of the victim’s Microsoft Exchange server Internet Information Services (IIS) logs, the actors used the account of a former employee to access the EWS. EWS enables access to mailbox items such as email messages, meetings, and contacts. The source IP address for these connections is mostly from the VPS hosting provider, M247.
Use of Custom Exfiltration Tool: CovalentStealer
The threat actors employed a custom exfiltration tool, CovalentStealer, to exfiltrate sensitive files.
CovalentStealer is designed to identify file shares on a system, categorize the files, and upload the files to a remote server. CovalentStealer includes two configurations that specifically target the victim’s documents using predetermined files paths and user credentials. CovalentStealer stores the collected files on a Microsoft OneDrive cloud folder, includes a configuration file to specify the types of files to collect at specified times and uses a 256-bit AES key for encryption. See CISA MAR-10365227-1 for additional technical details, including IOCs and detection signatures.
MITRE ATT&CK Tactics and Techniques
MITRE ATT&CK is a globally accessible knowledge base of adversary tactics and techniques based on real-world observations. CISA uses the ATT&CK Framework as a foundation for the development of specific threat models and methodologies. Table 1 lists the ATT&CK techniques employed by the APT actors.
Actors obtained and abused credentials of existing accounts as a means of gaining Initial Access, Persistence, Privilege Escalation, or Defense Evasion. In this case, they exploited an organization’s multifunctional device domain account used to access the organization’s Microsoft Exchange server via OWA.
Actors abused PowerShell commands and scripts to map shared drives by specifying a path to one location and retrieving the items from another. See Appendix: Windows Command Shell Activity for additional information.
Command and Scripting Interpreter: Windows Command Shell
Actors abused the Windows Command Shell to learn about the organization’s environment and to collect sensitive data. See Appendix: Windows Command Shell Activity for additional information, including specific commands used.The actors used Impacket tools, which enable a user with credentials to run commands on the remote device through the Command Shell.
Actors executed malicious payloads via loading shared modules. The Windows module loader can be instructed to load DLLs from arbitrary local paths and arbitrary Universal Naming Convention (UNC) network paths.
Actors obtained and abused credentials of existing accounts as a means of gaining Initial Access, Persistence, Privilege Escalation, or Defense Evasion.
Actors obtained and abused credentials of existing accounts as a means of gaining Initial Access, Persistence, Privilege Escalation, or Defense Evasion. In this case, they exploited an organization’s multifunctional device domain account used to access the organization’s Microsoft Exchange server via OWA.
Actors obtained and abused credentials of existing accounts as a means of gaining Initial Access, Persistence, Privilege Escalation, or Defense Evasion. In this case, they exploited an organization’s multifunctional device domain account used to access the organization’s Microsoft Exchange server via OWA.
Actors used Windows command shell commands to detect and avoid virtualization and analysis environments. See Appendix: Windows Command Shell Activity for additional information.
Actors used the taskkill command to probably disable security features. CISA was unable to determine which application was associated with the Process ID.
Actors used the systeminfo command to look for details about the network configurations and settings and determine if the system was a VMware virtual machine.The threat actor used route print to display the entries in the local IP routing table.
System Network Configuration Discovery: Internet Connection Discovery
Actors checked for internet connectivity on compromised systems. This may be performed during automated discovery and can be accomplished in numerous ways.
Actors attempted to identify the primary user, currently logged in user, set of users that commonly use a system, or whether a user is actively using the system.
Actors used the tasklist command to get information about running processes on a system and determine if the system was a VMware virtual machine.The actors used tasklist.exe and find.exe to display a list of applications and services with their PIDs for all tasks running on the computer matching the string “powers.”
Actors used the ipconfig command to get detailed information about the operating system and hardware and determine if the system was a VMware virtual machine.
Actors likely used net share command to display information about shared resources on the local computer and decide which directories to exploit, the powershell dircommand to map shared drives to a specified path and retrieve items from another, and the ntfsinfo command to search network shares on computers they have compromised to find files of interest.The actors used dir.exe to display a list of a directory’s files and subdirectories matching a certain text string.
Actors used a non-application layer protocol for communication between host and Command and Control (C2) server or among infected hosts within a network.
Actors used the certutil command with three switches to test if they could download files from the internet.The actors employed CovalentStealer to exfiltrate the files.
Actors scheduled data exfiltration to be performed only at certain times of day or at certain intervals and blend traffic patterns with normal activity.
Exfiltration Over Web Service: Exfiltration to Cloud Storage
The actor’s CovalentStealer tool stores collected files on a Microsoft OneDrive cloud folder.
DETECTION
Given the actors’ demonstrated capability to maintain persistent, long-term access in compromised enterprise environments, CISA, FBI, and NSA encourage organizations to:
Monitor logs for connections from unusual VPSs and VPNs. Examine connection logs for access from unexpected ranges, particularly from machines hosted by SurfShark and M247.
Monitor for suspicious account use (e.g., inappropriate or unauthorized use of administrator accounts, service accounts, or third-party accounts). To detect use of compromised credentials in combination with a VPS, follow the steps below:
Review logs for “impossible logins,” such as logins with changing username, user agent strings, and IP address combinations or logins where IP addresses do not align to the expected user’s geographic location.
Search for “impossible travel,” which occurs when a user logs in from multiple IP addresses that are a significant geographic distance apart (i.e., a person could not realistically travel between the geographic locations of the two IP addresses in the time between logins). Note: This detection opportunity can result in false positives if legitimate users apply VPN solutions before connecting to networks.
Search for one IP used across multiple accounts, excluding expected logins.
Take note of any M247-associated IP addresses used along with VPN providers (e.g., SurfShark). Look for successful remote logins (e.g., VPN, OWA) for IPs coming from M247- or using SurfShark-registered IP addresses.
Identify suspicious privileged account use after resetting passwords or applying user account mitigations.
Search for unusual activity in typically dormant accounts.
Search for unusual user agent strings, such as strings not typically associated with normal user activity, which may indicate bot activity.
Review the YARA rules provided in MAR-10365227-1 to assist in determining whether malicious activity has been observed.
Monitor for the installation of unauthorized software, including Remote Server Administration Tools (e.g., psexec, RdClient, VNC, and ScreenConnect).
Monitor for anomalous and known malicious command-line use. See Appendix: Windows Command Shell Activity for commands used by the actors to interact with the victim’s environment.
Monitor for unauthorized changes to user accounts (e.g., creation, permission changes, and enabling a previously disabled account).
CONTAINMENT AND REMEDIATION
Organizations affected by active or recently active threat actors in their environment can take the following initial steps to aid in eviction efforts and prevent re-entry:
Report the incident. Report the incident to U.S. Government authorities and follow your organization’s incident response plan.
Report incidents to CISA via CISA’s 24/7 Operations Center (report@cisa.gov or 888-282-0870).
For DIB incident reporting, contact the Defense Cyber Crime Center (DC3) via DIBNET at dibnet.dod.mil/portal/intranet or (410) 981 0104.
Reset all login accounts. Reset all accounts used for authentication since it is possible that the threat actors have additional stolen credentials. Password resets should also include accounts outside of Microsoft Active Directory, such as network infrastructure devices and other non-domain joined devices (e.g., IoT devices).
Monitor SIEM logs and build detections. Create signatures based on the threat actor TTPs and use these signatures to monitor security logs for any signs of threat actor re-entry.
Enforce MFA on all user accounts. Enforce phishing-resistant MFA on all accounts without exception to the greatest extent possible.
Audit accounts and permissions. Audit all accounts to ensure all unused accounts are disabled or removed and active accounts do not have excessive privileges. Monitor SIEM logs for any changes to accounts, such as permission changes or enabling a previously disabled account, as this might indicate a threat actor using these accounts.
Mitigation recommendations are usually longer-term efforts that take place before a compromise as part of risk management efforts, or after the threat actors have been evicted from the environment and the immediate response actions are complete. While some may be tailored to the TTPs used by the threat actor, recovery recommendations are largely general best practices and industry standards aimed at bolstering overall cybersecurity posture.
Segment Networks Based on Function
Implement network segmentation to separate network segments based on role and functionality. Proper network segmentation significantly reduces the ability for ransomware and other threat actor lateral movement by controlling traffic flows between—and access to—various subnetworks. (See CISA’s Infographic on Layering Network Security Through Segmentation and NSA’s Segment Networks and Deploy Application-Aware Defenses.)
Isolate similar systems and implement micro-segmentation with granular access and policy restrictions to modernize cybersecurity and adopt Zero Trust (ZT) principles for both network perimeter and internal devices. Logical and physical segmentation are critical to limiting and preventing lateral movement, privilege escalation, and exfiltration.
Manage Vulnerabilities and Configurations
Update software, including operating systems, applications, and firmware, on network assets. Prioritize patching known exploited vulnerabilities and critical and high vulnerabilities that allow for remote code execution or denial-of-service on internet-facing equipment.
Implement a configuration change control process that securely creates device configuration backups to detect unauthorized modifications. When a configuration change is needed, document the change, and include the authorization, purpose, and mission justification. Periodically verify that modifications have not been applied by comparing current device configurations with the most recent backups. If suspicious changes are observed, verify the change was authorized.
Search for Anomalous Behavior
Use cybersecurity visibility and analytics tools to improve detection of anomalous behavior and enable dynamic changes to policy and other response actions. Visibility tools include network monitoring tools and host-based logs and monitoring tools, such as an endpoint detection and response (EDR) tool. EDR tools are particularly useful for detecting lateral connections as they have insight into common and uncommon network connections for each host.
Monitor the use of scripting languages (e.g., Python, Powershell) by authorized and unauthorized users. Anomalous use by either group may be indicative of malicious activity, intentional or otherwise.
Restrict and Secure Use of Remote Admin Tools
Limit the number of remote access tools as well as who and what can be accessed using them. Reducing the number of remote admin tools and their allowed access will increase visibility of unauthorized use of these tools.
Use encrypted services to protect network communications and disable all clear text administration services(e.g., Telnet, HTTP, FTP, SNMP 1/2c). This ensures that sensitive information cannot be easily obtained by a threat actor capturing network traffic.
Implement a Mandatory Access Control Model
Implement stringent access controls to sensitive data and resources. Access should be restricted to those users who require access and to the minimal level of access needed.
Audit Account Usage
Monitor VPN logins to look for suspicious access (e.g., logins from unusual geo locations, remote logins from accounts not normally used for remote access, concurrent logins for the same account from different locations, unusual times of the day).
Closely monitor the use of administrative accounts. Admin accounts should be used sparingly and only when necessary, such as installing new software or patches. Any use of admin accounts should be reviewed to determine if the activity is legitimate.
Ensure standard user accounts do not have elevated privileges Any attempt to increase permissions on standard user accounts should be investigated as a potential compromise.
VALIDATE SECURITY CONTROLS
In addition to applying mitigations, CISA, FBI, and NSA recommend exercising, testing, and validating your organization’s security program against threat behaviors mapped to the MITRE ATT&CK for Enterprise framework in this advisory. CISA, FBI, and NSA recommend testing your existing security controls inventory to assess how they perform against the ATT&CK techniques described in this advisory.
To get started:
Select an ATT&CK technique described in this advisory (see Table 1).
Align your security technologies against the technique.
Test your technologies against the technique.
Analyze the performance of your detection and prevention technologies.
Repeat the process for all security technologies to obtain a set of comprehensive performance data.
Tune your security program, including people, processes, and technologies, based on the data generated by this process.
CISA, FBI, and NSA recommend continually testing your security program, at scale, in a production environment to ensure optimal performance against the MITRE ATT&CK techniques identified in this advisory.
RESOURCES
CISA offers several no-cost scanning and testing services to help organizations reduce their exposure to threats by taking a proactive approach to mitigating attack vectors. See cisa.gov/cyber-hygiene-services.
U.S. DIB sector organizations may consider signing up for the NSA Cybersecurity Collaboration Center’s DIB Cybersecurity Service Offerings, including Protective Domain Name System (PDNS) services, vulnerability scanning, and threat intelligence collaboration for eligible organizations. For more information on how to enroll in these services, email dib_defense@cyber.nsa.gov.
ACKNOWLEDGEMENTS
CISA, FBI, and NSA acknowledge Mandiant for its contributions to this CSA.
APPENDIX: WINDOWS COMMAND SHELL ACTIVITY
Over a three-day period in February 2021, APT cyber actors used Windows Command Shell to interact with the victim’s environment. When interacting with the victim’s system and executing commands, the threat actors used /q and /c parameters to turn the echo off, carry out the command specified by a string, and stop its execution once completed.
On the first day, the threat actors consecutively executed many commands within the Windows Command Shell to learn about the organization’s environment and to collect sensitive data for eventual exfiltration (see Table 2).
Command
Description / Use
net share
Used to create, configure, and delete network shares from the command-line.[1] The threat actor likely used this command to display information about shared resources on the local computer and decide which directories to exploit.
powershell dir
An alias (shorthand) for the PowerShell Get-ChildItem cmdlet. This command maps shared drives by specifying a path to one location and retrieving the items from another.[2] The threat actor added additional switches (aka options, parameters, or flags) to form a “one liner,” an expression to describe commonly used commands used in exploitation: powershell dir -recurse -path e:\<redacted>|select fullname,length|export-csv c:\windows\temp\temp.txt. This particular command lists subdirectories of the target environment when.
systeminfo
Displays detailed configuration information [3], tasklist – lists currently running processes [4], and ipconfig – displays all current Transmission Control Protocol (TCP)/IP network configuration values and refreshes Dynamic Host Configuration Protocol (DHCP) and Domain Name System (DNS) settings, respectively [5]. The threat actor used these commands with specific switches to determine if the system was a VMware virtual machine: systeminfo > vmware & date /T, tasklist /v > vmware & date /T, and ipconfig /all >> vmware & date /.
route print
Used to display and modify the entries in the local IP routing table. [6] The threat actor used this command to display the entries in the local IP routing table.
netstat
Used to display active TCP connections, ports on which the computer is listening, Ethernet statistics, the IP routing table, IPv4 statistics, and IPv6 statistics.[7] The threat actor used this command with three switches to display TCP connections, prevent hostname determination of foreign IP addresses, and specify the protocol for TCP: netstat -anp tcp.
certutil
Used to dump and display certification authority (CA) configuration information, configure Certificate Services, backup and restore CA components, and verify certificates, key pairs, and certificate chains.[8] The threat actor used this command with three switches to test if they could download files from the internet: certutil -urlcache -split -f https://microsoft.com temp.html.
ping
Sends Internet Control Message Protocol (ICMP) echoes to verify connectivity to another TCP/IP computer.[9] The threat actor used ping -n 2 apple.com to either test their internet connection or to detect and avoid virtualization and analysis environments or network restrictions.
taskkill
Used to end tasks or processes.[10] The threat actor used taskkill /F /PID 8952 to probably disable security features. CISA was unable to determine what this process was as the process identifier (PID) numbers are dynamic.
PowerShell Compress-Archive cmdlet
Used to create a compressed archive or to zip files from specified files and directories.[11] The threat actor used parameters indicating shared drives as file and folder sources and the destination archive as zipped files. Specifically, they collected sensitive contract-related information from the shared drives.
On the second day, the APT cyber actors executed the commands in Table 3 to perform discovery as well as collect and archive data.
Command
Description / Use
ntfsinfo.exe
Used to obtain volume information from the New Technology File System (NTFS) and to print it along with a directory dump of NTFS meta-data files.[12]
WinRAR.exe
Used to compress files and subsequently masqueraded WinRAR.exe by renaming it VMware.exe.[13]
On the third day, the APT cyber actors returned to the organization’s network and executed the commands in Table 4.
Command
Description / Use
powershell -ep bypass import-module .\vmware.ps1;export-mft -volume e
Threat actors ran a PowerShell command with parameters to change the execution mode and bypass the Execution Policy to run the script from PowerShell and add a module to the current section: powershell -ep bypass import-module .\vmware.ps1;export-mft -volume e. This module appears to acquire and export the Master File Table (MFT) for volume E for further analysis by the cyber actor.[14]
set.exe
Used to display the current environment variable settings.[15] (An environment variable is a dynamic value pointing to system or user environments (folders) of the system. System environment variables are defined by the system and used globally by all users, while user environment variables are only used by the user who declared that variable and they override the system environment variables (even if the variables are named the same).
dir.exe
Used to display a list of a directory’s files and subdirectories matching the eagx* text string, likely to confirm the existence of such file.
tasklist.exe and find.exe
Used to display a list of applications and services with their PIDs for all tasks running on the computer matching the string “powers”.[16][17][18]
ping.exe
Used to send two ICMP echos to amazon.com. This could have been to detect or avoid virtualization and analysis environments, circumvent network restrictions, or test their internet connection.[19]
del.exe with the /f parameter
Used to force the deletion of read-only files with the *.rar and tempg* wildcards.[20]
This article describes how to use your UniFi Talk devices once they’re set up and configured in the Talk application. For more information on how to set up and configure your devices, please refer to these articles on adopting devices and using the Talk application.
For optimal performance, make sure you’re using the latest firmware for your devices and the latest UniFi Talk application version.
To configure voicemail on the Touch and Touch Max phone:
From the Keypad, dial *86 or long-press 1 to access voicemail configuration.
Follow the audio prompts to complete voicemail configuration.
Note: Visual voicemail configuration is coming soon.
To configure voicemail on the Flex phone:
Press the MESSAGE button to access voicemail configuration.
Follow the audio prompts to complete voicemail configuration.
Forward an incoming call
To forward an incoming call on the Touch and Touch Max phone:
From the incoming call screen, press the blue Forward button to view your contact list.
Select a contact to forward the incoming call.
Start a parallel call
To start a parallel call (i.e., start a new call while one or more calls are already ongoing) on the Touch and Touch Max phone:
From the active call screen, press the Add / Transfer button.
There are two options for starting a parallel call:
From the Contacts tab of the Add / Transfer screen, select a contact from your contact list.
From the Keypad tab of the Add / Transfer screen, dial a number and press the green button at the bottom of the screen.
Press the Call button to start a parallel call. The current active call will be placed on hold.
When two or more calls are active in parallel, swipe left or right to navigate between active calls.
Transfer an active call
To transfer an active call on the Touch or Touch Max phone:
From the active call screen, press the Add / Transfer button.
There are two options for transferring an active call:
From the Contacts tab of the Add / Transfer screen, select a contact from your contact list.
From the Keypad tab of the Add / Transfer screen, dial a number and press the green button at the bottom of the screen.
You will have the option to press Transfer or Warm Transfer.
If you press the Transfer button, this will utilize a cold (blind) transfer. The active call will immediately be transferred and will ring the destination phone once you press the Transfer button.
If you select the Warm Transfer option, the original caller is placed on hold while the transfer destination is dialed. The transfer destination has to pick up, at which point you have to again press the blue transfer button to complete the transfer.
To transfer an active call on the Flex phone:
While the call is active, press the TRANSFER button.
From here, you can either transfer to a specific number or a contact.
To transfer to a specific number, enter the number you’d like to transfer the call to and press the DIAL soft key.
To transfer to a contact, press the CONTACT soft key to load your contact list. Navigate the contact list using the up/down keys and dial the desired contact by pressing the DIAL soft key or the OK button.
You’re now calling the transfer destination. Once the transfer destination answers the call, press the TRANSFER button again to connect the original caller with the transfer destination.
Note: The Flex phone utilizes a warm (attended) transfer. The original caller will be placed on hold while a second call is established with the transfer destination. Once the second call is connected, the transfer can be completed to connect the original caller with the transfer destination.
Start a conference call
To start a conference call on the Touch and Touch Max phone:
From the active call screen, press the Add / Transfer button.
There are two options for adding additional parties to a conference call:
From the Contacts tab of the Add / Transfer screen, select a contact and press the Add to Call button.
From the Keypad tab of the Add / Transfer screen, dial the additional party’s number, press the green button at the bottom of the screen, and select the Add to Call option.
To start a three-way conference call on the Flex phone:
While the call is active, press the CONF soft key.
From here, you can either start a call with a specific number or a contact.
To call a specific number, enter the number you’d like to transfer the call to and press the DIAL soft key.
To call a contact, press the CONTACT soft key to load your contact list. Navigate the contact list using the up/down keys and dial the desired contact by pressing the DIAL soft key or the OK button.
You’re now calling the third party. Once the third party answers the call, press the CONF soft key again to start a conference call.
Manage your status
To manage your status on the Touch and Touch Max phone:
Press the App Selector button, located below the phone’s touchscreen to the left of the Ubiquiti logo.
Select Settings and click on My Status.
From here, you can select between three status settings:
Create a DND Allow List to allow specific numbers to ring your device when your status is set to Do Not Disturb.
Specify a redirect number using the Change Redirect Number button on the My Status page.
Available: Incoming calls will ring your device.
Do Not Disturb (DND): Incoming calls will be sent to voicemail.
Redirect: Incoming calls will be forwarded to the specified redirect number.
To manage your status on the Flex phone:
Do Not Disturb (DND): Incoming calls will be sent to voicemail.
Press the DND soft key to place your device in Do Not Disturb mode. Incoming calls will go to voicemail. When DND is enabled you will see the word DND with a symbol in the top-left corner of the screen.
Press the DND soft key again to disable Do Not Disturb mode.
Redirect: Incoming calls will be forwarded to the specified redirect number.
Press the MENU soft key, then select 2. SETTINGS.
Use the up/down keys to navigate the settings menu and select 5. CALL FORWARD.
Press the YES soft key to set a redirect status.
On the CALL FORWARD NUMBER screen, press the EDIT soft key, enter your redirect number with the keypad, and press the CONFIRM soft key.
Troubleshooting
My Talk device is showing a Connection Error screen
This error means that your Talk device cannot communicate with the Talk application.
To troubleshoot a Connection Error state:
Ensure that the Talk application is running. To check on Talk’s status, open unifi.ui.com, select your UniFi OS Console, go to Settings> Updates, and locate the Talk application tile. If Talk is stopped, click on the three dots menu in the Talk application tile and select Start.
Restart the Talk application. See this section for instructions on how to restart Talk.
Restart your UniFi OS Console by going to its Settings > Advanced and clicking Restart Console under the Console Controls header. If you’re still encountering this issue after the troubleshooting steps above, please contact Ubiquiti Support.
In this article, we are going to start by describing what the Windows Firewall feature is and what it is used for. This information will then allow you to enable and manage the Windows Firewall on your Windows PC or laptop. We will cover all the different versions of the Windows operating system that are currently supported by the Secure Remote Worker Validation Tool.
Lets first describe what a firewall actually is.
What is a firewall?
A firewall can be either a physical hardware device, software-based application that you install on your PC, or in the case of the Windows Firewall, an integrated feature of the operating system that is designed to protect your PC against the attack of malicious files. The firewall checks information and data sent across the internet or other networks to your PC. If the firewall detects that the information may contain malicious files then it will block them from reaching your PC, therefore protecting your PC from that threat. Equally, it can prevent you PC sending malicious content to other PCs.
Windows Firewall is an integrated firewall solution that is part of the Windows operating system. In this article, we are going to configure the Windows Firewall to work with Secure Remote Worker. In the following sections, we are going to discuss the process for each of the different version of the Windows operating, starting with Windows 10.
Important configuration note:
You should only have one software firewall solution installed at any one time. If you install additional security software on your PC that also has its own software-based firewall solution, then you will need to disable this if you are to use the Windows Firewall solution.
Enabling the firewall on Windows 10 devices
In this section, we are going to describe the process for enabling the Windows Firewall feature on Windows 10. Follow the steps below to work through the process of enabling the firewall:
Press the Windows key on your keyboard and then start to type in “control panel” in the search box highlighted (1). You will then see the Control Panel App appear at the top of the list as the best match, highlighted (2). Click on the Control Panel App to launch it as shown in the following screenshot:
Click to Zoom
2. You will now see the Control Panel as shown in the following screenshot:
Click to Zoom
3. Now click on System and Security as highlighted (3) in the screenshot above.
4. You will now see the System and Security configuration options as shown in the following screenshot:
Click to Zoom
5. Click on Windows Defender Firewall as highlighted (4) in the above screenshot.
6. You will now see the Windows Defender Firewall configuration screen as shown in the following screenshot:
Click to Zoom
7. Click on Turn Windows Defender Firewall on or off as highlighted (5) in the above screenshot.
8. You will now see the Customize settings for each type of network as shown in the following screenshot:
Click to Zoom 9. First, enable the firewall for private networks. To do this click the radio button for Turn on Windows Defender Firewall under the Private network settings section as highlighted (6) in the previous screenshot.
10. Next, enable the firewall for public networks. To do this click the radio button for Turn on Windows Defender Firewallunder the Publicnetwork settings section as highlighted (7) in the previous screenshot.
11. The other thing to configure is to make sure that you check the box for Notify me when Windows Defender Firewall blocks a new app for both network settings, so Public and Private. This means that you will be notified when something potentially malicious is blocked.
12. Finally, once configured, click the OK button to close the configuration window, and then click the red X button in the top right-hand corner to close the control panel.
You have now successfully enabled the Windows Firewall for Windows 10 operating systems.
Enabling the firewall on Windows 8.1 devices
In this section, we are going to describe the process for enabling the Windows Firewall feature on Windows 10. Follow the steps below to work through the process of enabling the firewall:
1. Press the Windows key on your keyboard and then start to type in “control panel” in the search box highlighted (1). You will then see the Control Panel icon appear at the top left of the screen in the Results section, highlighted (2). Double click on the Control Panel icon to launch it as shown in the following screenshot:
Click to Zoom
2. You will now see the Control Panel as shown in the following screenshot:
Click to Zoom
3. Now click on System and Security as highlighted (3) in the screenshot above.
4. You will now see the System and Security configuration options as shown in the following screenshot:
Click to Zoom
5. Click on Windows Firewall as highlighted (4) in the above screenshot.
6. You will now see the Windows Firewall configuration screen as shown in the following screenshot:
Click to Zoom
7. Click on Turn Windows Firewall on or off as highlighted (5) in the above screenshot.
8. You will now see the Customize settings for each type of network as shown in the following screenshot:
Click to Zoom
9. First, enable the firewall for domain networks. To do this click the radio button for Turn on Windows Defender Firewall under the Domainnetwork settings section as highlighted (6) in the previous screenshot.
10. Next, enable the firewall for private networks. To do this click the radio button for Turn on Windows Defender Firewall under the Privatenetwork settings section as highlighted (7) in the previous screenshot.
11. The final one to enable is the firewall for public networks. To do this click the radio button for Turn on Windows Defender Firewall under the Publicnetwork settings section as highlighted (8) in the previous screenshot.
12. The other thing to configure is to make sure that you check the box for Notify me when Windows Firewall blocks a new app for domain settings, public settings, and private settings. This means that you will be notified when something potentially malicious is blocked.
13. Finally, once configured, click the OK button to close the configuration window, and then click the red X button in the top right-hand corner to close the control panel.
You have now successfully enabled the Windows Firewall for Windows 8.x operating systems.
Enabling the firewall on Windows 7 devices
In this section, we are going to describe the process for enabling the Windows Firewall feature on Windows 7. Follow the steps below to work through the process of enabling the firewall:
1. Press the Windows key on your keyboard and then start to type in “control panel” in the search box highlighted (1). You will then see the Control Panel icon appear at the top of the screen under Programs(1), highlighted (2). Double click on the Control Panel icon to launch it as shown in the following screenshot:
Click to Zoom
2. You will now see the Control Panel as shown in the following screenshot:
Click to Zoom
3. Now click on System and Security as highlighted (3) in the screenshot above.
4. You will now see the System and Security configuration options as shown in the following screenshot:
Click to Zoom
5. Click on Windows Firewall as highlighted (4) in the above screenshot.
6. You will now see the Windows Firewall configuration screen as shown in the following screenshot:
Click to Zoom
7. Click on Turn Windows Firewall on or off as highlighted (5) in the above screenshot.
8. You will now see the Customize settings for each type of network as shown in the following screenshot:
Click to Zoom
9. First, enable the firewall for domain networks. To do this click the radio button for Turn on Windows Defender Firewall under the Domainnetwork location settings section as highlighted (6) in the previous screenshot.
10. Next, enable the firewall for private networks. To do this click the radio button for Turn on Windows Defender Firewallunder the Home or work (private)network location settings section as highlighted (7) in the previous screenshot.
11. The final one to enable is the firewall for public networks. To do this click the radio button for Turn on Windows Defender Firewallunder the Publicnetwork location settings section as highlighted (8) in the previous screenshot.
12. The other thing to configure is to make sure that you check the box for Notify me when Windows Firewall blocks a new program for domain settings, public settings, and private settings. This means that you will be notified when something potentially malicious is blocked.
13. Finally, once configured, click the OK button to close the configuration window, and then click the red X button in the top right-hand corner to close the control panel.
You have now successfully enabled the Windows Firewall for Windows 7 operating systems.
A simple guide to connecting web apps with webhooks
By Matthew Guay · September 20, 2022
You might have seen webhooks mentioned in your apps’ settings and wondered if they’re something you should use. The answer, in a nutshell, is probably yes.
Webhooks are one way that apps can send automated messages or information to other apps. It’s how PayPal tells your accounting app when your clients pay you, how Twilio routes phone calls to your number, and how WooCommerce can notify you about new orders in Slack.
They’re a simple way your online accounts can “speak” to each other and get notified automatically when something new happens. In many cases, you’ll need to know how to use webhooks if you want to automatically push data from one app to another.
Let’s break it down, learn how to speak webhook, and get your favorite apps to talk to each other.
There are two ways your apps can communicate with each other to share information: polling and webhooks. As one of our customer champion’s friends has explained it: polling is like knocking on your friend’s door and asking if they have any sugar (aka information), but you have to go and ask for it every time you want it. Webhooks are like someone tossing a bag of sugar at your house whenever they buy some. You don’t have to ask—they just automatically punt it over every time it’s available.
Webhooks are automated messages sent from apps when something happens. They have a message—or payload—and are sent to a unique URL—essentially the app’s phone number or address. Webhooks are almost always faster than polling, and require less work on your end.
They’re much like SMS notifications. Say your bank sends you an SMS when you make a new purchase. You already told the bank your phone number, so they knew where to send the message. They type out “You just spent $10 at NewStore” and send it to your phone number +1-234-567-8900. Something happened at your bank, and you got a message about it. All is well.
Webhooks work the same way.
Take another look at our example message about a new order. Bob opened your store’s website, added $10 of paper to his shopping cart, and checked out. Boom, something happened, and the app needs to tell you. Time for the webhook.
Wait: who’s the app gonna call? Just like you need to tell the bank your phone number before they can text you, for webhooks, you need to tell the originating app—your eCommerce store, in this case—the webhook URL of the receiving app, the app where you want the data to be sent.
Say you want to make an invoice for this new order. The app that creates this invoice is on the receiving end—it’s the app that needs the order data.
Automate workflows that drive success
Learn from expert Zapier users, receive personalized support, and find ways to scale your impact at our free user conference.
You’d first open your invoice app, make an invoice template, and copy its webhook URL—something like yourapp.com/data/12345. Then open your eCommerce store app, and add that URL to its webhook settings. That URL is your invoice app’s phone number, essentially. If another app pings that URL (or if you enter the URL in your browser’s address bar), the app will notice that someone is trying to send it data.
Ok. Back to the order. Your eCommerce store got the order and knows it needs to send the details to yourapp.com/data/12345. It then writes the order in a serialization format. The simplest of those formats is called “form-encoded”, and means your customer’s order would look something like this:
Customer=bob&value=10.00&item=paper
Now your eCommerce store needs to send the message. The simplest way to send data to a webhooks URL is with an HTTP GET request. Literally, that means to add the data to the URL and ping the URL (or enter it in your browser’s address bar). The same way you can open Zapier’s about page by typing /about after zapier.com, your apps can send messages to each other by tagging extra text with a question mark on the end of a website address. Here’s the full GET request for our order:
Deep inside your invoice app, something dings and says “You’ve got mail!” and the app gets to work, making a new invoice for Bob’s $10 paper order. That’s webhooks in action.
Remember when you had to check your email to see if you had new messages—and how freeing push email (“You’ve got mail!”) was? That’s what webhooks are for your apps. They don’t have to check for new info anymore. Instead, when something happens, they can push the data to each other and not waste their time checking and waiting.
→ Ready to start using webhooks? Jump ahead to skip the geeky details—or keep reading to learn more about the terms you’ll often see used with webhooks.
That’s the simple version. Technically, webhooks are “user-defined callbacks made with HTTP” according to Jeff Lindsay, one of the first people to conceptualize webhooks. Webhooks are data and executable commands sent from one app to another over HTTP instead of through the command line in your computer, formatted in XML, JSON, or form-encoded serialization. They’re called webhooks since they’re software hooks—or functions that run when something happens—that work over the web. And they’re typically secured through obscurity—each user of an application gets a unique, random URL to send webhook data to—though they can optionally be secured with a key or signature.
Webhooks typically are used to connect two different applications. When an event happens on the trigger application, it serializes data about that event and sends it to a webhook URL from the action application—the one you want to do something based on the data from the first application. The action application can then send a callback message, often with an HTTP status code like 302 to let the trigger application know if the data was received successfully or 404 if not.
Webhooks are similar to APIs—but simpler. An API is a full language for an app with functions or calls to add, edit, and retrieve data. The difference is, with an API, you have to do the work yourself. If you build an application that connects to another with an API, your application will need to have ways to ask the other app for new data when it needs it. Webhooks, on the other hand, are for one specific part of an app, and they’re automated. You might have a webhook just for new contacts—and whenever a new contact is added, the application will push the data to the other application’s webhooks URL automatically. It’s a simple, one-to-one connection that runs automatically.
How to use webhooks
You know the lingo, understand how apps can message each other with webhooks, and can even figure out what the serialized data means. You speak webhook.
It’s time to use it. The best way to make sure you understand how webhooks work is to test it out, try making your own webhooks, and see if they work. Or, you can jump ahead and just drop your webhook URL into an app to share data—after all, you don’t have to know how to make webhooks to use them.
Here are the resources you need:
Test webhooks with RequestBin and Postman
The quickest way to learn is to experiment—and it’s best to experiment with something you can’t break. With webhooks, there are two great tools for that: RequestBin (owned by Pipedream) and Postman.
How data appears in Requestbin
RequestBin lets you create a webhooks URL and send data to it to see how it’s recognized. Go to RequestBin, click Create a RequestBin, then copy the URL it gives you.You’ll need to have a Pipedream account (created with Google or GitHub) before you can view and use a URL.
Now, serialize some data in form encoded style—or copy our example form copy above. Open a new tab, paste your RequestBin URL in the URL bar, add a ? to the end, then paste your serialized data. You’ll end up with something like this:
Press enter in your browser’s address bar, and you’ll get a simple message back: success:true. Refresh your RequestBin tab, and you’ll see the data listed at the bottom as in the screenshot above.
Click REST under INTEGRATIONS to see the data.
You can then try sending POST requests in Terminal or from your own app’s code, if you’d like, using RequestBin’s sample code. That’s a bit more complex—but gives you a way to play with JSON or XML encoding, too.
The setup in Postman
Or, use another app for that. The app Postman lets you make custom HTTP requests for an easy way to send customized data to a webhooks URL. Enter the URL, then choose the HTTP request method you want to use (GET, POST, PUT, etc), and add the body data. That’ll let you send far more detailed requests to your webhook URL without having to use more code.
Add webhooks to your apps
Testing webhooks and serializing data by hand is tricky—as is copying and pasting data from your apps. Let’s skip both, and just get our apps talking to each other.
We’re using WordPress-powered form tool Gravity Forms and document template-builder app WebMerge as the examples here—but the same general idea works in most other apps that support webhooks. Here’s essentially what you need to do:
Open your form’s Webhook settings in Gravity Forms
First, enable webhooks in your app if they’re not already and open the webhooks settings (in Gravity Forms, for instance, you need to install an add-on; in Active Campaign or WooCommerce, you’ll find webhooks under the app’s default settings). Your app might have one set of webhook settings for the entire app—or, often, it’ll have a specific webhook for each form, document, or other items the app maintains.
We want the data to come from Gravity Forms, so we’ll open the Webhooks settings under the form we want to use. That gives us a URL field (this lets us tell Gravity Forms where we want to send the data) and options to specify the webhook HTTP request method (how to send the data).
Each WebMerge document template has a unique webhook URL.
Now let’s get that URL from the app that will receive the data—WebMerge, in this case. In WebMerge, each document has its own “merge URL”—and it wants the data in form encoded serialization, as you can tell from the ampersands in the example data. Copy the merge URL—or whatever URL your app offers, as it may have a different name.
Tip: You’ll often find webhook URLs and related settings under the “integration”, “webhook”, or “workflow” settings, depending on your app.
Add the webhooks URL to your trigger app so it can share data when something happens
Finally, go back to your trigger app—Gravity Forms in our case—and paste the webhook URL in Gravity Forms’ URL field. You may also be able to set the correct request method and the specific field values to ensure only the data you want is sent, and is shared with the same variable names as the receiving app uses. Save the settings, and you’re good to go.
The next time someone fills out our form that Bob ordered 10.00 of paper, Gravity Forms will send the data to WebMerge’s URL as https://www.webmerge.me/merge/149933/gxszxg?Name=Bob&Item=Paper&Value=10.00 and WebMerge will turn that into a complete invoice.
PayPal IPN is very similar to webhooks—and you can add a webhook URL to PayPal to get payment notifications
Once you start using webhooks, you’ll notice them (or similar links) everywhere, in places you never thought they’d show up. PayPal, for instance, uses Instant Payment Notifications or IPNs to send notifications whenever you receive a payment. Have an app that you’d like to do something whenever you get a PayPal payment? Add its webhooks URL to PayPal’s IPN settings and that app will get a message the next time you get money.
Or take Twimlets, Twilio‘s simple apps to forward calls, record voicemail messages, start a conference call, and more. To, say, forward a call, you’ll add a familiar, webhook-style Twimlet address like http://twimlets.com/forward?PhoneNumber=415-555-1212 to your Twilio phone number settings. Want to build your own phone-powered app, or notify another app when a new call comes in? Put your webhook URL in Twilio’s settings instead.
They might go by different names, but once you notice places where apps offer to send notifications to a unique link, you’ll often have found somewhere else webhooks can work. Now that you know how to use webhooks, you can use them to make software do whatever you want.
Use webhooks in any app with Zapier
Many apps on Zapier use webhooks behind the scenes already. You may not realize it, since Zapier apps generally handle all the actual setup for you. If you come across an app that offers webhooks as an option, you can use a webhooks step in a Zap to set that up yourself using what you’ve learned about webhooks. Note: Webhooks by Zapier is a built-in tool only available to Zapier users on a paid plan or during their trial period.
Say you have an app that can send data to a webhooks URL. To connect it to other apps, you’ll make a new Zap—what we call Zapier’s automated app workflows—and choose Webhooks by Zapier as the trigger app. Select Catch Hook, which can receive a GET, POST, or PUT request from another app. Zapier will give you a unique webhooks URL—copy that, then add it to your app’s webhooks URL field in its settings.
GET requests ask the server for data. POST requests send data to a computer. PUSH requests ask the server for specific data, typically to update it.
Zapier will parse each serialized item from your webhook data
Then have your app test the URL, or perhaps just add a new item (a new form entry, contact, or whatever thing your app makes) to have your app send the data to the webhook. Test the webhook step in Zapier, and you’ll see data from the webhook listed in Zapier.
You can add each data item from your webhook to another app in Zapier
Now you can use that data in another app. Select the action app—the app you want to send data to. You’ll see form fields to add data to that app. Click in the field where you want to add webhooks data and select it from the dropdown. Test your Zap and it’s now ready to use. Now the next time your trigger app sends data to the webhook, Zapier will automatically add it to the action app you selected.
Zapier can send any data you want to a webhooks URL
The reverse works as well. Want to send data from one app to another via webhooks? Zapier can turn the data from the trigger app into a serialized list and send it to any webhooks URL you want.
First, select the trigger app you want to send data from, and set it up in Zapier as normal. Then select Webhooks as the action app, and choose how you want to send the data (POST is typically the best option for most webhook integrations).
Finally, paste the webhooks URL from the app you want to receive the data into the URL field in Zapier’s webhook settings. You can choose how to serialize the data (form or JSON are typically best). Zapier will then automatically send all of the data from your trigger app to the webhook—or you can set the specific data variables from the Data fields below.
You can specify how Zapier serializes your data and choose the specific data it sends to your webhook
You’re now ready to use your Zap. Now whenever something new happens in your trigger app, Zapier will copy the data and send it to your other app’s webhooks URL.
Webhooks are one of the best ways to connect apps that wouldn’t otherwise work with Zapier. Have a Mac or iPhone app that doesn’t connect with Zapier? Using Alfred or Siri Shortcuts—plus a Zapier Webhooks URL—you can connect them to your Zapier workflows. Here’s how:
Ok, you’ve got this. Armed with your newfound knowledge about webhooks and their confusing terminology, you’re ready to start using them in your work. Poke around your favorite web apps’ advanced settings and see if any of them support webhooks. Think through how you could use them—then give it a shot.
And bookmark this article. Next time you read something about a GET request needing to make an HTTP callback, or see a URL with ?name=bob&value=10 and such at the end, you’ll know what it actually means.
The global cybersecurity market is flourishing. Experts at Gartner predict that the end-user spending for the information security and risk management market will grow from $172.5 billion in 2022 to $267.3 billion in 2026.
One big area of spending includes the art of putting cybersecurity defenses under pressure, commonly known as security testing. MarketsandMarkets forecasts the global penetration testing (pentesting) market size is expected to grow at a Compound Annual Growth Rate (CAGR) of 13.7% from 2022 to 2027. However, the costs and limitations involved in carrying out a penetration test are already hindering the market growth, and consequently, many cybersecurity professionals are making moves to find an alternative solution.
Pentests aren’t solving cybersecurity pain points
Pentesting can serve specific and important purposes for businesses. For example, prospective customers may ask for the results of one as proof of compliance. However, for certain challenges, this type of security testing methodology isn’t always the best fit.
1 — Continuously changing environments
Securing constantly changing environments within rapidly evolving threat landscapes is particularly difficult. This challenge becomes even more complicated when aligning and managing the business risk of new projects or releases. Since penetration tests focus on one moment in time, the result won’t necessarily be the same the next time you make an update.
2 — Rapid growth
It would be unusual for fast-growing businesses not to experience growing pains. For CISOs, maintaining visibility of their organization’s expanding attack surface can be particularly painful.
According to HelpNetSecurity, 45% of respondents conduct pentests only once or twice per year and 27% do it once per quarter, which is woefully insufficient given how quickly infrastructure and applications change.
3 — Cybersecurity skills shortages
As well as limitations in budgets and resources, finding the available skillsets for internal cybersecurity teams is an ongoing battle. As a result, organizations don’t have the dexterity to spot and promptly remediate specific security vulnerabilities.
While pentests can offer an outsider perspective, often it is just one person performing the test. For some organizations, there is also an issue on trust when relying on the work of just one or two people. Sándor Incze, CISO at CM.com, gives his perspective:
“Not all pentesters are equal. It’s very hard to determine if the pentester you’re hiring is good.”
4 — Cyber threats are evolving
The constant struggle to stay up to date with the latest cyberattack techniques and trends puts media organizations at risk. Hiring specialist skills for every new cyber threat type would be unrealistic and unsustainable.
HelpNetSecurity reported that it takes 71 percent of pentesters one week to one month to conduct a pentest. Then, more than 26 percent of organizations must wait between one to two weeks to get the test results, and 13 percent wait even longer than that. Given the fast pace of threat evolution, this waiting period can leave companies unaware of potential security issues and open to exploitation.
5 — Poor-fitting security testing solutions for agile environments
Continuous development lifecycles don’t align with penetration testing cycles (often performed annually.) Therefore, vulnerabilities mistakenly created during long security testing gaps can remain undiscovered for some time.
Bringing security testing into the 21st-century Impact
A proven solution to these challenges is to utilize ethical hacker communities in addition to a standard penetration test. Businesses can rely on the power of these crowds to assist them in their security testing on a continuous basis. A bug bounty program is one of the most common ways to work with ethical hacker communities.
What is a bug bounty program?
Bug bounty programs allow businesses to proactively work with independent security researchers to report bugs through incentivization. Often companies will launch and manage their program through a bug bounty platform, such as Intigriti.
Organizations with high-security maturity may leave their bug bounty program open for all ethical hackers in the platform’s community to contribute to (known as a public program.) However, most businesses begin by working with a smaller pool of security talent through a private program.
How bug bounty programs support continuous security testing structures
While you’ll receive a certificate to say you’re secure at the end of a penetration test, it won’t necessarily mean that’s still the case the next time you make an update. This is where bug bounty programs work well as a follow-up to pentests and enable a continuous security testing program.
The impact of bug bounty program on cybersecurity
By launching a bug bounty program, organizations experience:
More robust protection: Company data, brand, and reputation have additional protection through continuous security testing.
Enabled business goals: Enhanced security posture, leading to a more secure platform for innovation and growth.
Improved productivity: Increased workflow with fewer disruptions to the availability of services. More strategic IT projects that executives have prioritized, with fewer security “fires” to put out.
Increased skills availability: Internal security team’s time is freed by using a community for security testing and triage.
Clearer budget justification: Ability to provide more significant insights into the organization’s security posture to justify and motivate for an adequate security budget.
Improved relationships: Project delays significantly decrease without the reliance on traditional pentests.
Want to know more about setting up and launching a bug bounty program?
Intigriti is the leading European-based platform for bug bounty and ethical hacking. The platform enables organizations to reduce the risk of a cyberattack by allowing Intigriti’s network of security researchers to test their digital assets for vulnerabilities continuously.
If you’re intrigued by what you’ve read and want to know about bug bounty programs, simply schedule a meeting today with one of our experts.
Cybersecurity company Imperva has disclosed that it mitigated a distributed denial-of-service (DDoS) attack with a total of over 25.3 billion requests on June 27, 2022.
The “strong attack,” which targeted an unnamed Chinese telecommunications company, is said to have lasted for four hours and peaked at 3.9 million requests per second (RPS).
“Attackers used HTTP/2 multiplexing, or combining multiple packets into one, to send multiple requests at once over individual connections,” Imperva said in a report published on September 19.
The attack was launched from a botnet that comprised nearly 170,000 different IP addresses spanning routers, security cameras, and compromised servers located in more than 180 countries, primarily the U.S., Indonesia, and Brazil.
The disclosure also comes as web infrastructure provider Akamai said it fielded a new DDoS assault aimed at a customer based in Eastern Europe on September 12, with attack traffic spiking at 704.8 million packets per second (pps).
The same victim was previously targeted on July 21, 2022, in a similar fashion in which the attack volume ramped up to 853.7 gigabits per second (Gbps) and 659.6 million pps over a period of 14 hours.
Akamai’s Craig Sparling said the company has been “bombarded relentlessly with sophisticated distributed denial-of-service (DDoS) attacks,” indicating that the offensives could be politically motivated in the face of Russia’s ongoing war against Ukraine.
Both the disruptive attempts were UDP flood attacks where the attacker targets and overwhelms arbitrary ports on the target host with User Datagram Protocol (UDP) packets.
UDP, being both connectionless and session-less, makes it an ideal networking protocol for handling VoIP traffic. But these same traits can also render it more susceptible to exploitation.
“Without an initial handshake to ensure a legitimate connection, UDP channels can be used to send a large volume of traffic to any host,” NETSCOUT says.
“There are no internal protections that can limit the rate of a UDP flood. As a result, UDP flood DoS attacks are exceptionally dangerous because they can be executed with a limited amount of resources.”
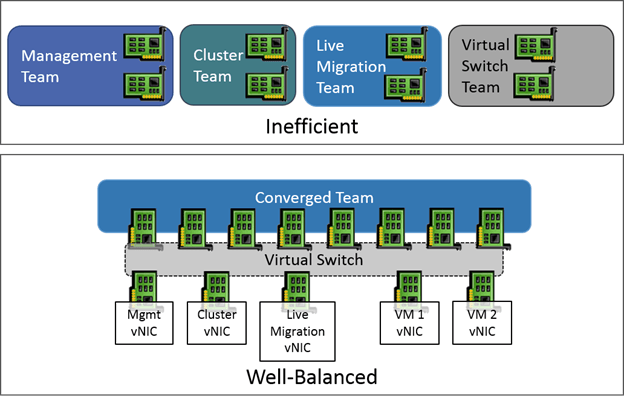
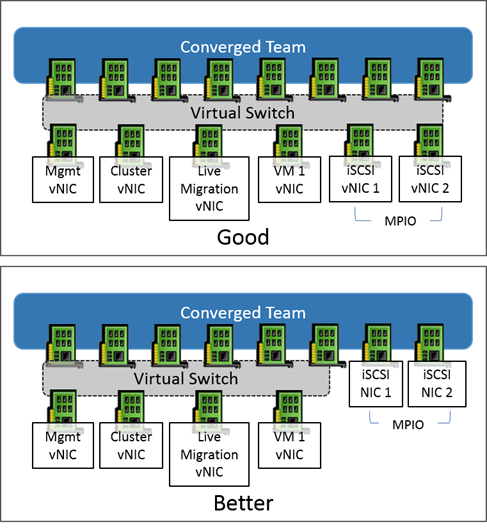


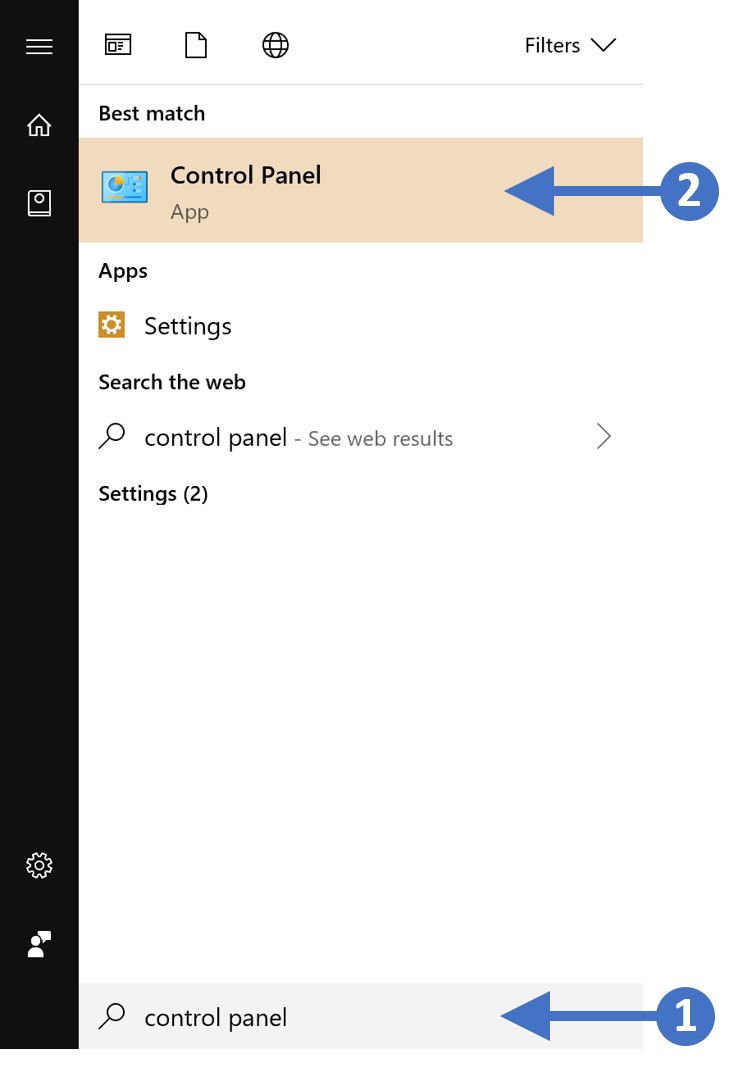
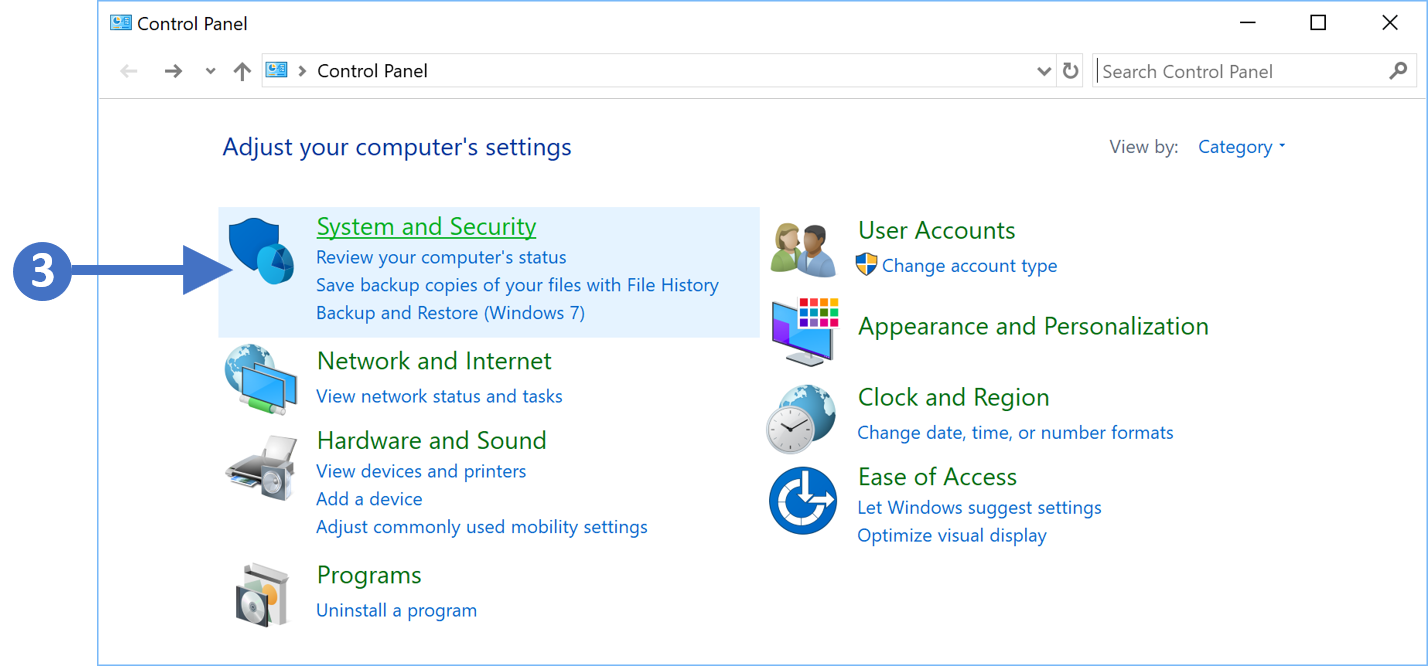
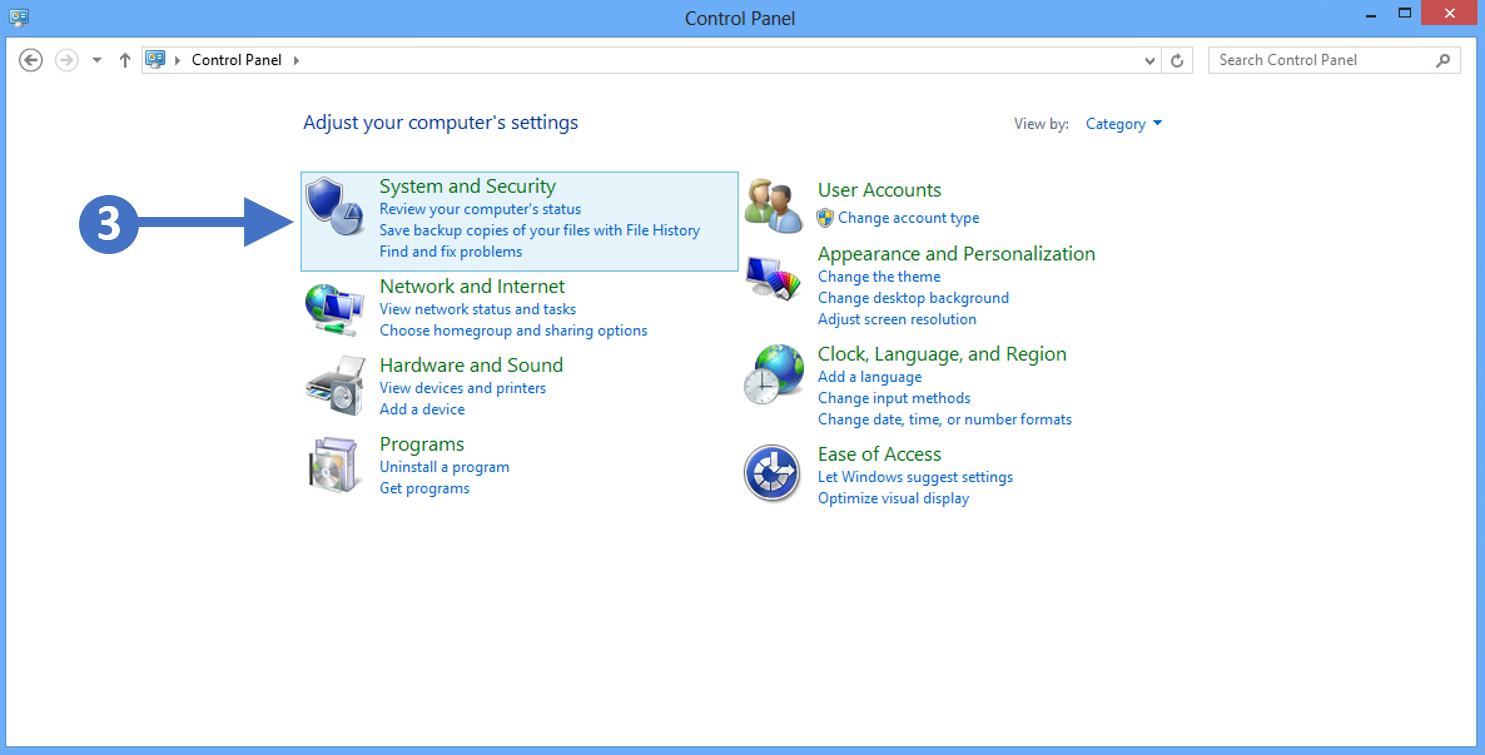
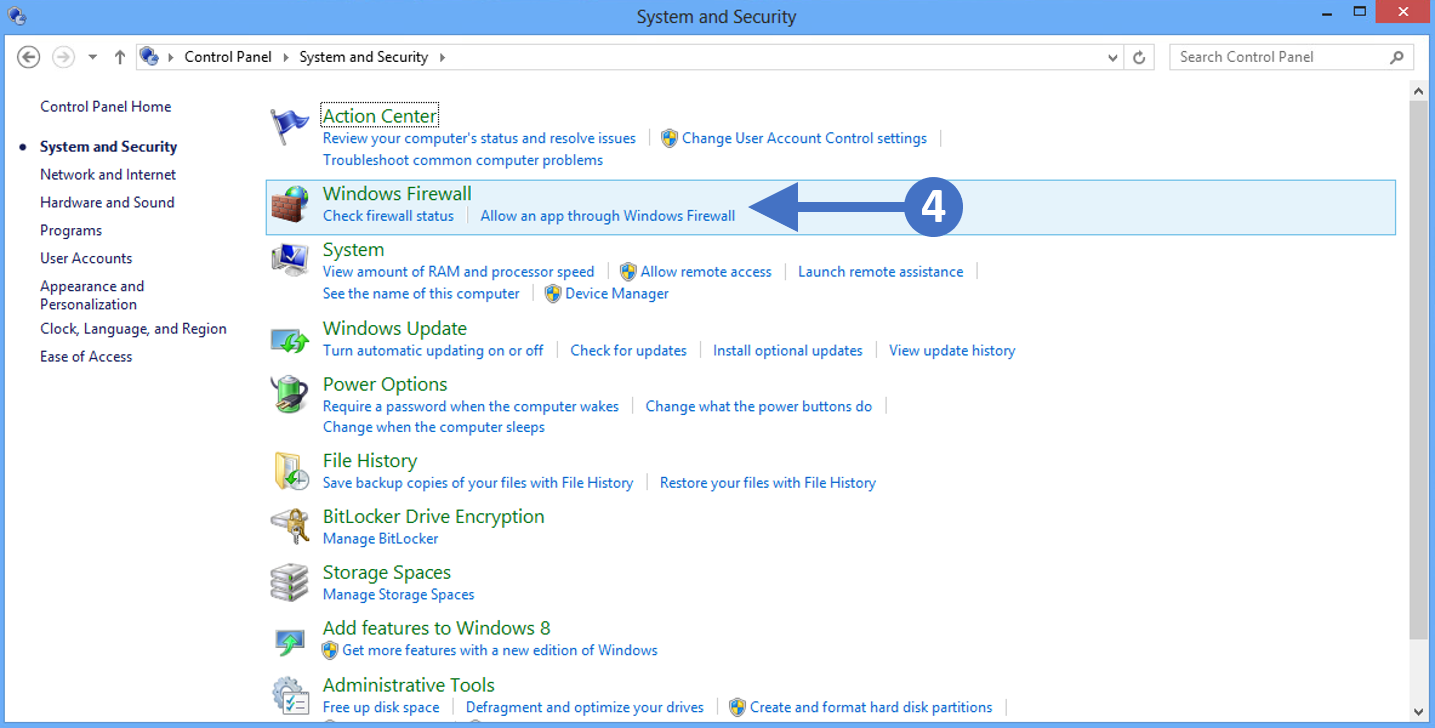
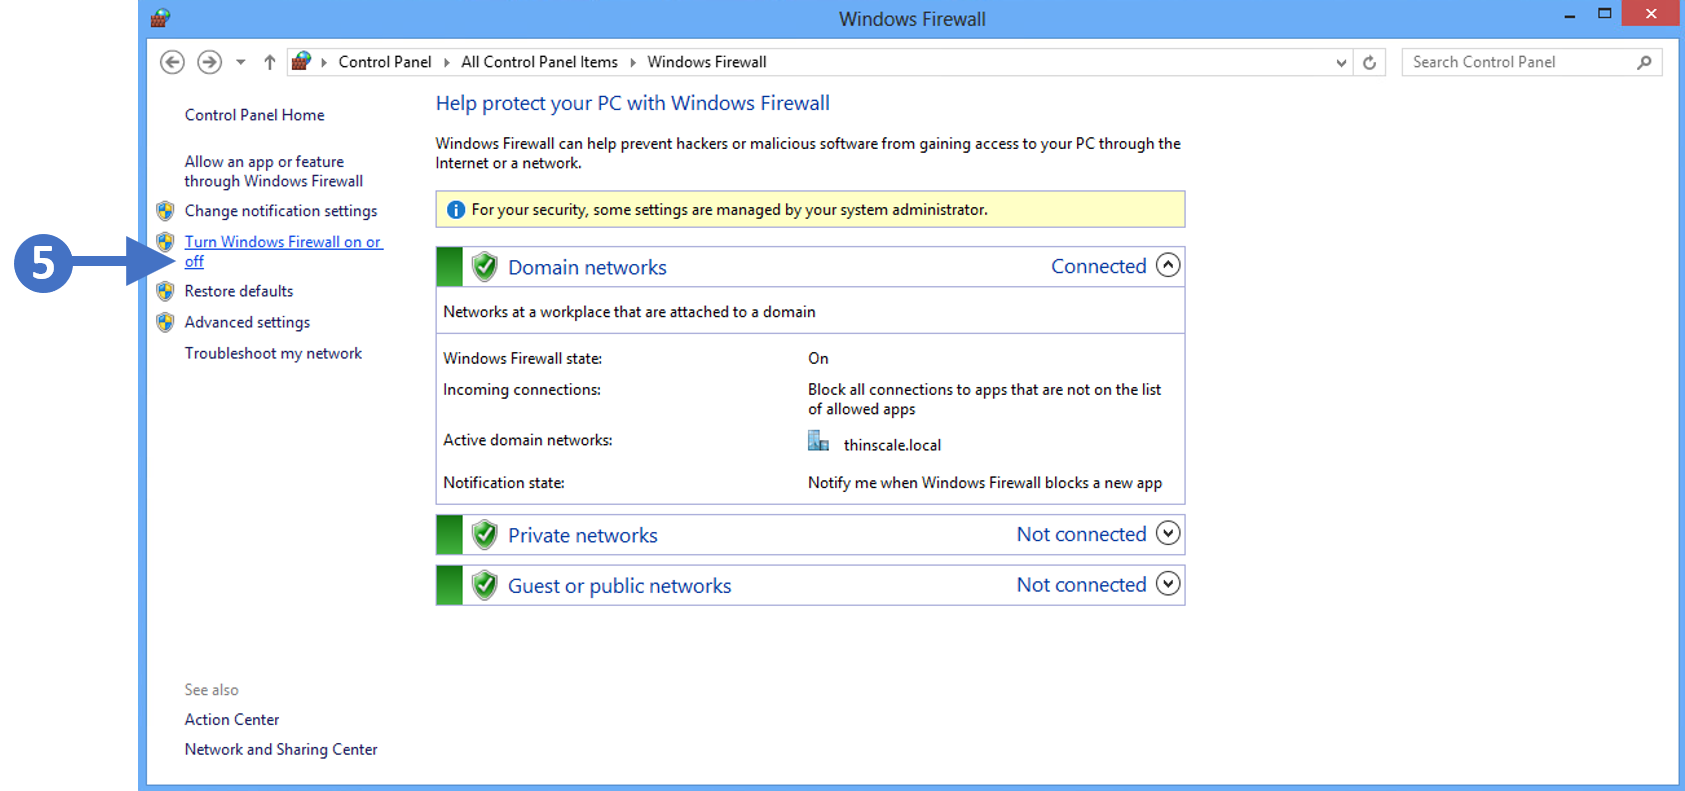
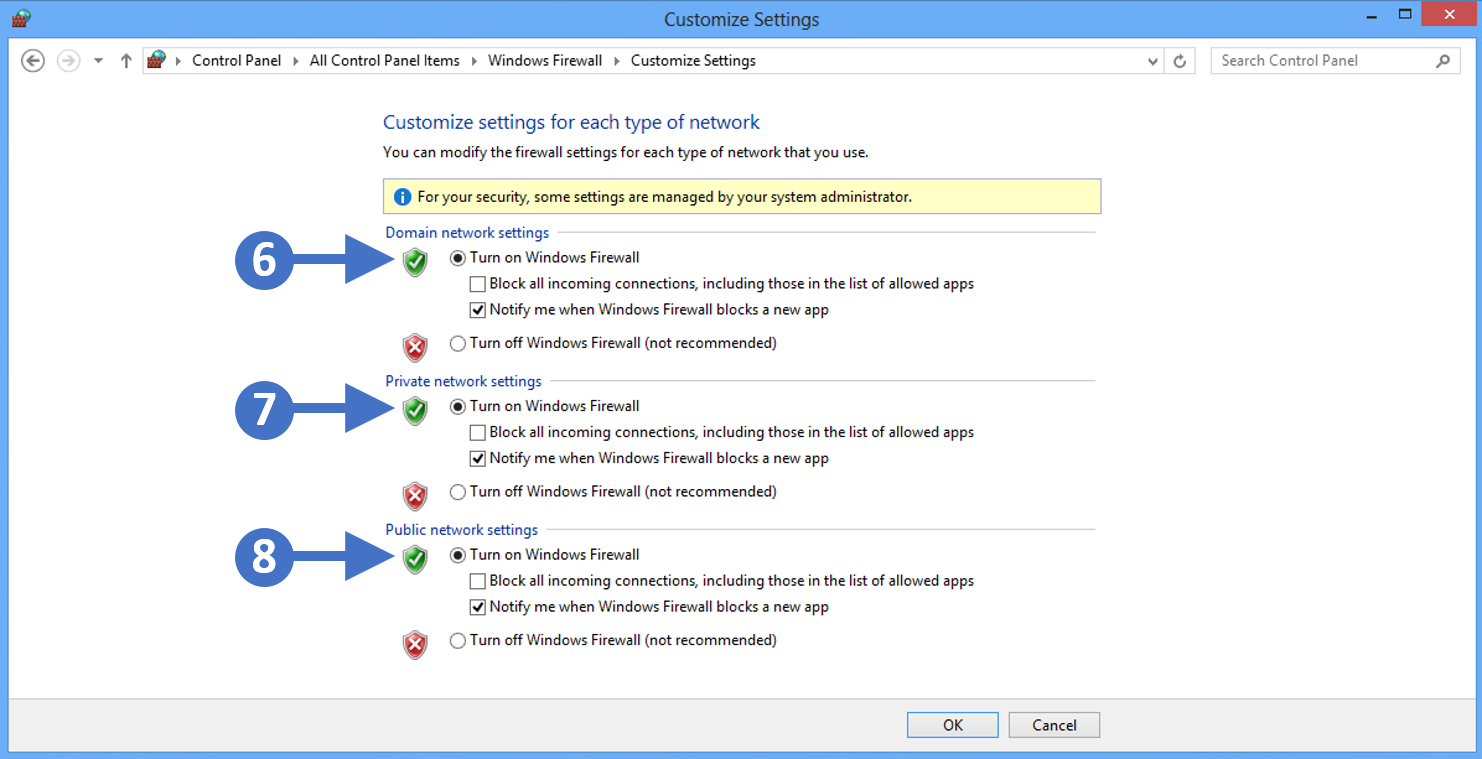


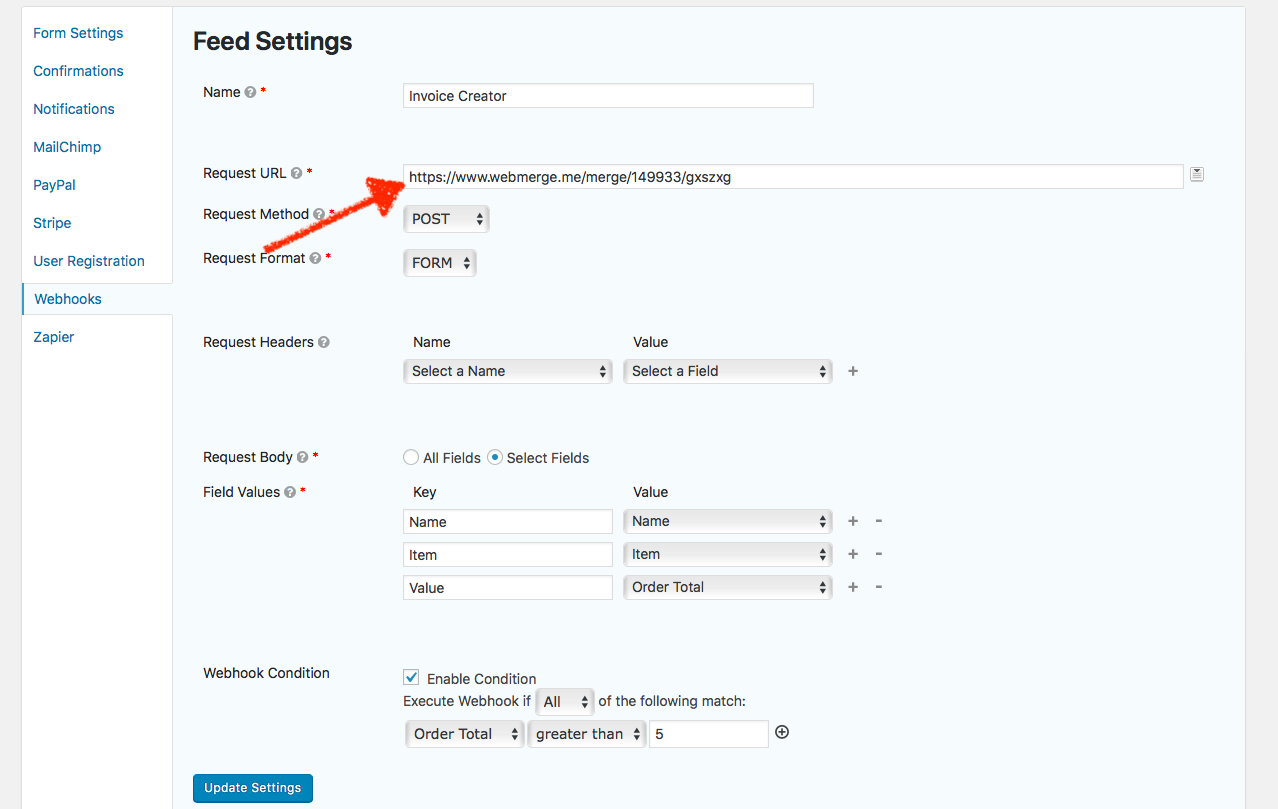
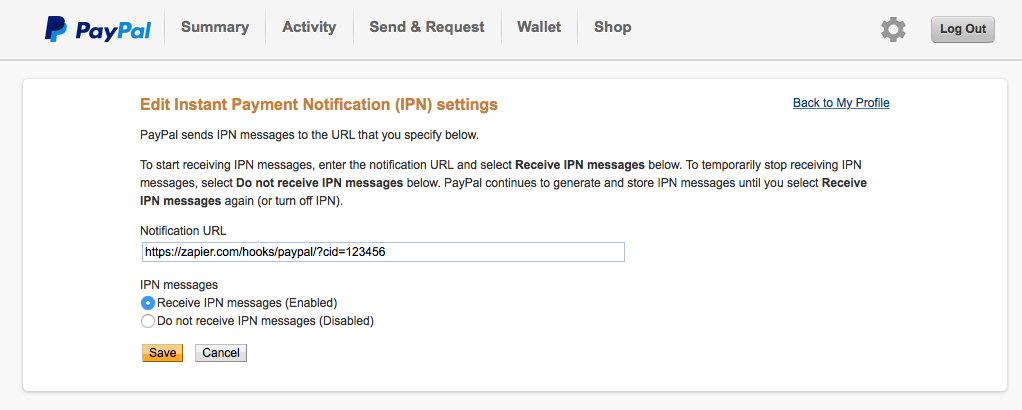
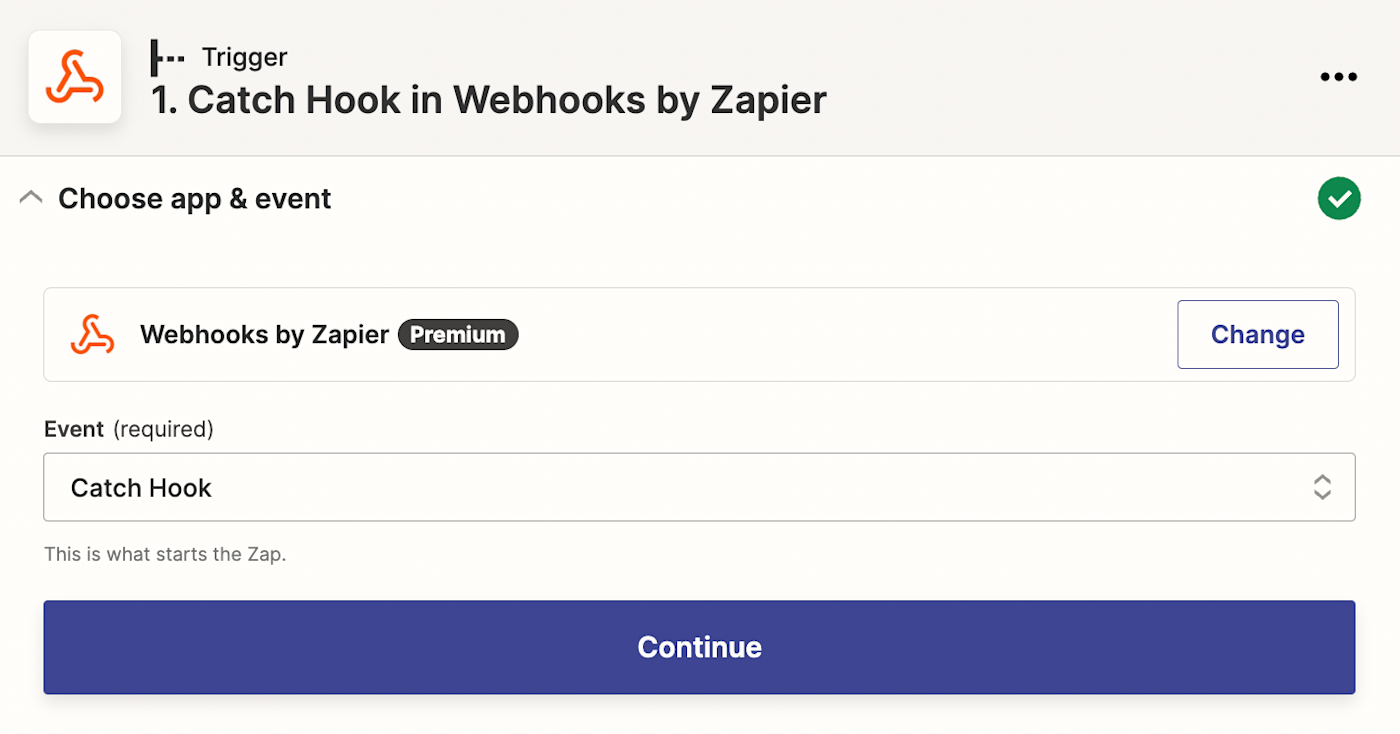
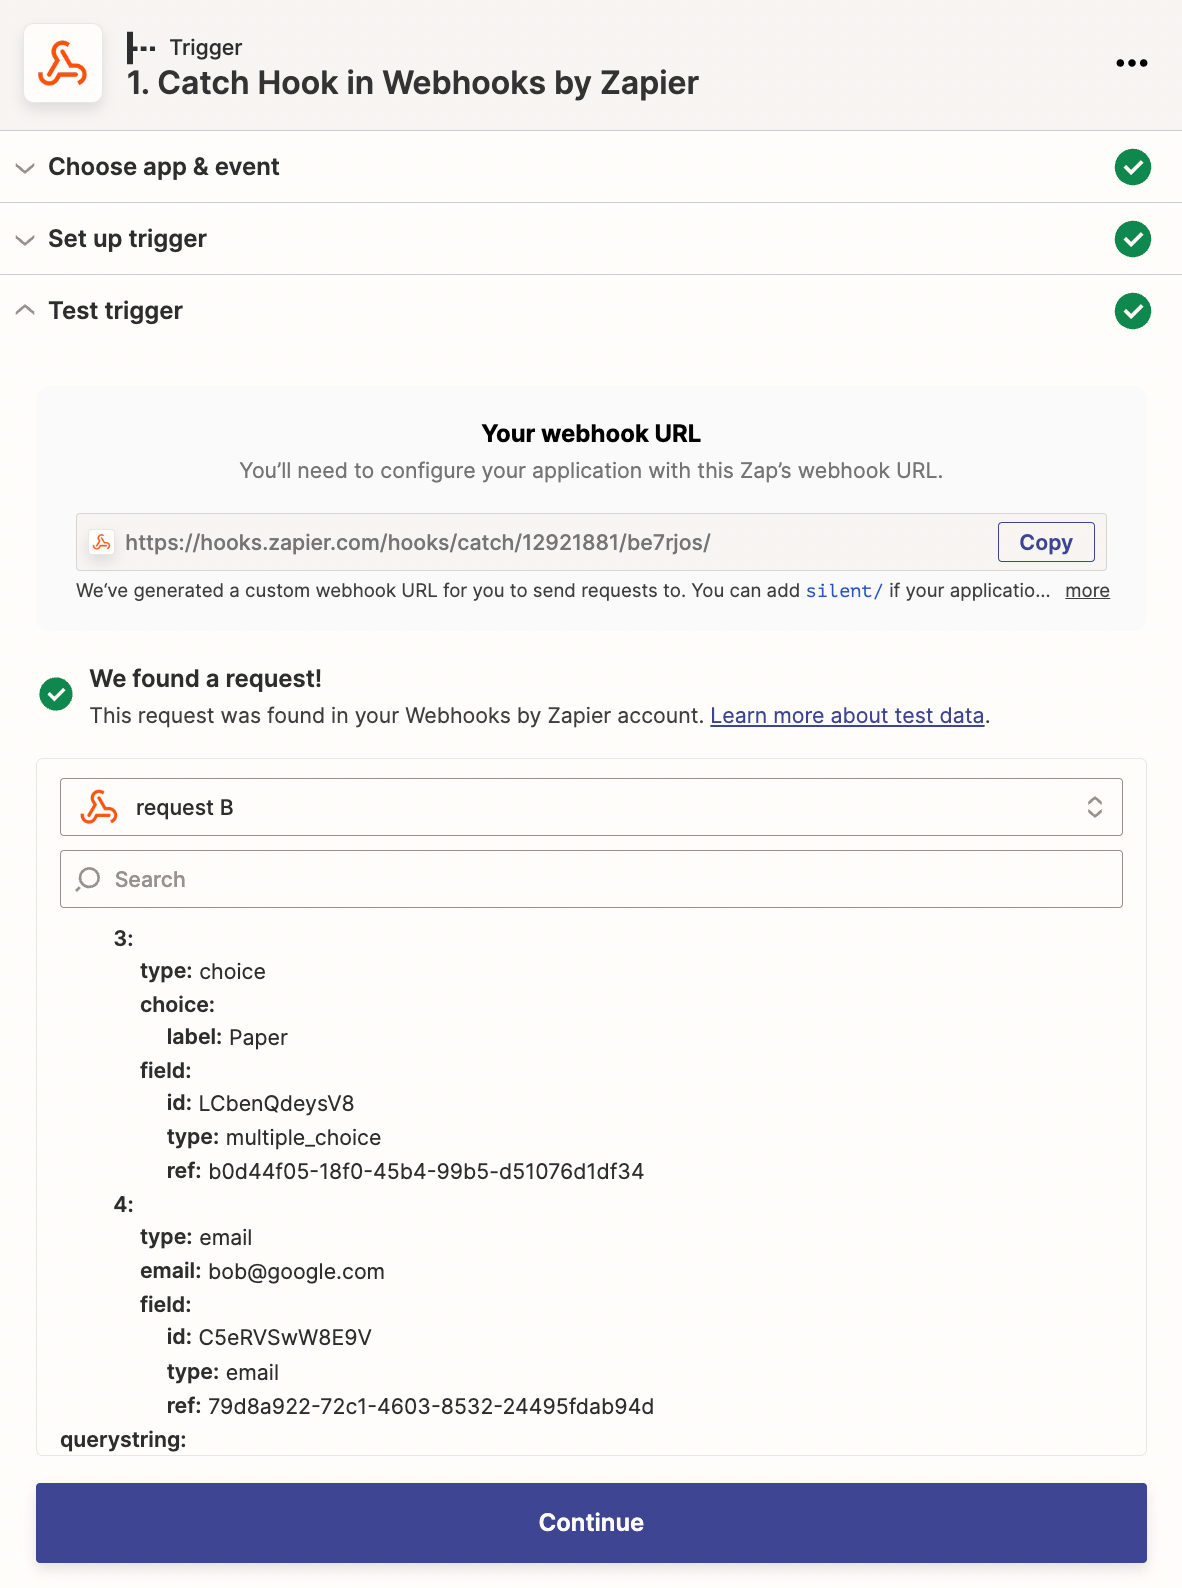

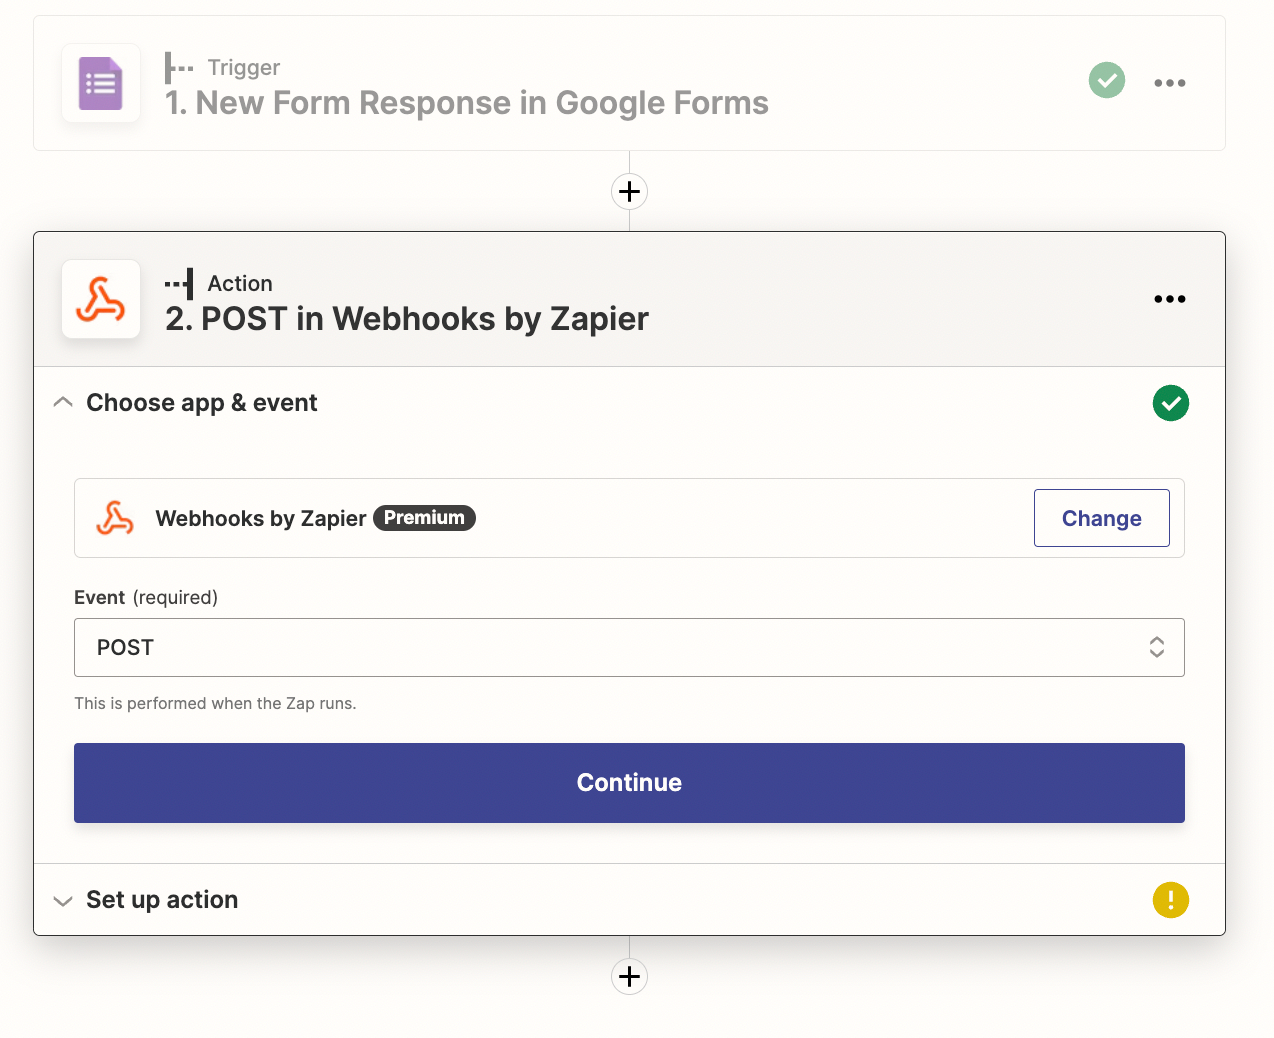
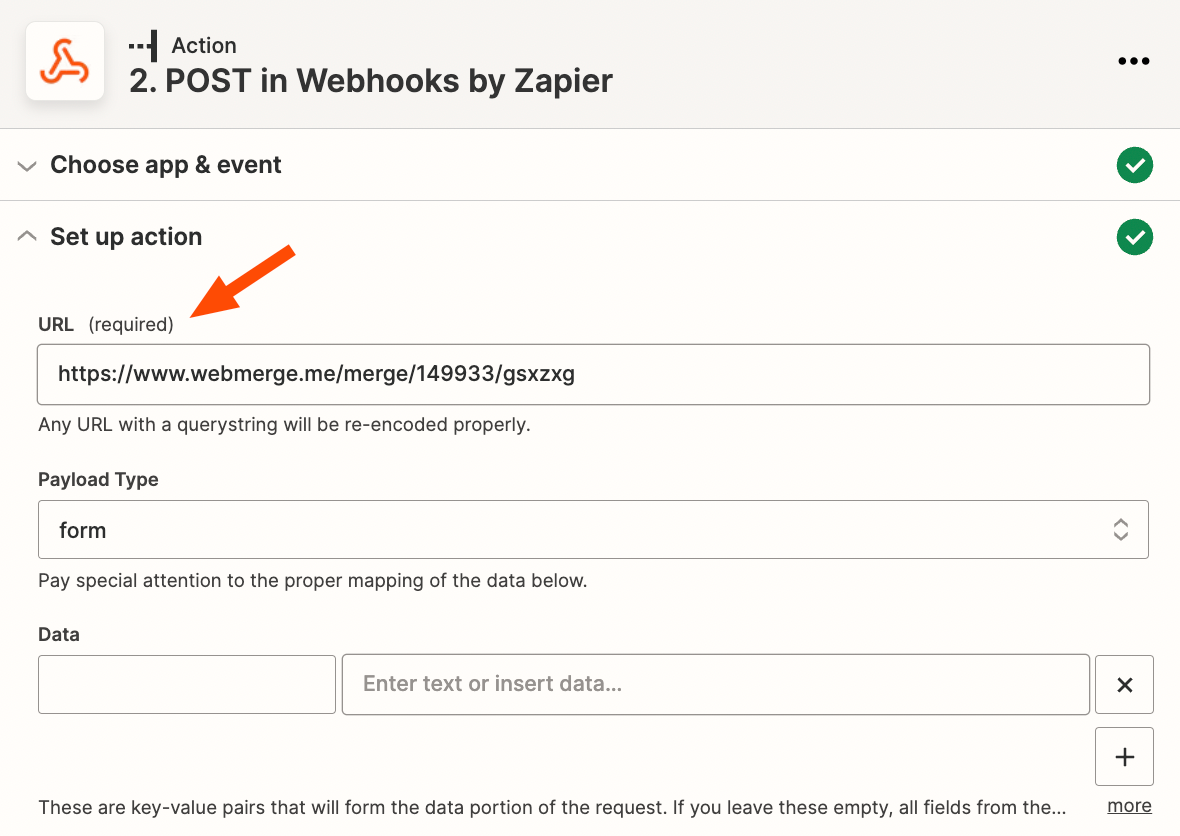

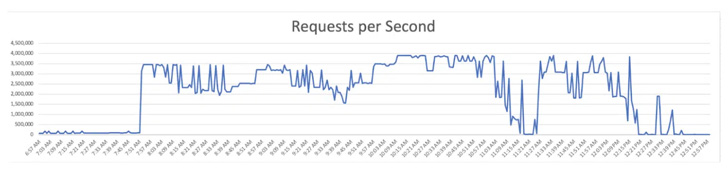
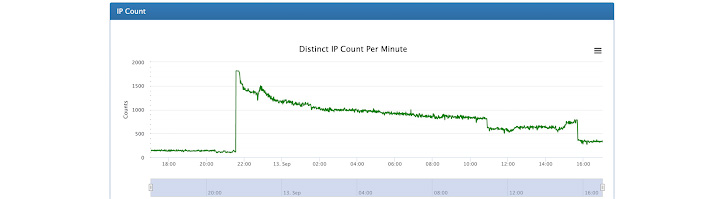