By: Jagir Shastri July 17, 2024 Read time: 5 min (1331 words)
We check the OpenSSH vulnerabilities CVE-2024–6387 and CVE-2024-6409, examining their potential real-world impact and the possibility of exploitation for CVE-2024–6387 in x64 systems.
Introduction
CVE-2024–6387, also known as “regreSSHion,” is a vulnerability that exists in OpenSSH, a widely-used suite of secure networking utilities based on the SSH protocol. This vulnerability, which was discovered in July 2024, allows for remote unauthenticated code execution, potentially providing attackers root privileges on affected systems. The Common Vulnerability Scoring System (CVSS) has rated this vulnerability with a score of 9.8
The OpenSSH vendor advisory mentions that the successful exploitation of CVE-2024-6387 has been demonstrated on 32-bit Linux and GNU C Library systems with (ASLR). It also mentions that exploitation on 64-bit systems might be possible but this has not been demonstrated at the time of publishing.
On July 8, another similar vulnerability, the signal handler race condition CVE-2024-6409 was discovered. This flaw occurs when a client fails to authenticate within the LoginGraceTime period, which is 120 seconds by default, and 600 seconds in older OpenSSH versions. Consequently, this can lead to a signal handler race condition in the cleanup_exit() function within the child process of the SSHD server.
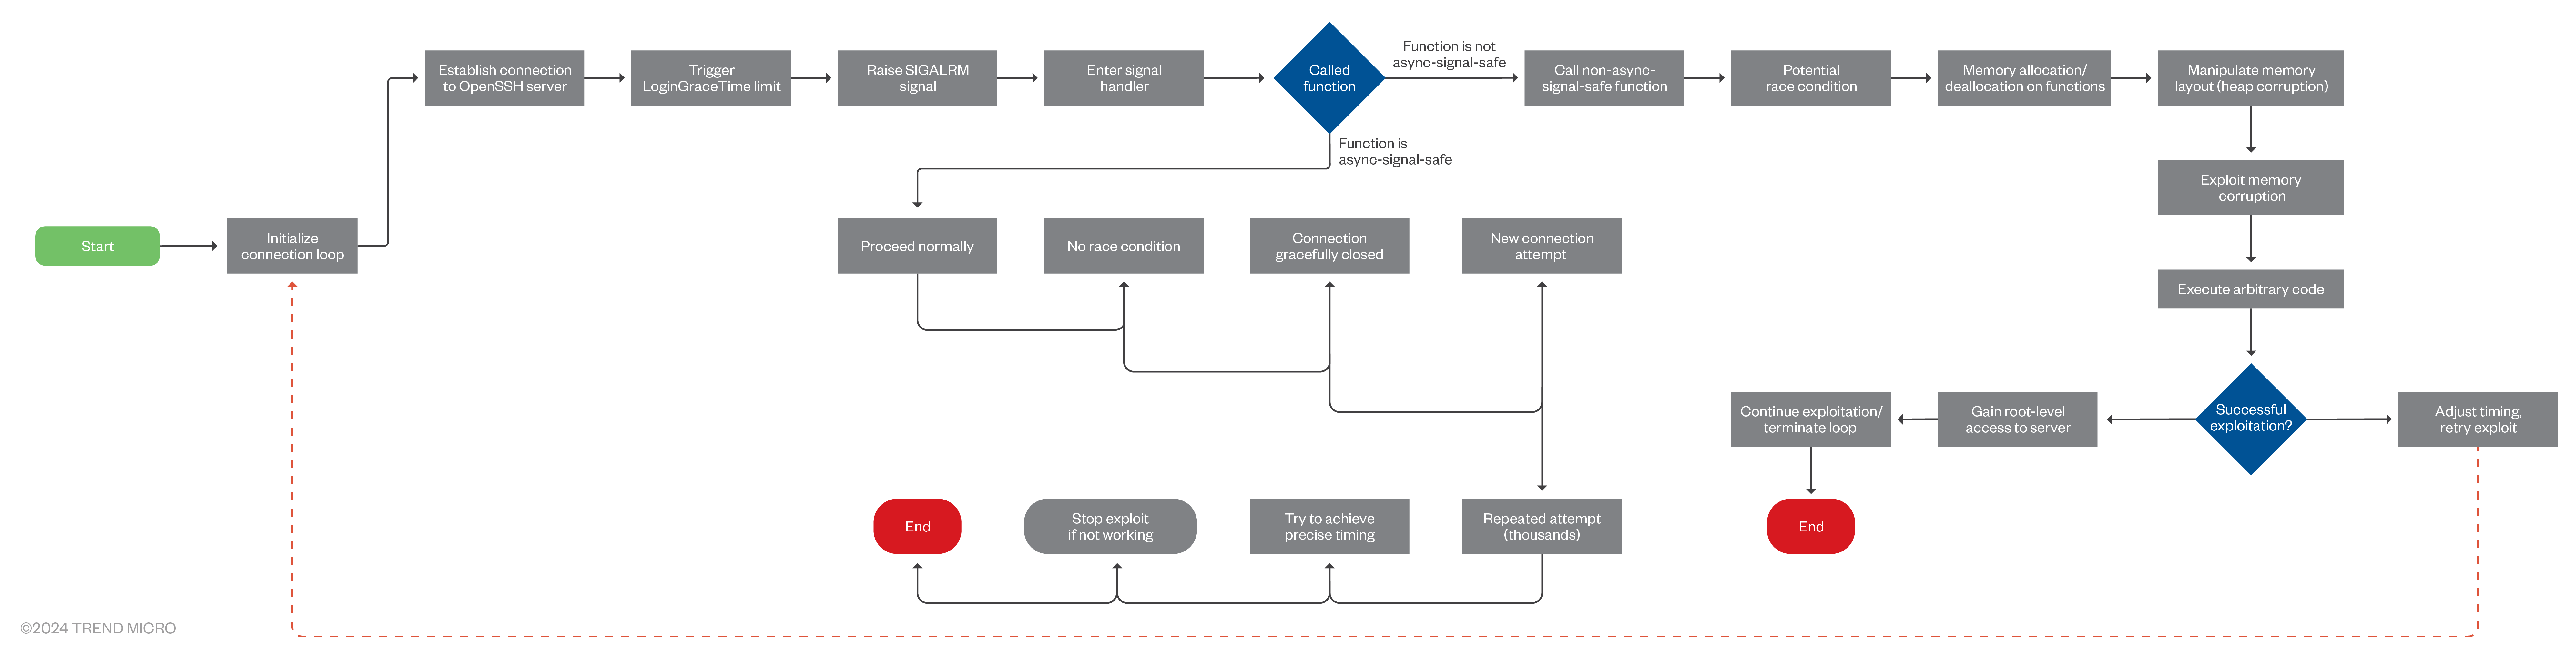
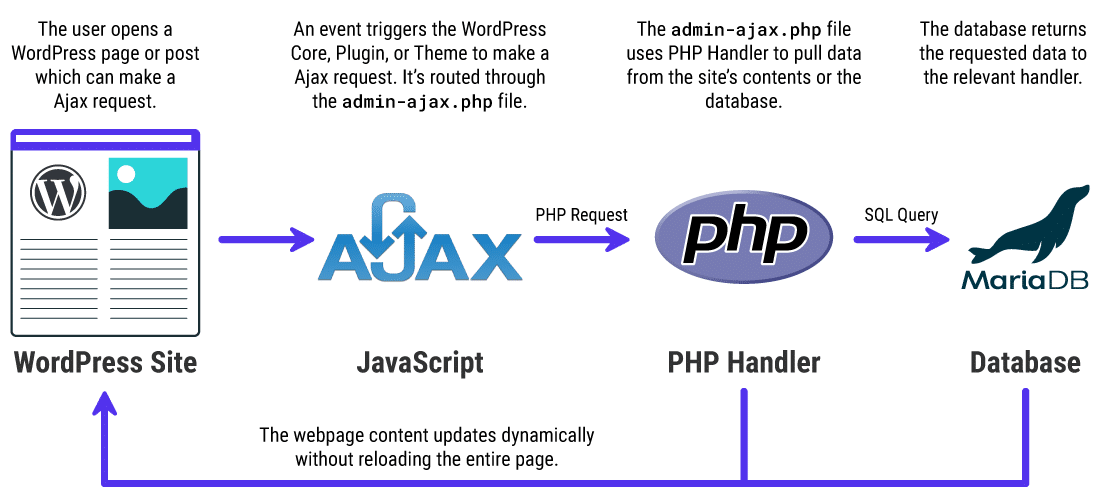
Figure 1. How the exploit works
The “regreSSHion” vulnerability arises from the unsafe handling of the SIGALRM signal during SSH authentication. When the LoginGraceTime expires, the SIGALRM signal is raised, and the corresponding handler performs certain actions, including calling non-async-signal-safe functions like syslog(). This can create a race condition, where the timing of operations could lead to memory corruption or other unexpected behaviors.
SIGALRM SIGALRM is a signal in Unix-like operating systems that indicates an alarm or timer expiration. When a process sets and a function triggers, it schedules a SIGALRM signal to be sent to the process after a specified number of seconds. This signal is commonly used for timing operations, such as implementing timeouts for network requests or scheduling periodic tasks. Processes can define custom signal handlers to respond to SIGALRM, allowing them to perform actions such as terminating processes, resetting timers, or managing execution time limits. Overall, SIGALRM facilitates time-sensitive operations within Unix processes by providing a mechanism to handle scheduled alarms and timing events.
Exploiting CVE-2024–6387 requires an attacker to initiate thousands of connection attempts to trigger the race condition accurately. The process involves repeatedly setting and resetting LoginGraceTime, causing the server to invoke the SIGALRM signal handler. This requires precise timing and proper inputs to manipulate the server’s memory layout, leading to heap corruption and code execution.
Signal handlers Signal handlers are special functions that get called in response to specific signals sent to a program. These signals can be generated, either by the operating system or by the program itself. However, not all functions are safe to call from within a signal handler since they may not be reentrant, therefore cannot safely be interrupted and called again (“async-signal-safe”). For instance, syslog() is a function used to log messages to the system logger and is not considered async-signal-safe.
Researchers have found that approximately 10,000 attempts are needed to successfully exploit this vulnerability. While the exploit could take days to complete, it is still not guaranteed that the attempt would be successful . The presence of modern security mechanisms such as Address Space Layout Randomization (ASLR) and No-eXecute (NX) bits further complicate the exploitation process but do not entirely mitigate the risk.
CVE-2024-6409 technical details
Like CVE-2024-6387, this vulnerability occurs when the SSHD’s SIGALRM handler is called asynchronously, which in turn calls various functions that are not async-signal-safe.
The race condition in grace_alarm_handler() calls cleanup_exit() from the privsep child process. However, cleanup_exit() is not designed to be called from a signal handler, potentially invoking unsafe functions. Cleanup function calls can be interrupted by signals, causing unsafe state changes and potential remote code execution (RCE).
As a privsep child process run’s with reduced privileges, there is less reason to worry about the vulnerability. In addition, working exploits for the CVE-2024-6409 have not been yet discovered, therefore proof of its actual exploitation has not been established at the time of publishing.
Exploitability of CVE-2024-6387 in x64 Systems
The OpenSSH vendor advisory mentions that the successful exploitation of CVE-2024-6387 has been demonstrated on 32-bit Linux and GNU C Library (glibc) systems with (ASLR). It also mentions that exploitation on 64-bit systems might be possible. However, certain characteristics of X64 systems make this exploitation much more difficult, which we’ll expound on in this section.
In x64 systems, ASLR plays a crucial role by randomizing memory addresses, including those of the GNU C Library (glibc), with each program execution. This randomness makes it very difficult for attackers to predict the location of the glibc base address, thus mitigating exploits that depend on precise memory targeting. The x64 architecture’s expansive address space further complicates exploitation, as attackers have to guess an exponentially greater amount of addresses. Combined with security measures such as stack canaries and NX bits, exploiting vulnerabilities such as CVE-2024-6387 becomes highly impractical on x64 systems.
While theoretically possible under specific conditions, the effective implementation of ASLR and the inherent complexities of the x64 environment significantly reduce real-world exploitability, highlighting the robust security benefits of these architectural safeguards.
Potential impact
Our As per our internal telemetry we did not notice any trend change for CVE-2024–6387, which could be considered a known exploited vulnerability (KEV)that is being exploited in wild. .
While CVE-2024–6387 presents a critical security risk, its real-world impact is mitigated by several factors. The technical complexity of the exploit and the extensive time required to execute it make large-scale attacks impractical. Each attack attempt resets the login timer, requiring precise timing and substantial effort from the attacker.
Moreover, the vulnerability affects specific versions of OpenSSH (up to 4.4p1 and 8.5p1 to 9.7p1) running on Linux systems using the GNU C Library. Systems with additional protections against brute force attacks and distributed denial-of-service (DDoS) are less likely to be successfully exploited. Therefore, while targeted attacks are possible, mass exploitation is unlikely due to the unavailability of working exploits and the time required to exploit these vulnerabilities.
Mitigation
To mitigate the risks associated with CVE-2024–6387, administrators should immediately update OpenSSH to version 9.8 or later. If immediate updating is not feasible, reducing the LoginGraceTime can provide temporary mitigation against this vulnerability.
Additionally, organizations can consider implementing the following best practices for general vulnerability exploit protection:
Patch management Regularly updating and patching software, operating systems, and applications is the most straightforward method for organizations to avoid the exploitation of vulnerabilities within their systems.
Network segmentation Separating critical network segments from the larger network can minimize the impact of a potential vulnerability exploitation.
Regular security audits Performing security audits and vulnerability assessments can identify and remediate potential weaknesses within the infrastructure before they can be exploited.
Security awareness training Educating employees about the common tactics used by attackers can help them avoid falling victim to social engineering attacks that might precede vulnerability exploitation.
Incident response plan Developing, testing, and maintaining an incident response plan can help organizations quickly and effectively respond to security breaches and vulnerability exploitations.
Additionally, employing network-based access controls, intrusion prevention systems such as Trend Vision One™, and regular vulnerability scanning can further enhance security. For Trend customers, the following IPS smart rules can detect the attack on a surface level:
1003593 Detected SSH Server Traffic (ATT&CK T1021.004)
According to other researchers, there could be non-functional exploits in circulation that claim to be working proofs-of-concept (POCs) for CVE-2024-6387. These fake exploits contain payloads that download files from remote servers and establish persistence on the systems of security researchers. Assuming they are testing a legitimate POC for the vulnerability, the security features of their systems might be disabled, making them vulnerable to malicious activities.
Overall, while CVE-2024–6387 and CVE-2024-6409 is a critical vulnerability, it does not pose a widespread threat to the internet due to its exploitation complexity and existing mitigations. However, administrators should remain vigilant, apply patches promptly, and implement recommended security practices to protect their systems.
There’s a natural human desire to avoid threatening scenarios. The irony, of course, is if you hope to attain any semblance of security, you’ve got to remain prepared to confront those very same threats.
As a decision-maker for your organization, you know this well. But no matter how many experts or trusted cybersecurity tools your organization has a standing guard, you’re only as secure as your weakest link. There’s still one group that can inadvertently open the gates to unwanted threat actors—your own people.
Security must be second nature for your first line of defense #
For your organization to thrive, you need capable employees. After all, they’re your source for great ideas, innovation, and ingenuity. However, they’re also human. And humans are fallible. Hackers understand no one is perfect, and that’s precisely what they seek to exploit.
This is why your people must become your first line of defense against cyber threats. But to do so, they need to learn how to defend themselves against the treachery of hackers. That’s where security awareness training (SAT) comes in.
The overall objective of an SAT program is to keep your employees and organization secure. The underlying benefit, however, is demonstrating compliance. While content may differ from program to program, most are generally similar, requiring your employees to watch scripted videos, study generic presentations, and take tests on cyber “hygiene.” At their core, SAT programs are designed to help you:
Educate your employees on recognizing cybersecurity risks such as phishing and ransomware
Minimize your organization’s exposure to cyber threats
Maintain regulatory compliance with cyber insurance stipulations
These are all worthwhile goals in helping your organization thrive amidst ever-evolving cyber threats. However, attaining these outcomes can feel like a pipe dream. That’s because of one unfortunate truth about most SAT programs: they don’t work.
If you oversee cybersecurity for an organization, then you’re likely familiar with the pain that comes with implementing one, managing it, and encouraging its usage. Given their complexities, traditional SAT solutions practically force non-technical employees to become full-on technologists.
Challenges for Administrators
Challenges for Employees
Challenges for Your Organization
Complex, ongoing management is frustrating. Plus, through it all they just find poor results.
They’re bored. Unengaging content is detrimental, as it doesn’t lead to knowledge retention. Boring, unengaging content doesn’t help with knowledge retention.
Most SATs aren’t effective because they’re created by generalists, not real cybersecurity experts And many are designed with little reporting capabilities, leading to limited visibility into success rates
Because most SAT programs are complex to manage, they’re usually dismissed as a means to an end. Just check a box for compliance and move on. But when done right, SAT can be a potent tool to help your employees make more intelligent, more instinctive, security-conscious decisions.
Ask the Right Questions Before Choosing Your SAT Solution#
When it comes to choosing the right solution for your organization, there are some questions you should first ask yourself. By assessing the following, you’ll be better equipped to select the option that best fits your specific needs.
Learning-Based Questions
Are the topics covered in this SAT relevant to my organization’s security and compliance concerns?
Are episodes updated regularly to reflect current threats and scenarios?
Does this SAT engage users in a unique, meaningful manner?
Is this SAT built and supported by cybersecurity practitioners?
Is the teaching methodology proven to increase knowledge retention?
Management-Based Questions
Can someone outside of my organization manage the SAT for me?
Can it be deployed quickly?
Does it automatically enroll new users and automate management?
Is it smart enough to skip non-human identities so I don’t assign training to, say, our copy machine?
Is it simple and intuitive enough for anyone across my organization to use?
Your ideal SAT will allow you to answer a resounding “Yes” to all of the above.
A SAT solution that’s easy to deploy, manage, and use can have a substantial positive impact. That’s because a solution that delivers “ease” has considered all of your organization’s cybersecurity needs in advance. In other words, an effective SAT does all the heavy lifting on your behalf, as it features:
Relevant topics …based on real threats you might encounter.
What to look for:
To avoid canned, outdated training, choose a SAT solution that’s backed by experts. Cybersecurity practitioners should be the ones regularly creating and updating episodes based on the latest trends they see hackers leveraging in the wild. Additionally, every episode should cover a unique cybersecurity topic that reflects the most recent real-world tradecraft.
Full management by real experts …so you don’t have to waste time creating, managing, and assigning training.
What to look for:
Ideally, you want a SAT solution that can manage all necessary tasks for you. Seek a SAT solution that’s backed by real cybersecurity experts who can create, curate, and deploy your learning programs and phishing scenarios on your behalf.
Memorable episodes …with fun, story-driven lessons that are relatable and easy to comprehend.
What to look for:
Strive for a SAT solution that features character-based narratives. This indicates the SAT is carefully designed to engage learners of all attention spans. Remember, if the episodes are intentionally entertaining and whimsical, you’re more likely to find your employees conversing about inside jokes, recurring characters, and, of course, what they’ve learned. As a result, these ongoing discussions only serve to fortify your culture of security.
Continual enhancements …so episodes are updated regularly in response to real-world threats.
What to look for: Seek out a SAT solution that provides monthly episodes, as this will keep your learners up to date. Regular encounters with simulated cybersecurity scenarios can help enhance their abilities to spot and defend against risks, such as phishing attempts. These simulations should also be dispersed at unpredictable time intervals (i.e. morning, night, weekends, early in the month, later in the month, etc.), keeping learners on their toes and allowing them to put their security knowledge into practice.
Minimal time commitment …so you don’t have to invest countless hours managing it all.
What to look for: For your learners, choose a SAT solution that doesn’t feel like an arduous chore. Look for solutions that specialize in engaging episodes that are designed to be completed in shorter periods of time. For your own administrative needs, select a SAT that can sync regularly with your most popular platforms, such as Microsoft 365, Google, Okta, or Slack. It should also sync your employee directories with ease, so whenever you activate or deactivate users, it’ll automatically update the information. Finally, make sure it’s intelligent enough to decipher between human and non-human identities, so you’re only charged for accounts linked to real individuals.
Real results …through episodes that instill meaningful security-focused behaviors and habits.
What to look for: An impactful SAT should deliver monthly training that’s rooted in science-backed teaching methodologies proven to help your employees internalize and retain lessons better. Your SAT should feature engaging videos, text, and short quizzes that showcase realistic cyber threats you and your employees are likely to encounter in the wild, such as:PhishingSocial engineeringPhysical device securityand more
Measurable data …with easy-to-read reports on usage and success rates.
What to look for: An impactful SAT program should provide robust reporting. Comprehensible summaries should highlight those learners who haven’t taken their training or those whom a phishing simulation has compromised. Additionally, detailed reports should give you all the data you need to help prove business, insurance, and regulatory compliance.
Easy adoption ….that makes it easy to deploy and easy to scale with your organization.
What to look for: Choose a SAT solution that’s specially built to accommodate organizations with limited time and resources. A solution that’s easy to implement can be deployed across your organization in a matter of minutes.
Compliance …with a range of standards and regulations
What to look for: While compliance is the bare minimum of what a SAT should offer your organization, it shouldn’t be understated. Whether to meet insurance check boxes or critical industry regulations, every business has its own compliance demands. At the very least, your SAT solution should cover the requirements of: Health Insurance Portability and Accountability Act (HIPAA)Payment Card Industry Data Security Standard (PCI)Service Organization Control Type 2 (SOC 2)EU General Data Protection Regulation (GDPR)
The Threat Landscape is Changing. Your SAT Should Change With It. #
Cybercriminals think they’re smart, maliciously targeting individuals across organizations like yours. That’s why you need to ensure your employees are smarter. If they’re aware of the ever-changing tactics hackers employ, they can stand as your first line of defense. But first, you need to deploy a training solution you can trust, backed by real cybersecurity experts who understand emerging real-world threats.
Minimize time-consuming maintenance and management tasks
Improve knowledge retention through neuroscience-based learning principles
Update you and your employees on the current threat landscape
Establish a culture that values cybersecurity
Inspire meaningful behavioral habits to improve security awareness
Engage you and your employees in a creative, impactful manner
Assure regulatory compliance
Keep cyber criminals out of your organization
Discover how a fully managed SAT can free up your time and resources, all while empowering your employees with smarter habits that better protect your organization from cyber threats.
Say goodbye to ineffective, outdated training. Say hello to Huntress SAT.
Found this article interesting? This article is a contributed piece from one of our valued partners. Follow us on Twitter and LinkedIn to read more exclusive content we post.
By: Shannon Murphy, Greg Young March 20, 2024 Read time: 2 min (589 words)
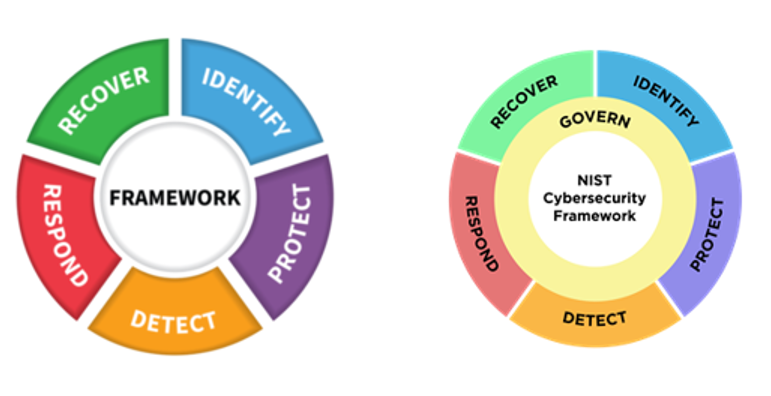
On February 26, 2024, the National Institute of Standards and Technology (NIST) released the official 2.0 version of the Cyber Security Framework (CSF).
What is the NIST CSF?
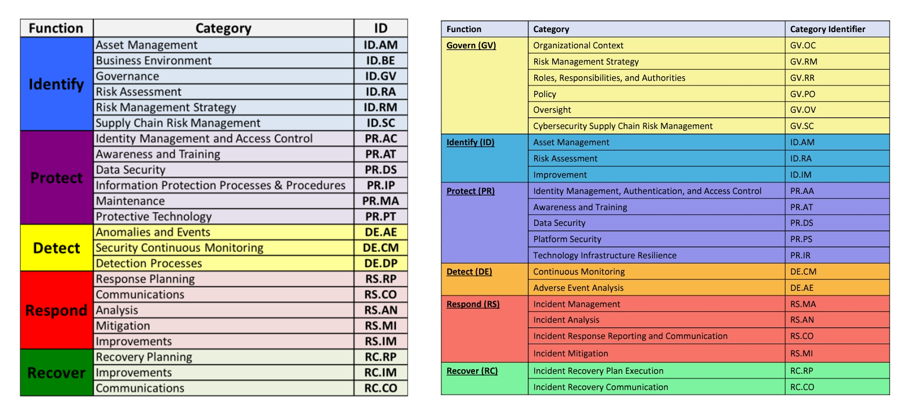
The NIST CSF is a series of guidelines and best practices to reduce cyber risk and improve security posture. The framework is divided into pillars or “functions” and each function is subdivided into “categories” which outline specific outcomes.
As titled, it is a framework. Although it was published by a standards body, it is not a technical standard.
https://www.nist.gov/cyberframework
What Is the CSF Really Used For?
Unlike some very prescriptive NIST standards (for example, crypto standards like FIPS-140-2), the CSF framework is similar to the ISO 27001 certification guidance. It aims to set out general requirements to inventory security risk, design and implement compensating controls, and adopt an overarching process to ensure continuous improvement to meet shifting security needs.
It’s a high-level map for security leaders to identify categories of protection that are not being serviced well. Think of the CSF as a series of buckets with labels. You metaphorically put all the actions, technology deployments, and processes you do in cybersecurity into these buckets, and then look for buckets with too little activity in them or have too much activity — or repetitive activity — and not enough of other requirements in them.
The CSF hierarchy is that Functions contain many Categories — or in other words, there are big buckets that contain smaller buckets.
What Is New in CSF 2.0?
The most noteworthy change is the introduction of Governance as a sixth pillar in the CSF Framework. This shift sees governance being given significantly more importance from just a mention within the previous five Categories to now being its owna separate Function.
According to NIST the Govern function refers to how an organization’s, “cybersecurity risk management strategy, expectations, and policy are established, communicated, and monitored.” This is a positive and needed evolution, as when governance is weak, it often isn’t restricted to a single function (e.g. IAM) and can be systemic.
Governance aligns to a broader paradigm shift where we see cybersecurity becoming highly relevant within the business context as an operational risk. The Govern expectation is cybersecurity is integrated into the broader enterprise risk management strategy and requires dedicated accountability and oversight.
There are some other reassignments and minor changes in the remaining five Categories. CSF version 1.0 was published in 2014, and 1.1 in 2018. A lot has changed in security since then. The 2.0 update acknowledges that a review has been conducted.
As a framework, the CISO domain has not radically changed. Yes, the technology has radically evolved, but the greatest evolution in the CISO role really has been around governance: greater interaction with C-suite and board, while some activities have been handed off to operations.
So How Will This Impact Me in the Short Term?
The update to the NIST CSF provides a fresh opportunity to security leaders to start or reopen conversations with business leaders on evolving needs.
The greatest impact will be to auditors and consultants who will need to make formatting changes to their templates and work products to align with version 2.0.
CISOs and security leaders will have to make some similar changes to how they track and report compliance.
But overall, the greatest impact (aside from some extra billable cybersecurity consulting fees) will be a boost of relevance to the CSF that could attract new adherents both through security leaders choosing to look at themselves through the CSF lens and management asking the same of CISOs.
Just in time for Data Privacy Day 2024 on January 28, the EU Commission is calling for evidence to understand how the EU’s General Data Protection Regulation (GDPR) has been functioning now that we’re nearing the 6th anniversary of the regulation coming into force.
We’re so glad they asked, because we have some thoughts. And what better way to celebrate privacy day than by discussing whether the application of the GDPR has actually done anything to improve people’s privacy?
The answer is, mostly yes, but in a couple of significant ways – no.
Overall, the GDPR is rightly seen as the global gold standard for privacy protection. It has served as a model for what data protection practices should look like globally, it enshrines data subject rights that have been copied across jurisdictions, and when it took effect, it created a standard for the kinds of privacy protections people worldwide should be able to expect and demand from the entities that handle their personal data. On balance, the GDPR has definitely moved the needle in the right direction for giving people more control over their personal data and in protecting their privacy.
In a couple of key areas, however, we believe the way the GDPR has been applied to data flowing across the Internet has done nothing for privacy and in fact may even jeopardize the protection of personal data. The first area where we see this is with respect to cross-border data transfers. Location has become a proxy for privacy in the minds of many EU data protection regulators, and we think that is the wrong result. The second area is an overly broad interpretation of what constitutes “personal data” by some regulators with respect to Internet Protocol or “IP” addresses. We contend that IP addresses should not always count as personal data, especially when the entities handling IP addresses have no ability on their own to tie those IP addresses to individuals. This is important because the ability to implement a number of industry-leading cybersecurity measures relies on the ability to do threat intelligence on Internet traffic metadata, including IP addresses.
Location should not be a proxy for privacy
Fundamentally, good data security and privacy practices should be able to protect personal data regardless of where that processing or storage occurs. Nevertheless, the GDPR is based on the idea that legal protections should attach to personal data based on the location of the data – where it is generated, processed, or stored. Articles 44 to 49 establish the conditions that must be in place in order for data to be transferred to a jurisdiction outside the EU, with the idea that even if the data is in a different location, the privacy protections established by the GDPR should follow the data. No doubt this approach was influenced by political developments around government surveillance practices, such as the revelations in 2013 of secret documents describing the relationship between the US NSA (and its Five Eyes partners) and large Internet companies, and that intelligence agencies were scooping up data from choke points on the Internet. And once the GDPR took effect, many data regulators in the EU were of the view that as a result of the GDPR’s restrictions on cross-border data transfers, European personal data simply could not be processed in the United States in a way that would be consistent with the GDPR.
This issue came to a head in July 2020, when the European Court of Justice (CJEU), in its “Schrems II” decision1, invalidated the EU-US Privacy Shield adequacy standard and questioned the suitability of the EU standard contractual clauses (a mechanism entities can use to ensure that GDPR protections are applied to EU personal data even if it is processed outside the EU). The ruling in some respects left data protection regulators with little room to maneuver on questions of transatlantic data flows. But while some regulators were able to view the Schrems II ruling in a way that would still allow for EU personal data to be processed in the United States, other data protection regulators saw the decision as an opportunity to double down on their view that EU personal data cannot be processed in the US consistent with the GDPR, therefore promoting the misconception that data localization should be a proxy for data protection.
In fact, we would argue that the opposite is the case. From our own experience and according to recent research2, we know that data localization threatens an organization’s ability to achieve integrated management of cybersecurity risk and limits an entity’s ability to employ state-of-the-art cybersecurity measures that rely on cross-border data transfers to make them as effective as possible. For example, Cloudflare’s Bot Management product only increases in accuracy with continued use on the global network: it detects and blocks traffic coming from likely bots before feeding back learnings to the models backing the product. A diversity of signal and scale of data on a global platform is critical to help us continue to evolve our bot detection tools. If the Internet were fragmented – preventing data from one jurisdiction being used in another – more and more signals would be missed. We wouldn’t be able to apply learnings from bot trends in Asia to bot mitigation efforts in Europe, for example. And if the ability to identify bot traffic is hampered, so is the ability to block those harmful bots from services that process personal data.
The need for industry-leading cybersecurity measures is self-evident, and it is not as if data protection authorities don’t realize this. If you look at any enforcement action brought against an entity that suffered a data breach, you see data protection regulators insisting that the impacted entities implement ever more robust cybersecurity measures in line with the obligation GDPR Article 32 places on data controllers and processors to “develop appropriate technical and organizational measures to ensure a level of security appropriate to the risk”, “taking into account the state of the art”. In addition, data localization undermines information sharing within industry and with government agencies for cybersecurity purposes, which is generally recognized as vital to effective cybersecurity.
In this way, while the GDPR itself lays out a solid framework for securing personal data to ensure its privacy, the application of the GDPR’s cross-border data transfer provisions has twisted and contorted the purpose of the GDPR. It’s a classic example of not being able to see the forest for the trees. If the GDPR is applied in such a way as to elevate the priority of data localization over the priority of keeping data private and secure, then the protection of ordinary people’s data suffers.
Applying data transfer rules to IP addresses could lead to balkanization of the Internet
The other key way in which the application of the GDPR has been detrimental to the actual privacy of personal data is related to the way the term “personal data” has been defined in the Internet context – specifically with respect to Internet Protocol or “IP” addresses. A world where IP addresses are always treated as personal data and therefore subject to the GDPR’s data transfer rules is a world that could come perilously close to requiring a walled-off European Internet. And as noted above, this could have serious consequences for data privacy, not to mention that it likely would cut the EU off from any number of global marketplaces, information exchanges, and social media platforms.
This is a bit of a complicated argument, so let’s break it down. As most of us know, IP addresses are the addressing system for the Internet. When you send a request to a website, send an email, or communicate online in any way, IP addresses connect your request to the destination you’re trying to access. These IP addresses are the key to making sure Internet traffic gets delivered to where it needs to go. As the Internet is a global network, this means it’s entirely possible that Internet traffic – which necessarily contains IP addresses – will cross national borders. Indeed, the destination you are trying to access may well be located in a different jurisdiction altogether. That’s just the way the global Internet works. So far, so good.
But if IP addresses are considered personal data, then they are subject to data transfer restrictions under the GDPR. And with the way those provisions have been applied in recent years, some data regulators were getting perilously close to saying that IP addresses cannot transit jurisdictional boundaries if it meant the data might go to the US. The EU’s recent approval of the EU-US Data Privacy Framework established adequacy for US entities that certify to the framework, so these cross-border data transfers are not currently an issue. But if the Data Privacy Framework were to be invalidated as the EU-US Privacy Shield was in the Schrems II decision, then we could find ourselves in a place where the GDPR is applied to mean that IP addresses ostensibly linked to EU residents can’t be processed in the US, or potentially not even leave the EU.
If this were the case, then providers would have to start developing Europe-only networks to ensure IP addresses never cross jurisdictional boundaries. But how would people in the EU and US communicate if EU IP addresses can’t go to the US? Would EU citizens be restricted from accessing content stored in the US? It’s an application of the GDPR that would lead to the absurd result – one surely not intended by its drafters. And yet, in light of the Schrems II case and the way the GDPR has been applied, here we are.
A possible solution would be to consider that IP addresses are not always “personal data” subject to the GDPR. In 2016 – even before the GDPR took effect – the Court of Justice of the European Union (CJEU) established the view in Breyer v. Bundesrepublik Deutschland that even dynamic IP addresses, which change with every new connection to the Internet, constituted personal data if an entity processing the IP address could link the IP addresses to an individual. While the court’s decision did not say that dynamic IP addresses are always personal data under European data protection law, that’s exactly what EU data regulators took from the decision, without considering whether an entity actually has a way to tie the IP address to a real person3.
The question of when an identifier qualifies as “personal data” is again before the CJEU: In April 2023, the lower EU General Court ruled in SRB v EDPS4 that transmitted data can be considered anonymised and therefore not personal data if the data recipient does not have any additional information reasonably likely to allow it to re-identify the data subjects and has no legal means available to access such information. The appellant – the European Data Protection Supervisor (EDPS) – disagrees. The EDPS, who mainly oversees the privacy compliance of EU institutions and bodies, is appealing the decision and arguing that a unique identifier should qualify as personal data if that identifier could ever be linked to an individual, regardless of whether the entity holding the identifier actually had the means to make such a link.
If the lower court’s common-sense ruling holds, one could argue that IP addresses are not personal data when those IP addresses are processed by entities like Cloudflare, which have no means of connecting an IP address to an individual. If IP addresses are then not always personal data, then IP addresses will not always be subject to the GDPR’s rules on cross-border data transfers.
Although it may seem counterintuitive, having a standard whereby an IP address is not necessarily “personal data” would actually be a positive development for privacy. If IP addresses can flow freely across the Internet, then entities in the EU can use non-EU cybersecurity providers to help them secure their personal data. Advanced Machine Learning/predictive AI techniques that look at IP addresses to protect against DDoS attacks, prevent bots, or otherwise guard against personal data breaches will be able to draw on attack patterns and threat intelligence from around the world to the benefit of EU entities and residents. But none of these benefits can be realized in a world where IP addresses are always personal data under the GDPR and where the GDPR’s data transfer rules are interpreted to mean IP addresses linked to EU residents can never flow to the United States.
Keeping privacy in focus
On this Data Privacy Day, we urge EU policy makers to look closely at how the GDPR is working in practice, and to take note of the instances where the GDPR is applied in ways that place privacy protections above all other considerations – even appropriate security measures mandated by the GDPR’s Article 32 that take into account the state of the art of technology. When this happens, it can actually be detrimental to privacy. If taken to the extreme, this formulaic approach would not only negatively impact cybersecurity and data protection, but even put into question the functioning of the global Internet infrastructure as a whole, which depends on cross-border data flows. So what can be done to avert this?
First, we believe EU policymakers could adopt guidelines (if not legal clarification) for regulators that IP addresses should not be considered personal data when they cannot be linked by an entity to a real person. Second, policymakers should clarify that the GDPR’s application should be considered with the cybersecurity benefits of data processing in mind. Building on the GDPR’s existing recital 49, which rightly recognizes cybersecurity as a legitimate interest for processing, personal data that needs to be processed outside the EU for cybersecurity purposes should be exempted from GDPR restrictions to international data transfers. This would avoid some of the worst effects of the mindset that currently views data localization as a proxy for data privacy. Such a shift would be a truly pro-privacy application of the GDPR.
Visit 1.1.1.1 from any device to get started with our free app that makes your Internet faster and safer.
To learn more about our mission to help build a better Internet, start here. If you’re looking for a new career direction, check out our open positions.
01/02/2024 Matthew Prince John Graham-Cumming Grant Bourzikas
11 min read
On Thanksgiving Day, November 23, 2023, Cloudflare detected a threat actor on our self-hosted Atlassian server. Our security team immediately began an investigation, cut off the threat actor’s access, and on Sunday, November 26, we brought in CrowdStrike’s Forensic team to perform their own independent analysis.
Yesterday, CrowdStrike completed its investigation, and we are publishing this blog post to talk about the details of this security incident.
We want to emphasize to our customers that no Cloudflare customer data or systems were impacted by this event. Because of our access controls, firewall rules, and use of hard security keys enforced using our own Zero Trust tools, the threat actor’s ability to move laterally was limited. No services were implicated, and no changes were made to our global network systems or configuration. This is the promise of a Zero Trust architecture: it’s like bulkheads in a ship where a compromise in one system is limited from compromising the whole organization.
From November 14 to 17, a threat actor did reconnaissance and then accessed our internal wiki (which uses Atlassian Confluence) and our bug database (Atlassian Jira). On November 20 and 21, we saw additional access indicating they may have come back to test access to ensure they had connectivity.
They then returned on November 22 and established persistent access to our Atlassian server using ScriptRunner for Jira, gained access to our source code management system (which uses Atlassian Bitbucket), and tried, unsuccessfully, to access a console server that had access to the data center that Cloudflare had not yet put into production in São Paulo, Brazil.
They did this by using one access token and three service account credentials that had been taken, and that we failed to rotate, after the Okta compromise of October 2023. All threat actor access and connections were terminated on November 24 and CrowdStrike has confirmed that the last evidence of threat activity was on November 24 at 10:44.
(Throughout this blog post all dates and times are UTC.)
Even though we understand the operational impact of the incident to be extremely limited, we took this incident very seriously because a threat actor had used stolen credentials to get access to our Atlassian server and accessed some documentation and a limited amount of source code. Based on our collaboration with colleagues in the industry and government, we believe that this attack was performed by a nation state attacker with the goal of obtaining persistent and widespread access to Cloudflare’s global network.
“Code Red” Remediation and Hardening Effort
On November 24, after the threat actor was removed from our environment, our security team pulled in all the people they needed across the company to investigate the intrusion and ensure that the threat actor had been completely denied access to our systems, and to ensure we understood the full extent of what they accessed or tried to access.
Then, from November 27, we redirected the efforts of a large part of the Cloudflare technical staff (inside and outside the security team) to work on a single project dubbed “Code Red”. The focus was strengthening, validating, and remediating any control in our environment to ensure we are secure against future intrusion and to validate that the threat actor could not gain access to our environment. Additionally, we continued to investigate every system, account and log to make sure the threat actor did not have persistent access and that we fully understood what systems they had touched and which they had attempted to access.
CrowdStrike performed an independent assessment of the scope and extent of the threat actor’s activity, including a search for any evidence that they still persisted in our systems. CrowdStrike’s investigation provided helpful corroboration and support for our investigation, but did not bring to light any activities that we had missed. This blog post outlines in detail everything we and CrowdStrike uncovered about the activity of the threat actor.
The only production systems the threat actor could access using the stolen credentials was our Atlassian environment. Analyzing the wiki pages they accessed, bug database issues, and source code repositories, it appears they were looking for information about the architecture, security, and management of our global network; no doubt with an eye on gaining a deeper foothold. Because of that, we decided a huge effort was needed to further harden our security protocols to prevent the threat actor from being able to get that foothold had we overlooked something from our log files.
Our aim was to prevent the attacker from using the technical information about the operations of our network as a way to get back in. Even though we believed, and later confirmed, the attacker had limited access, we undertook a comprehensive effort to rotate every production credential (more than 5,000 individual credentials), physically segment test and staging systems, performed forensic triages on 4,893 systems, reimaged and rebooted every machine in our global network including all the systems the threat actor accessed and all Atlassian products (Jira, Confluence, and Bitbucket).
The threat actor also attempted to access a console server in our new, and not yet in production, data center in São Paulo. All attempts to gain access were unsuccessful. To ensure these systems are 100% secure, equipment in the Brazil data center was returned to the manufacturers. The manufacturers’ forensic teams examined all of our systems to ensure that no access or persistence was gained. Nothing was found, but we replaced the hardware anyway.
We also looked for software packages that hadn’t been updated, user accounts that might have been created, and unused active employee accounts; we went searching for secrets that might have been left in Jira tickets or source code, examined and deleted all HAR files uploaded to the wiki in case they contained tokens of any sort. Whenever in doubt, we assumed the worst and made changes to ensure anything the threat actor was able to access would no longer be in use and therefore no longer be valuable to them.
Every member of the team was encouraged to point out areas the threat actor might have touched, so we could examine log files and determine the extent of the threat actor’s access. By including such a large number of people across the company, we aimed to leave no stone unturned looking for evidence of access or changes that needed to be made to improve security.
The immediate “Code Red” effort ended on January 5, but work continues across the company around credential management, software hardening, vulnerability management, additional alerting, and more.
Attack timeline
The attack started in October with the compromise of Okta, but the threat actor only began targeting our systems using those credentials from the Okta compromise in mid-November.
The following timeline shows the major events:
October 18 – Okta compromise
We’ve written about this before but, in summary, we were (for the second time) the victim of a compromise of Okta’s systems which resulted in a threat actor gaining access to a set of credentials. These credentials were meant to all be rotated.
Unfortunately, we failed to rotate one service token and three service accounts (out of thousands) of credentials that were leaked during the Okta compromise.
One was a Moveworks service token that granted remote access into our Atlassian system. The second credential was a service account used by the SaaS-based Smartsheet application that had administrative access to our Atlassian Jira instance, the third account was a Bitbucket service account which was used to access our source code management system, and the fourth was an AWS environment that had no access to the global network and no customer or sensitive data.
The one service token and three accounts were not rotated because mistakenly it was believed they were unused. This was incorrect and was how the threat actor first got into our systems and gained persistence to our Atlassian products. Note that this was in no way an error on the part of Atlassian, AWS, Moveworks or Smartsheet. These were merely credentials which we failed to rotate.
November 14 09:22:49 – threat actor starts probing
Our logs show that the threat actor started probing and performing reconnaissance of our systems beginning on November 14, looking for a way to use the credentials and what systems were accessible. They attempted to log into our Okta instance and were denied access. They attempted access to the Cloudflare Dashboard and were denied access.
Additionally, the threat actor accessed an AWS environment that is used to power the Cloudflare Apps marketplace. This environment was segmented with no access to global network or customer data. The service account to access this environment was revoked, and we validated the integrity of the environment.
November 15 16:28:38 – threat actor gains access to Atlassian services
The threat actor successfully accessed Atlassian Jira and Confluence on November 15 using the Moveworks service token to authenticate through our gateway, and then they used the Smartsheet service account to gain access to the Atlassian suite. The next day they began looking for information about the configuration and management of our global network, and accessed various Jira tickets.
The threat actor searched the wiki for things like remote access, secret, client-secret, openconnect, cloudflared, and token. They accessed 36 Jira tickets (out of a total of 2,059,357 tickets) and 202 wiki pages (out of a total of 194,100 pages).
The threat actor accessed Jira tickets about vulnerability management, secret rotation, MFA bypass, network access, and even our response to the Okta incident itself.
The wiki searches and pages accessed suggest the threat actor was very interested in all aspects of access to our systems: password resets, remote access, configuration, our use of Salt, but they did not target customer data or customer configurations.
November 16 14:36:37 – threat actor creates an Atlassian user account
The threat actor used the Smartsheet credential to create an Atlassian account that looked like a normal Cloudflare user. They added this user to a number of groups within Atlassian so that they’d have persistent access to the Atlassian environment should the Smartsheet service account be removed.
November 17 14:33:52 to November 20 09:26:53 – threat actor takes a break from accessing Cloudflare systems
During this period, the attacker took a break from accessing our systems (apart from apparently briefly testing that they still had access) and returned just before Thanksgiving.
November 22 14:18:22 – threat actor gains persistence
Since the Smartsheet service account had administrative access to Atlassian Jira, the threat actor was able to install the Sliver Adversary Emulation Framework, which is a widely used tool and framework that red teams and attackers use to enable “C2” (command and control), connectivity gaining persistent and stealthy access to a computer on which it is installed. Sliver was installed using the ScriptRunner for Jira plugin.
This allowed them continuous access to the Atlassian server, and they used this to attempt lateral movement. With this access the Threat Actor attempted to gain access to a non-production console server in our São Paulo, Brazil data center due to a non-enforced ACL. The access was denied, and they were not able to access any of the global network.
Over the next day, the threat actor viewed 120 code repositories (out of a total of 11,904 repositories). Of the 120, the threat actor used the Atlassian Bitbucket git archive feature on 76 repositories to download them to the Atlassian server, and even though we were not able to confirm whether or not they had been exfiltrated, we decided to treat them as having been exfiltrated.
The 76 source code repositories were almost all related to how backups work, how the global network is configured and managed, how identity works at Cloudflare, remote access, and our use of Terraform and Kubernetes. A small number of the repositories contained encrypted secrets which were rotated immediately even though they were strongly encrypted themselves.
We focused particularly on these 76 source code repositories to look for embedded secrets, (secrets stored in the code were rotated), vulnerabilities and ways in which an attacker could use them to mount a subsequent attack. This work was done as a priority by engineering teams across the company as part of “Code Red”.
As a SaaS company, we’ve long believed that our source code itself is not as precious as the source code of software companies that distribute software to end users. In fact, we’ve open sourced a large amount of our source code and speak openly through our blog about algorithms and techniques we use. So our focus was not on someone having access to the source code, but whether that source code contained embedded secrets (such as a key or token) and vulnerabilities.
November 23 – Discovery and threat actor access termination begins
Our security team was alerted to the threat actor’s presence at 16:00 and deactivated the Smartsheet service account 35 minutes later. 48 minutes later the user account created by the threat actor was found and deactivated. Here’s the detailed timeline for the major actions taken to block the threat actor once the first alert was raised.
15:58 – The threat actor adds the Smartsheet service account to an administrator group. 16:00 – Automated alert about the change at 15:58 to our security team. 16:12 – Cloudflare SOC starts investigating the alert. 16:35 – Smartsheet service account deactivated by Cloudflare SOC. 17:23 – The threat actor-created Atlassian user account is found and deactivated. 17:43 – Internal Cloudflare incident declared. 21:31 – Firewall rules put in place to block the threat actor’s known IP addresses.
November 24 – Sliver removed; all threat actor access terminated
10:44 – Last known threat actor activity. 11:59 – Sliver removed.
Throughout this timeline, the threat actor tried to access a myriad of other systems at Cloudflare but failed because of our access controls, firewall rules, and use of hard security keys enforced using our own Zero Trust tools.
To be clear, we saw no evidence whatsoever that the threat actor got access to our global network, data centers, SSL keys, customer databases or configuration information, Cloudflare Workers deployed by us or customers, AI models, network infrastructure, or any of our datastores like Workers KV, R2 or Quicksilver. Their access was limited to the Atlassian suite and the server on which our Atlassian runs.
A large part of our “Code Red” effort was understanding what the threat actor got access to and what they tried to access. By looking at logging across systems we were able to track attempted access to our internal metrics, network configuration, build system, alerting systems, and release management system. Based on our review, none of their attempts to access these systems were successful. Independently, CrowdStrike performed an assessment of the scope and extent of the threat actor’s activity, which did not bring to light activities that we had missed and concluded that the last evidence of threat activity was on November 24 at 10:44.
We are confident that between our investigation and CrowdStrike’s, we fully understand the threat actor’s actions and that they were limited to the systems on which we saw their activity.
Conclusion
This was a security incident involving a sophisticated actor, likely a nation-state, who operated in a thoughtful and methodical manner. The efforts we have taken ensure that the ongoing impact of the incident was limited and that we are well-prepared to fend off any sophisticated attacks in the future. This required the efforts of a significant number of Cloudflare’s engineering staff, and, for over a month, this was the highest priority at Cloudflare. The entire Cloudflare team worked to ensure that our systems were secure, the threat actor’s access was understood, to remediate immediate priorities (such as mass credential rotation), and to build a plan of long-running work to improve our overall security based on areas for improvement discovered during this process.
We are incredibly grateful to everyone at Cloudflare who responded quickly over the Thanksgiving holiday to conduct an initial analysis and lock out the threat actor, and all those who contributed to this effort. It would be impossible to name everyone involved, but their long hours and dedicated work made it possible to undertake an essential review and change of Cloudflare’s security while keeping our global network running and our customers’ service running.
We are grateful to CrowdStrike for having been available immediately to conduct an independent assessment. Now that their final report is complete, we are confident in our internal analysis and remediation of the intrusion and are making this blog post available.
IOCs Below are the Indications of Compromise (IOCs) that we saw from this threat actor. We are publishing them so that other organizations, and especially those that may have been impacted by the Okta breach, can search their logs to confirm the same threat actor did not access their systems.
Indicator
Indicator Type
SHA256
Description
193.142.58[.]126
IPv4
N/A
Primary threat actor Infrastructure, owned by M247 Europe SRL (Bucharest, Romania)
198.244.174[.]214
IPv4
N/A
Sliver C2 server, owned by OVH SAS (London, England)
Visit 1.1.1.1 from any device to get started with our free app that makes your Internet faster and safer.
To learn more about our mission to help build a better Internet, start here. If you’re looking for a new career direction, check out our open positions.
I do get the question of whether the WiFi 6 routers have better range from time to time and my answer is that some do have a better range than the WiFi 5 router, while some don’t. It’s only normal that an expensive new piece of technology will behave better than an old, battle-scarred router. But, in general, are the WiFi 6 routers able to cover more space than the devices from the older WiFi generation?
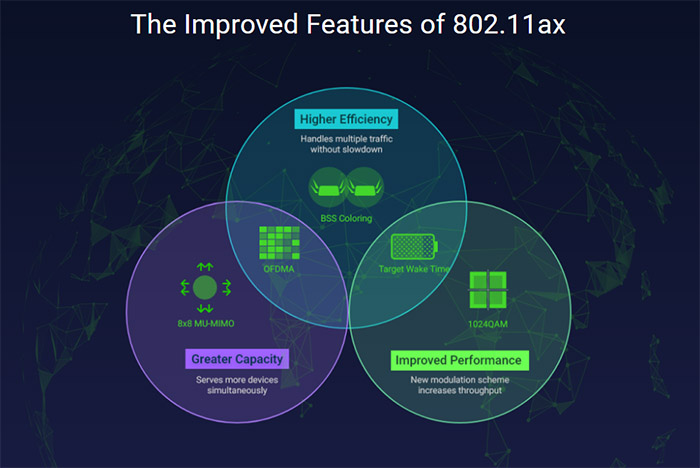
Especially since we are promised that the OFDMA will just make everything way better, so just go and buy the new stuff, throw away the old! The idea behind the WiFi 6 standard (IEEE 802.11ax) was not really about speed or increased coverage, it was about handling a denser network, with a lot of very diverse client devices in an environment prone to lots of interference.
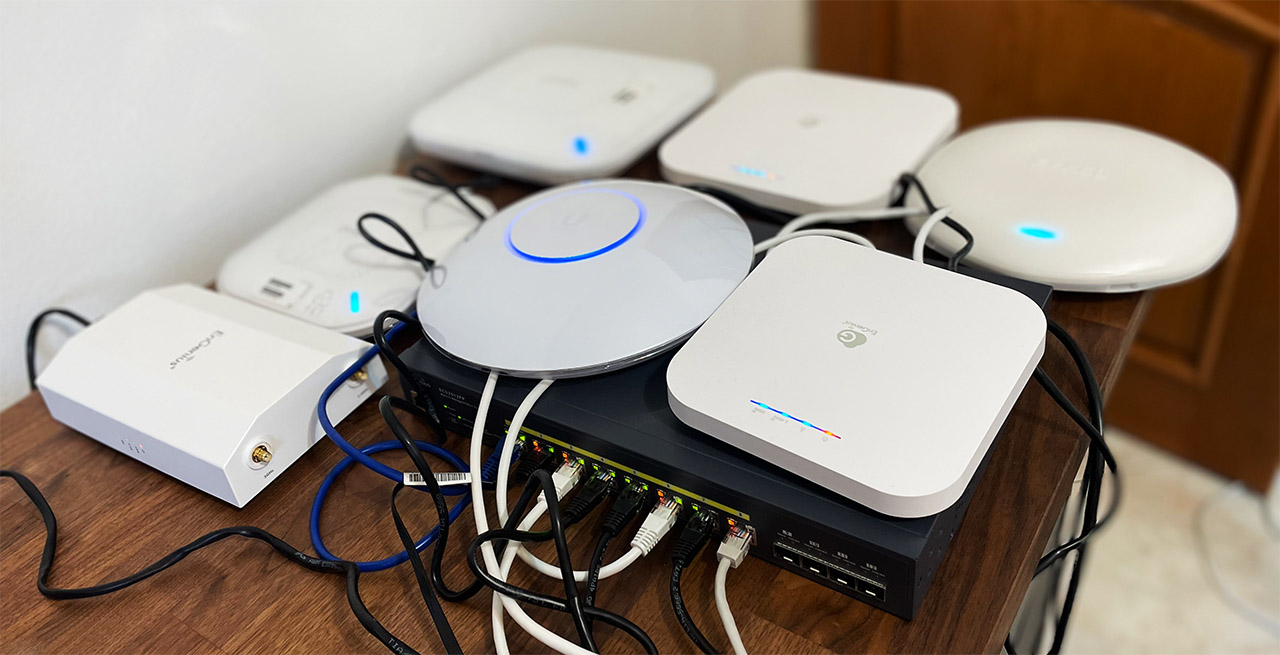
Abundance of Wireless Access Points.
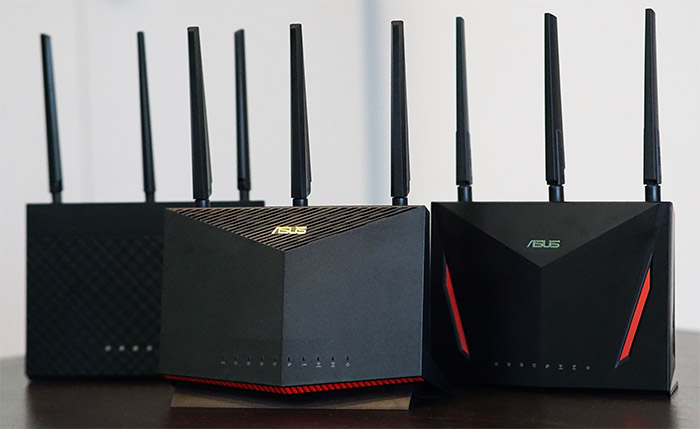
As a consequence, you may see some benefits in regard to coverage and throughput, despite not really being the main aim. It’s clear that those that stand to get the most benefit are SMBs and especially the enterprise market, so why do Asus, Netgear, TP-Link and other home-network-based manufacturers keep on pushing WiFi 6 routers forward? The tempting response is money, which is true, but only partially.
We have started to get more denser networks even in our homes (smart and IoT devices) and living in a city means your neighbors will also add to the creation of denser networks, so WiFi 6 could make sense, right? With the correct client devices, yes and you may also see a better range. So, let’s do a slightly deeper dive into the subject and understand whether WiFi 6 routers have a better range in real-life conditions.
The main factors that can determine the range of a router can be considered the transmit power, the antenna gain and the interference in the area where the signal needs to travel. The SoC will also play an important role on the WiFi performance of the router.
1. The Transmit Power
I have covered this topic a bit in a separate article, where I discussed whether the user should adjust the transmit power to their access point or leave the default values. And the conclusion was that the default values are usually wrong and yes, you should adjust them in a manner as to get a more efficient network, even if it may seem that the coverage will suffer. But before that know that there are legal limitations to the transmit power.
The FCC says that the maximum transmitter output power that goes towards the antenna can go up to 1 Watt (30dBm), but the EIRP caps that limit to 36dBm. The EIRP is the sum between the maximum output power that goes towards the antenna and the antenna gain.
This means that the manufacturer is free to try different variations between the power output and the antenna gain as to better reach the client devices, while keeping that limit in mind. This factor has not changed from the previous WiFi standard, so, the WiFi 6 has the same limit put in place as the WiFi 5 (and the previous wireless standards). The advice is to still lower the transmit gain as much as possible for the 2.4GHz radio and to increase it to the maximum for the 5GHz radio. That’s because the former radiates a lot better through objects, while the latter does not, but it provides far better speeds.
2. The Antenna Gain
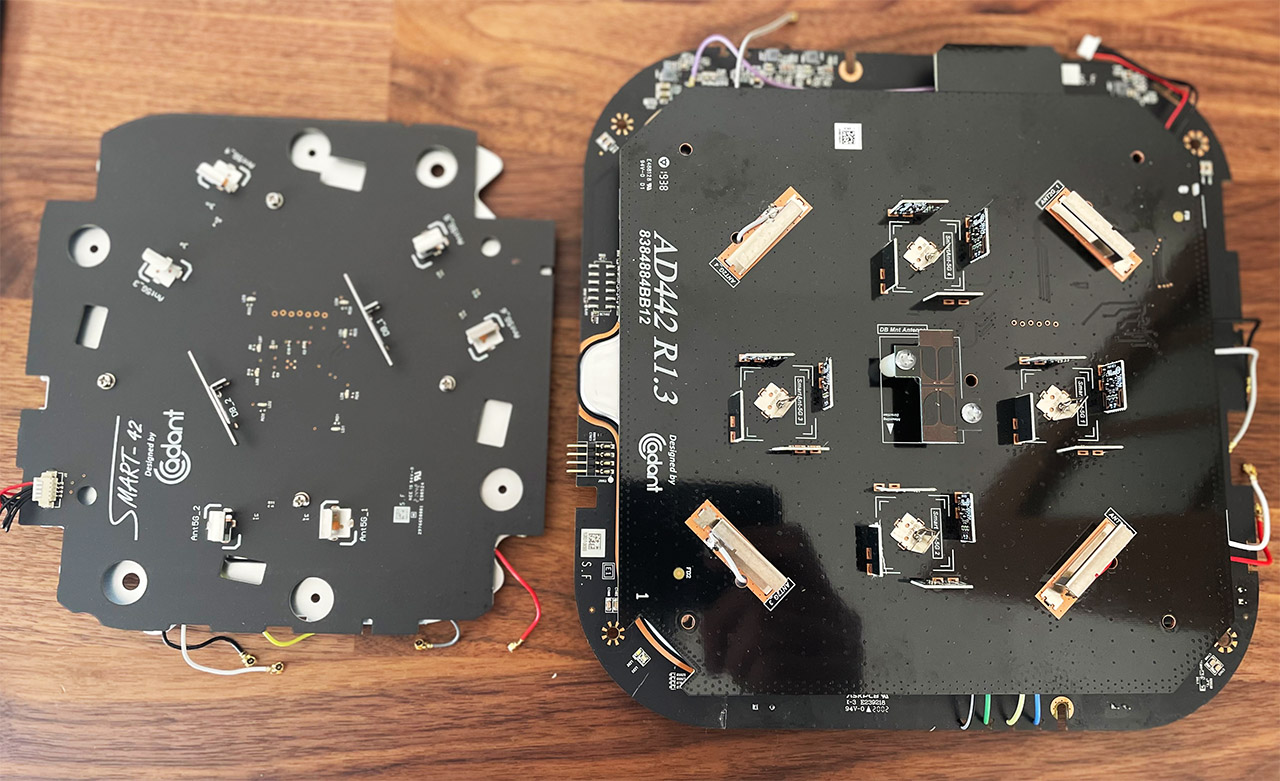
This ties in nicely with the previous section since, just like the output power, the antenna gain needs to be adjusted by the manufacturer within the limits dictated by the FCC. And there is an interesting thing that I noticed with the newer WiFi 6 routers, something that was not common with the previous gen routers. The antennas can’t be removed on most routers, only on the most expensive models.
This means that in most cases, you can’t upgrade the antennas, potentially having a better range. Before, you could take an older router, push the transmit power to the maximum (you could also push it past its hardware limits with DDWRT or some other third-party software) and then add some high-gain antennas.
Old TP-Link router.
This way, the range could have been better, but could you actually go past the allowed limit? The chipset inside the router most likely kept everything within the allowed limit, but you could still get closer to that limit. Would you see any benefit though? That’s another story because years ago, when there were way fewer wireless devices around, pushing everything to the maximum made sense due to the less amount of interference.
Nowadays, you’re just going to annoy your neighbors, while also making a mess of your WiFi clients connection. Sure, you will connect to a faraway client device, but will it be able to transfer data at a good speed? Doubt it, so it will just hog the entire network. The WiFi 6 standard does help alleviate this problem a bit, but we’ll talk more about it in a minute.
3. The WiFi Interference
This factor comes in different flavors. It can be from other devices that use the same channel, other access points that broadcast the signal through your house over the same channels or it can even be from your microwave. Ideally, you want to keep your WiFi inside your home, so that it doesn’t interfere with the WiFi signal from other routers or dedicated access points. Which is why the 5GHz radio has become the default option for connecting smartphones, laptops, TVs or PCs, while the 2.4GHz is usually left for the IoT devices.
Interesting antenna patterns to limit interference. Left: Zyxel WAX630S. Right Zyxel WAX650S.
At least this has been true for the WiFi 5 routers because the WiFi6 routers can use OFDMA on the 2.4GHz band and help push the throughput to spectacular levels (where it would actually be if there were little to no interference, it’s not an actual boost in speed). For example, the Asus RT-AX86U can reach up to 310Mbps at 5 feet (40MHz channel bandwidth), but very few routers implement it on both radios due to the cost constraints.
For example, the Ubiquiti U6-LR only uses OFDMA on the 5GHz radio band, further showing the tendency to leave the 2.4GHz for the IoT devices. Now let’s talk about the walls. There are two main behaviors that you need to keep in mind. First, there’s the obstacle aspect which is obvious since you can see that when you move your client device in another room than your router, the signal drops a bit. Moving it farther will add more attenuation and the speed will drop even more.
For example, I have an office that’s split into two by a very thick wall so, on paper, one router positioned in the middle should suffice for both sides, right? Not quite because this wall is very thick and made of concrete, so it works as a phenomenal signal blocker.
Asus AiMesh.
That’s why I needed two routers in the middle of the office to cover both sides effectively. The other aspect is signal reflection. What this means is that if you broadcast the signal in the open, it will reach let’s say up to 70 feet, but, if you broadcast it in a long hallway, you can get a great signal at the end of the hallway (could be double the distance than in the open field). But this also means that you may see some very weird, inconsistent coverage with your client devices.
What about the client devices?
This is a very important factor that is often overlooked when people talk about WiFi range and it’s incredibly important to understand the role of the network adapter especially in regard to the WiFi 6 client devices. First of all, understand that not all client devices are the same, some have a great receiver which can see the WiFi signal from very far away, others are very shy and want to be closer to the router. Then, there’s the specific features compatibility.
MU-MIMO, Beamforming and now the OFDMA have become a standard with newer routers, but, if the wireless client devices don’t support these features, it doesn’t really matter if they’re implemented or not. And this is one of the reasons why you may have noticed (even in my router tests) that a WiFi 5 client will most likely yield similar results when connected to a WiFi 5 router as well as when it’s connected to a WiFi 6 router. So, if you want to see improvements when using WiFi 6 routers, make sure that you have compatible adapters installed in your main client devices. Otherwise, there is no actual point to upgrading.
WiFi 6 adapter.
How can OFDMA improve range?
Yes, yes, I know OFDMA was not designed to improve the speed, nor the range of the network, but even so, the consequences of its optimizations are exactly these. A better throughput and a perceived far better range. The Orthogonal Frequency-Division Multiple Access breaks the channel frequency into smaller subcarriers, and it assigns them to individual clients.
So, while before, one client would start transmitting and every other client device had to wait until it was done, now, it’s possible to get multiple simultaneous data transmissions, greatly improving the efficiency of the network and significantly lowering the latency (which is excellent news for online gaming). I have talked about how a far-away client device can hog the network when I analyzed the best settings for the transmit power – that was because it would connect to the AP or router and transmit at a very low data speed rate.
Using OFDMA, in this type of scenario, it can improve the network behavior and, even if the range itself isn’t changed, due to the way the networks are so much denser nowadays, you’ll get a more efficient network behavior for both close and far away client devices. So yes, better range and more speed.
BSS Coloring to tame the interference
I already mentioned that the interference from other APs or wireless routers will have a major impact on the perceived range of your network.
And one of the reasons is the co-channel interference which occurs when multiple access points use the same channel and are therefore constrained to share it between them. As a consequence, you get a slower network because if there are lots of connected clients, they’ll easily fill up the available space. The BSS coloring assigns a color code to each client device which is then assigned to its closest access point.
This way, the signal broadcast is reduced from the client side as to not interfere with the other APs or client devices in the proximity. Obviously, the power output is still high enough to ensure a proper communication with the AP. And I know you haven’t seen this feature advertised as much on the boxes of APs or routers, which is due to cost constraints. I have seen it on the EnGenius EWS850AP, a WiFi 6 outdoors access point which is a device suitable for some very specific applications, but not on many other WiFi 6 networking devices.
Besides cost, the reason why it’s not that common especially on consumer-type WiFi 6 routers is that it’s not yet that useful. I say that because unless all the clients in the area are equipped with WiFi 6 adapters, the WiFi 5 (and lower) client devices will still broadcast their signal as far away as they can, interfering with the other WiFi devices.
Do WiFi 6 routers actually have a better range?
In an ideal, lab environment, most likely not, since as I said, the idea is to handle denser networks and not to push the WiFi range farther.
But in real-life conditions, you should see a far better perceived range if the right conditions are met. And almost everything revolves around using WiFi 6 client devices that can actually take advantage of these awesome features. It’s also wise to adjust the settings of your router or AP accordingly since the default values are very rarely good. Ideally, so should your neighbors since only this way, you will see a proper improvement in both range and network performance. Otherwise, there is barely any reason to upgrade from the WiFi 5 equipment.
At the same time, it’s worth checking out the WiFi 6E which adds a new frequency band, the 6GHz, which can actually increase the throughput in a spectacular manner since the radio is subjected to far less interference (the range doesn’t seem changed though). I have recently tested the EnGenius ECW336 which uses this new standard and yes, it’s a bit pricy, but Zyxel has released a new WiFi 6E AP that is a bit cheaper, and I will be testing it soon.
In light of the current global price hikes for energy, you’re very much justified in worrying about how many Watts your PoE switch actually uses. And, unless you have solar panels to enable your ‘lavish’ lifestyle, you’re going to have a bad time running too many networking devices at the same time, especially if they’re old and inefficient. But there’s the dilemma of features. For example, if we were to put two TVs together, an older one and a newer, it would be obvious that the latter would consume less power.
EnGenius ECS2512FP Switch with lots of Ethernet cables.
But, after adding all the new features and technologies which do require more power to be drawn, plus the higher price tag and it becomes clear that it’s less of an investment than we initially thought. Still, the manufacturers are clearly pushing the users towards the use of PoE instead of the power adapter – the newer Ubiquiti access points only have a PoE Ethernet port.
And it makes sense considering that they’re easier to install, without worrying about being close to a power source, no more used outlets and the possibility to have centralized control via a PoE switch. But, for some people, all these advantages may fall short if the power consumption of such a setup exceeds the acceptable threshold, so, for those of you conflicted about whether you should give PoE Ethernet switches a try, let’s see how much Watts they actually consume.
The PoE standard started being implemented into network switches about two decades ago and it became a bit more common for SMBs about 10 years ago. The first PoE switch that I tested was from Open Mesh (the S8) and it supported the IEEE 802.3at/af.
Open Mesh S8 Ethernet Switch.
This meant that the power output per port was 30 Watts, so it can’t really be considered an old switch (unless you take into account that Open Mesh doesn’t exist anymore). But I wanted to mention this switch because while the total power budget was 150 Watts, it did need to rely on a fan to keep the case cool. Very recently I tested the EnGenius ECS2512FP which offers almost double the PoE budget, 2.5GbE ports and it relies on passive cooling.
So, even if it may not seem so at first, even in the last five years, there have been significant advancements in regard to power efficiency. Indeed, a very old Ethernet switch that supports only the PoE 802.11af standard (15.4W limit per port) most likely needed to be cooled by fans and was not really built with the power efficiency aspect in mind. Before I get an angry mob to scream that the EEE from the IEEE stands for Energy-Efficient Ethernet, so adhering to the 802.3af standard should already ensure that the switch doesn’t consume that much power, I had another standard in mind.
Multiple wireless access points.
It’s the Green Ethernet from the 802.3az standard that made the difference with network switches that had lots of Ethernet ports. And this is an important technology because it makes sure that if a host has not been active for a long time, then the port to which is connected enters a sort of stand-by mode, where the power consumption is significantly reduced.
The port will become active again once there is activity from the client side, so the switch does ping the device from time to time (what I want to say is that the power is not completely turned off). So, if the network switch is older, it may not have this technology which means that you may lose a few dollars a month for this reason alone.
How many Watts does a PoE switch use by itself?
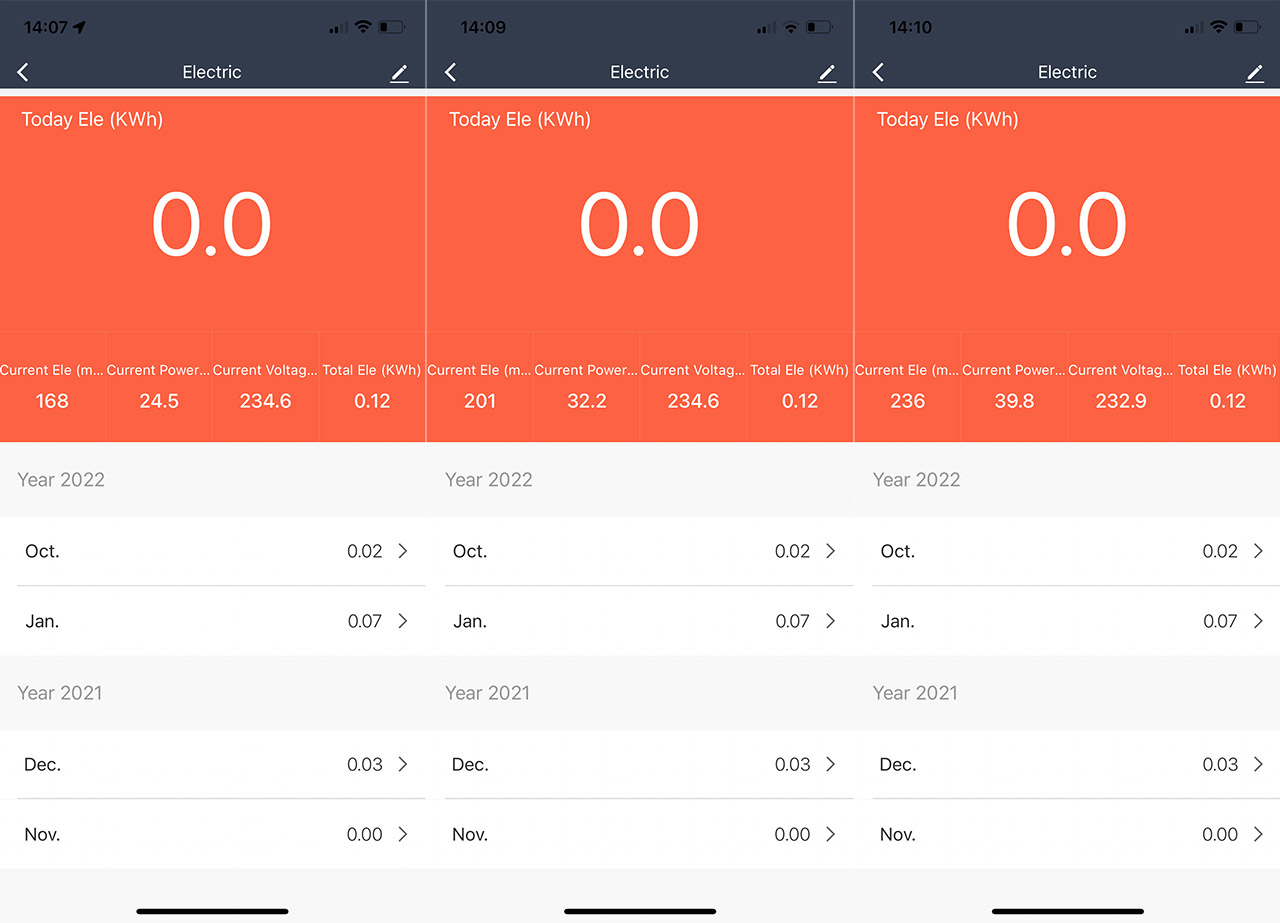
It depends on the PoE switch that you’re using. A 48-port switch that has three fans which run at full speed all the time is going to consume far more power than the 8-port unmanaged switch. You don’t have to believe me, let’s just check the numbers. I was lucky enough to still have the FS S3400-48T4SP around (it supports the 802.3af/at and has a maximum PoE budget of 370W), so I connected it to a power source and checked how many Watts it eats up when no device is connected to any of the 48 PoE ports.
FS S3400-48T4SP – 1st: no devices connected. 2nd: TP-Link EAP660 HD connected. 3rd: Both the EAP660 HD and the EAP670 connected.
It was 24.5 Watts which is surprisingly efficient considering the size of the switch and the four fans that run all the time. The manufacturer says that the maximum power consumption can be 400W, so the approx. 25W without any PoE device falls within the advertised amount. Next, I checked the power consumption of the Zyxel XS1930-12HP.
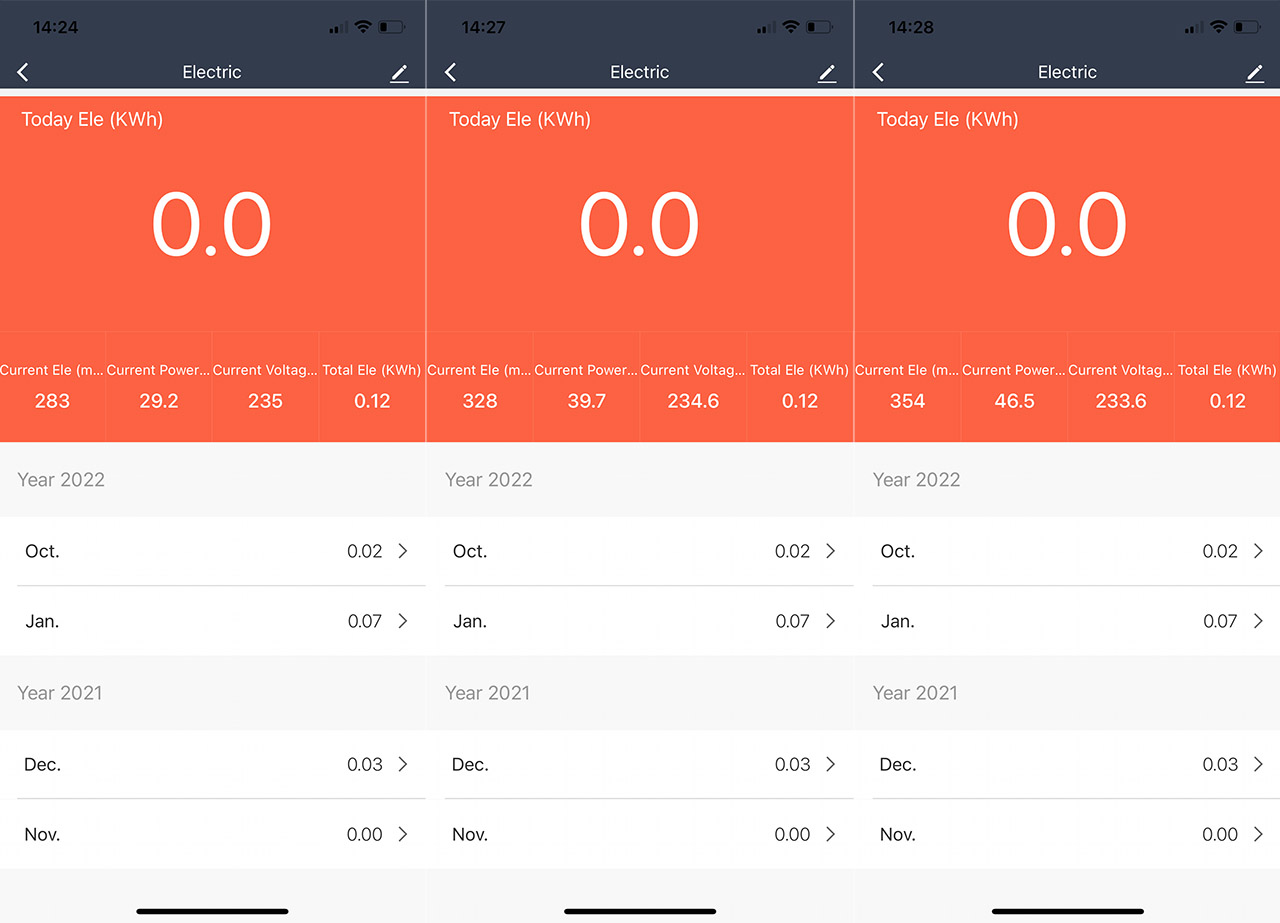
This switch is very particular because it has eight 10Gbps Ethernet ports and it supports the PoE++ standard (IEEE 802.3bt) which means that each port can offer up to 60W of PoE budget per device. At the same time, the maximum PoE budget is 375 Watts and, while no device was connected to any port, the Ethernet switch drew an average of 29 Watts (the switch does have two fans).
Zyxel XS1930-12HP – 1st: no devices connected. 2nd: TP-Link EAP660 HD connected. 3rd: Both the EAP660 HD and the EAP670 connected.
Yes, it’s more than the 48-port from FS, so it’s not always the case that having more ports means that there is a higher power consumption – obviously, more PoE devices will raise the overall power consumption.
Unmanaged vs Managed switches
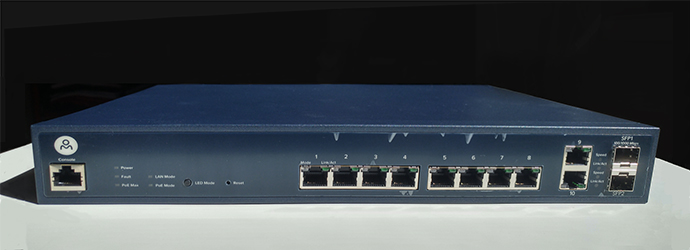
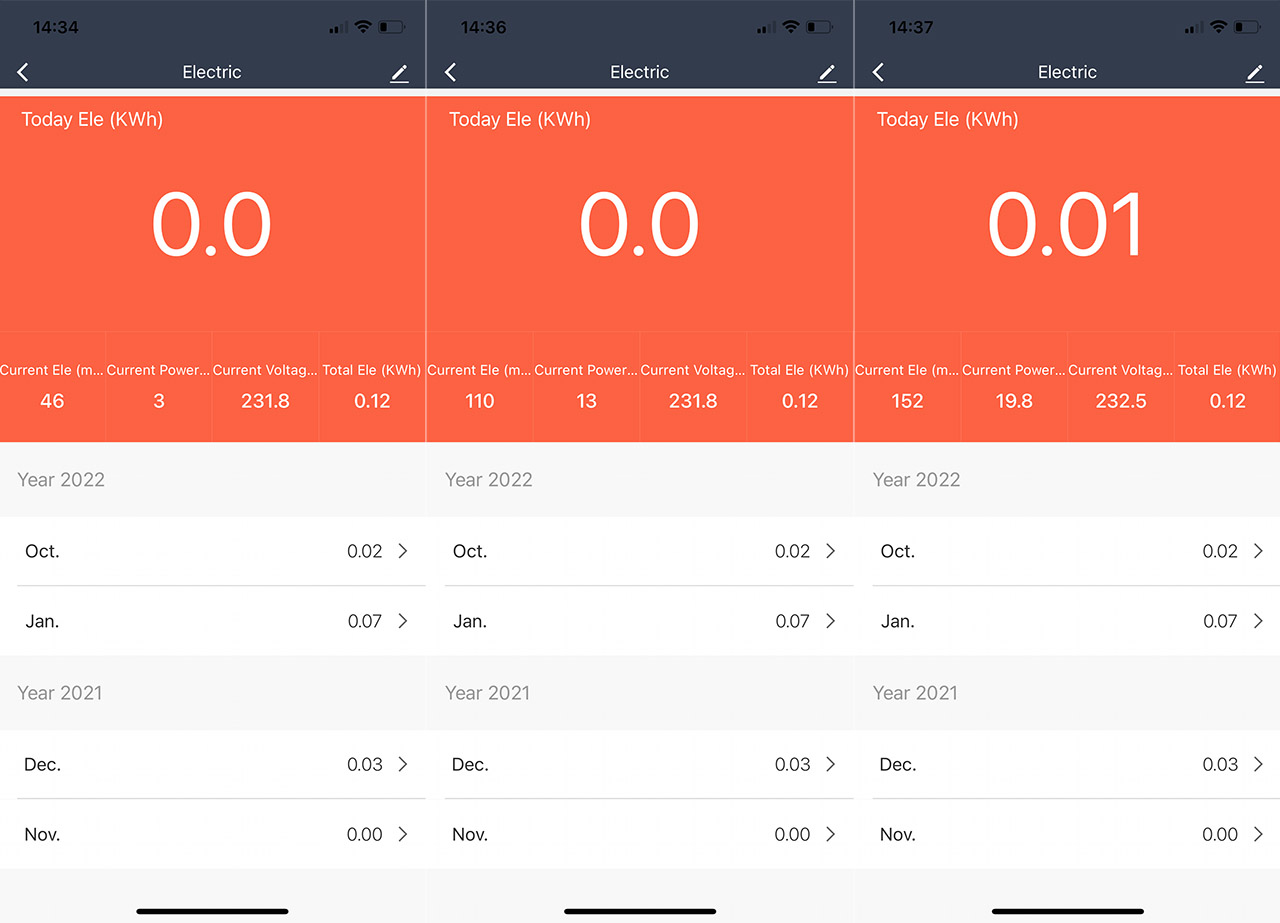
Lastly, I checked out the power consumption of an unmanaged switch, the TRENDnet TPE-LG80 which has eight PoE ports, with a maximum budget of 65W. The PoE standards that are supported are the IEEE 802.3af and the IEEE 802.3at, so it can go up to 30W per port. That being said, the actual power consumption when there was no device connected was 3 Watts.
TRENDnet TPE-LG80 – 1st: no devices connected. 2nd: TP-Link EAP660 HD connected. 3rd: Both the EAP660 HD and the EAP670 connected.
Quite the difference when compared to the other two switches, but it was to be expected for a small unmanaged Gigabit PoE switch.
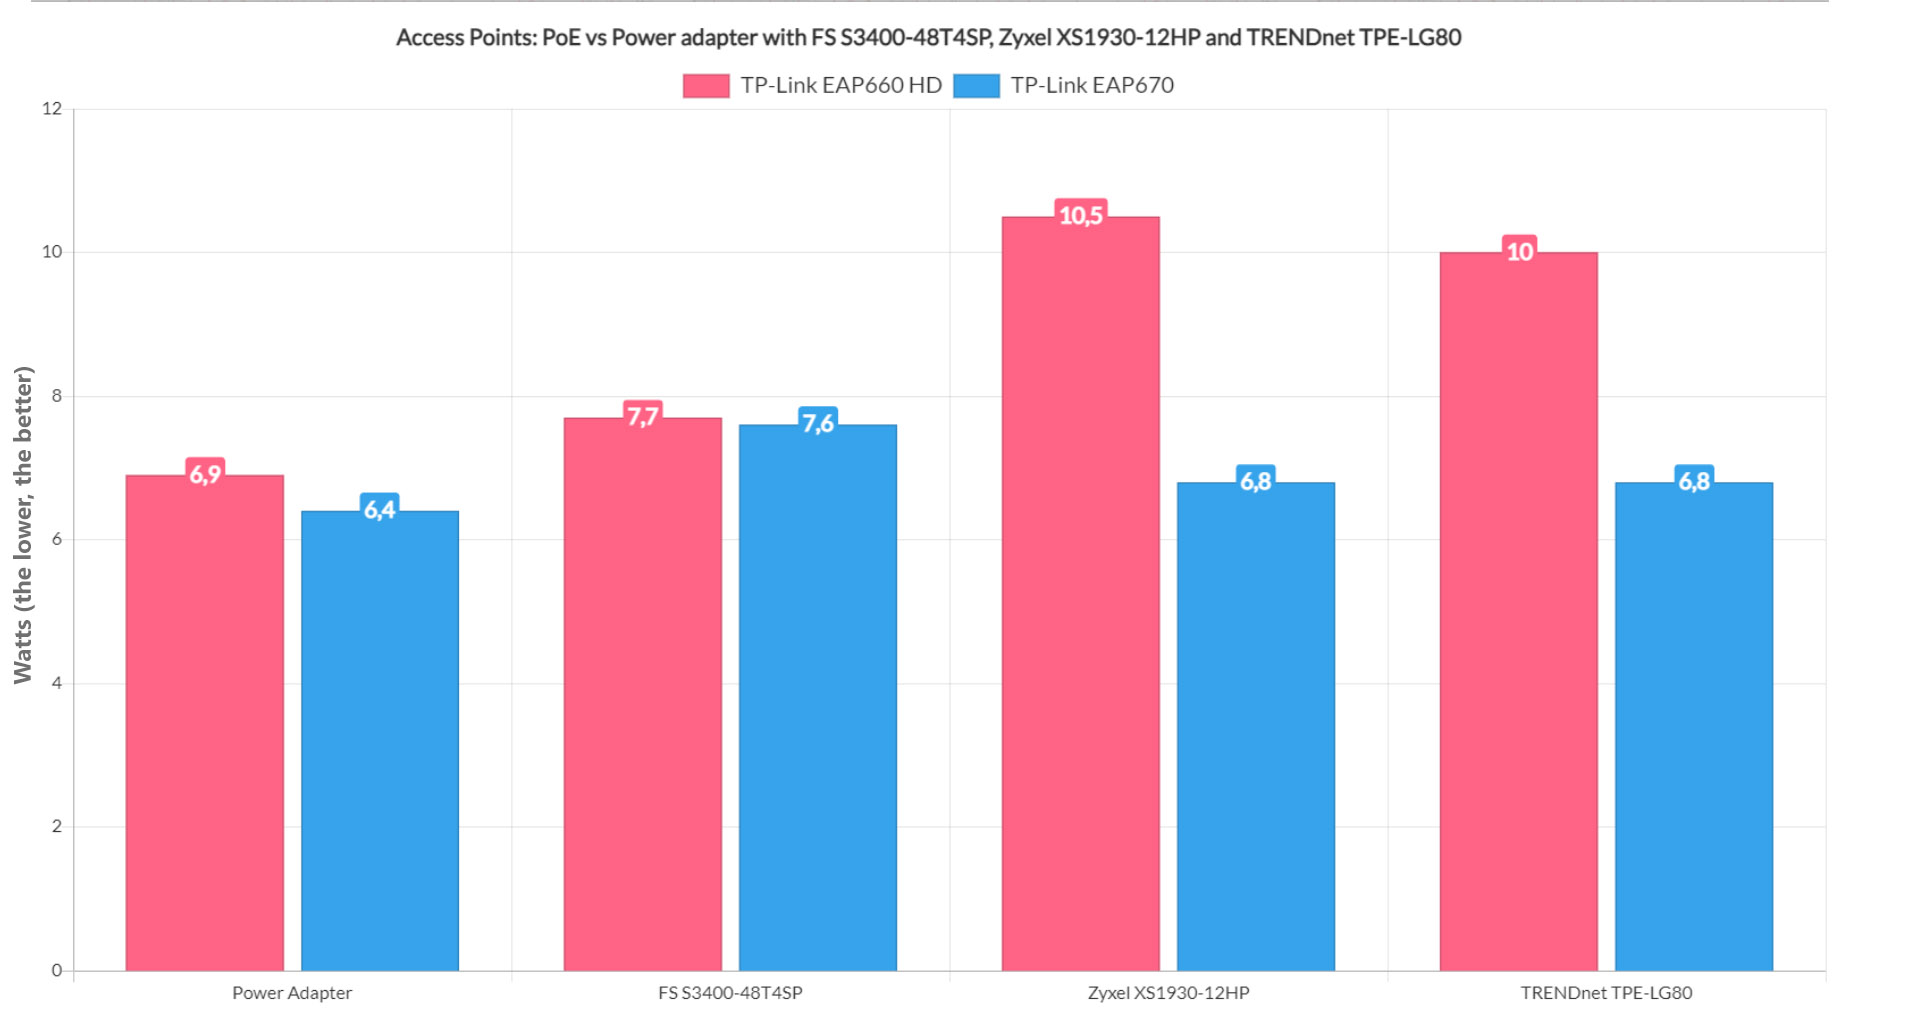
Access Points: PoE vs Power adapter
I am not going to bore you with details. You know what an access point is, and you also know that some have a power adapter, while some don’t. So, I took the TP-Link EAP660 HD and the EAP670 (because I had them left on the desk after testing them) and I checked if the power consumption differs between PoE and using the provided adapter. Also, I connected the APs to the three switches mentioned above to see if there’s a difference in PoE use between brands and between managed and unmanaged switches.
The TP-Link EAP660-HD draws an average of 6.9 Watts when connected to the socket via the power adapter. The EAP670 needs a bit less, since the average was 6.4 Watts. When connected to the 48-port FS S3400-48T4SP, the EAP660 HD needed 7.7W from the PoE budget, while the EAP670 added 7.6W, so, overall, the power consumption is more elevated. Moving on to the PoE++ Zyxel XS1930-12HP switch, I saw that adding the TP-Link EAP660HD, it required 10.5W and, connecting the EAP670 meant that an additional 6.8W which is quite the difference.
Comparison Access Points: PoE vs Power adapter.
Obviously, neither access points were connected to any client device, so there should be no extra overhead. In any case, we see that the PoE consumption is once again slightly more elevated than using the power adapters. Lastly, after connecting the EAP660 HD to the unmanaged TRENDnet TPE-LG80, the power consumption rose by 10 Watts, which is in line with the previous network switch. Adding the EAP670, it showed that an extra 6.8W were drawn, which is again, the same value as on the previous switch.
As a conclusion, we can see objectively that using the power adapter means less power consumption and that’s without taking into account the power needed to keep the switch itself alive.
Does the standard matter?
I won’t really extrapolate on all the available PoE switches on the market, but in my experience, it does seem that the PoE++ switches (those that support the 802.3at standard) do consume more power than the 802.3af/at switches, so yes, the standards do matter. Is it a significant difference?
The switches and the access points that I just tested.
Well, it can add up if you have lots of switches for lots of access points but bear in mind that most APs will work just fine with the 30W limitation in place, so, unless you need something very particular, I’m not sure that the PoE++ is mandatory. For now, since it’s going to become more widespread and efficient in time.
Passive cooled PoE switches vs Fans
This one is pretty obvious. Yes, fans do need more power than a passive cooling system, so, at least in the first minutes or hours, the advantage goes to the passive cooling. But things do change when the power supply and the components start to build heat which makes the entire system less efficient than the fan-cooling systems.
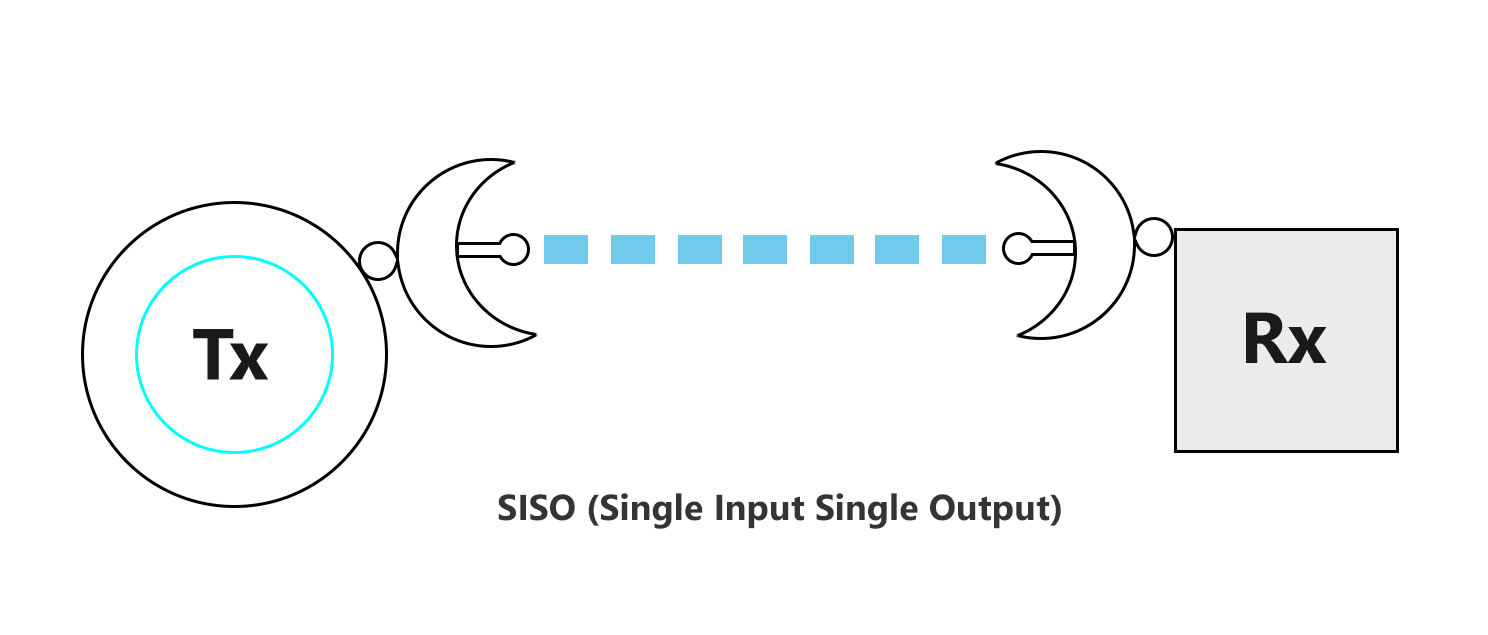
The spatial streams are connections made between the router and the client device where data is being sent. To get an even better grasp of what I am talking about, we need to go way back, down to the WiFi 3 (IEEE 802.11g standard) and lower which used what is called SISO systems (Single Input Single Output). The idea was to use a single transmitter antenna and the signal would get received by the access point on a single antenna.
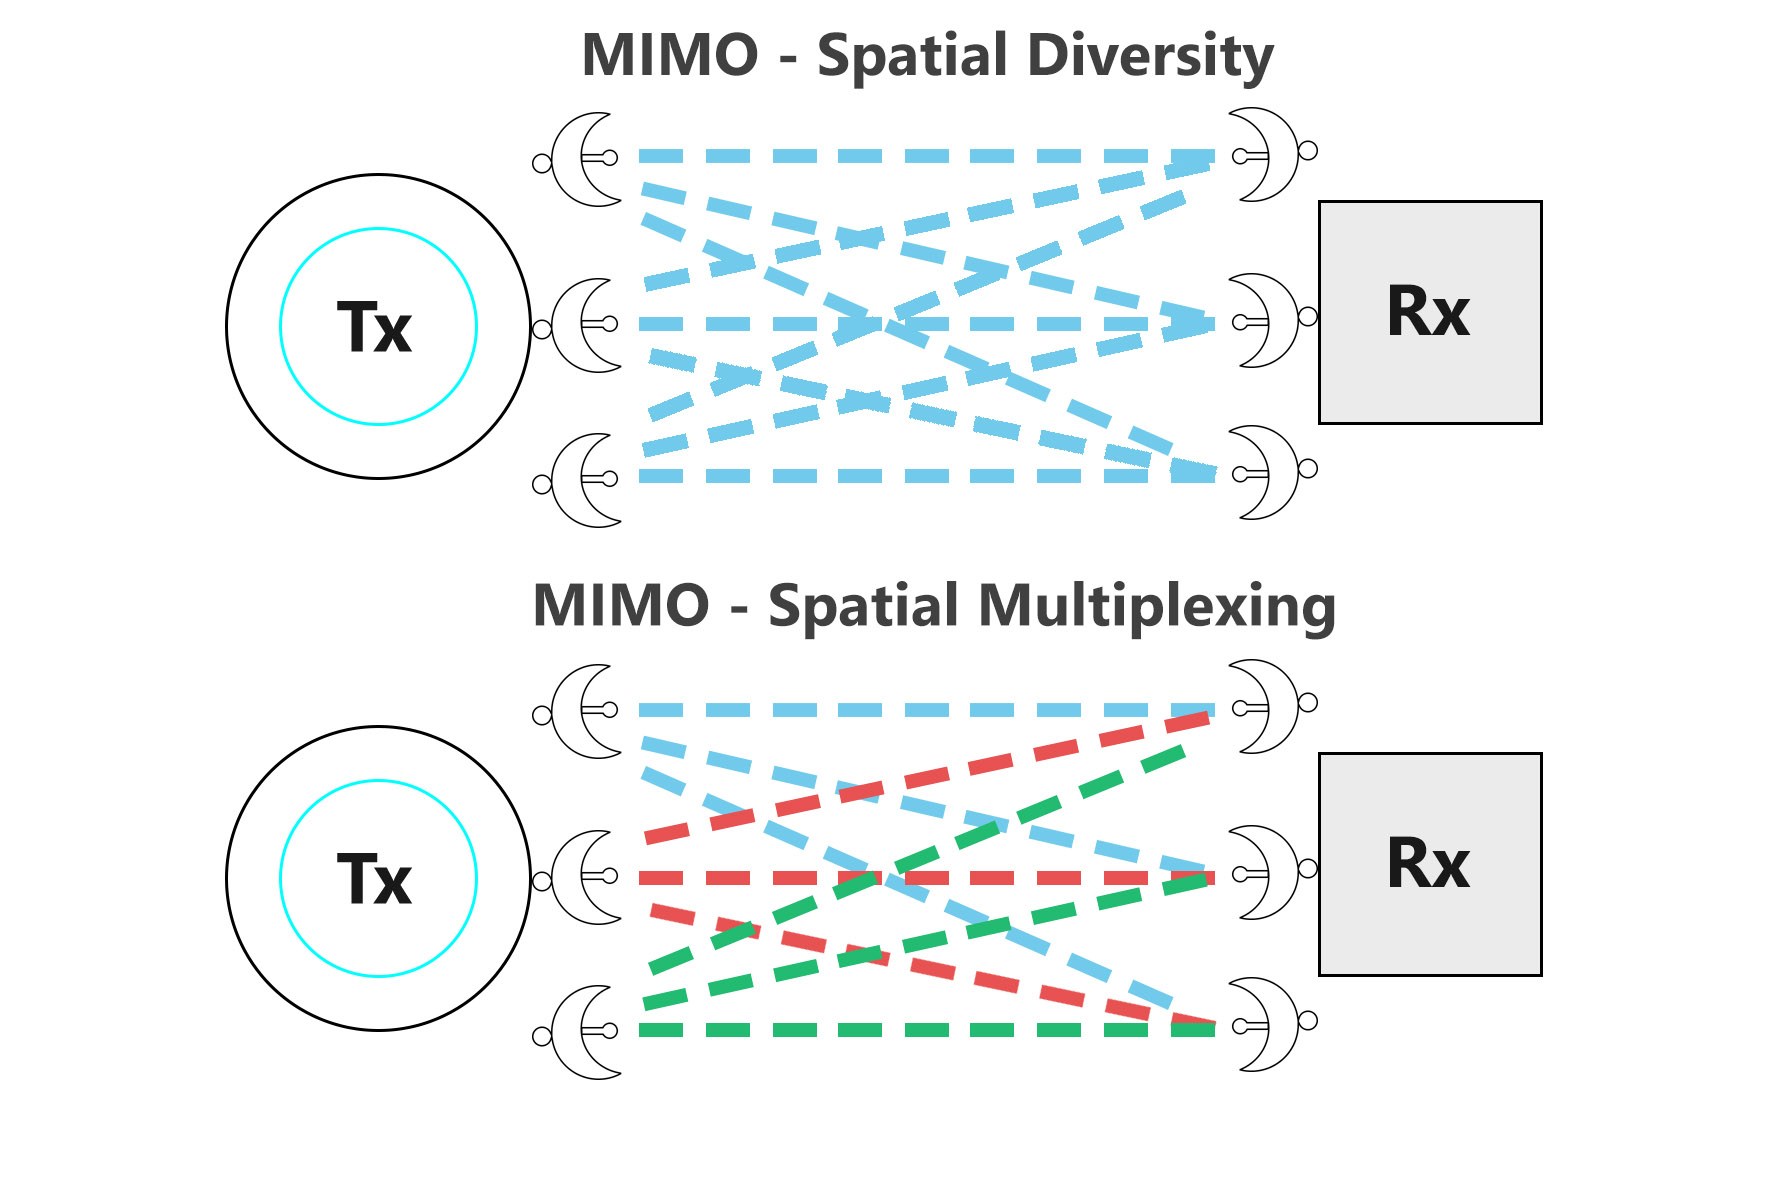
And it’s true that the early days of WiFi routers were promising, but also quite rough because without clear line of sight, the AP could experience reflections of the signal in the room (multi-path fading), the risk to experience the cliff effect if there are too many interference and more. Obviously, these problems were mostly fixed with the emergence of the MIMO, which uses multiple transmission antennas to send the signal towards multiple reception antennas.
SISO (Single Input Single Output)
In other words, the slightly more modern approach is to use multiple spatial streams to send and receive the data. Then there’s the MU-MIMO which takes things to another level. And I know you came here to understand what the numbers on the router box actually mean, if MU-MIMO actually matters and if support for 4×4, 8×8 or 16×16 (and more) are something that your wireless router (or separate access point) needs to have. You will see that most of is just over-the-top advertising with little to no real-life improvements to the WiFi performance, so let’s see why that is. Before that, let’s get a better understanding of the spatial streams and MIMO.
We already established what the SISO is, but there are some other configurations that the manufacturers have explored before using the MIMO approach. For example, the SIMO (Single Input Multiple Output) uses more than one receiver antennas on the same radio to capture the signal, so it has more than one chances to be properly processed. And there’s also the MISO approach where the signal is broadcasted across more than one stream with a single antenna receiving it.
The MIMO is the better form, where the same signal is transmitted across multiple streams and it is also received by multiple antennas. But, it’s not that it chooses which signal is the better one, no, all get processed and the end result is what the receiver interprets to be the original signal based on what it received at different intervals, with various amounts of data loss and so on. What we previously discussed is called spatial diversity where the same signal gets transmitted across multiple spatial streams towards multiple antennas, therefore keeping the risk of degradation to the minimum, but there are other approaches as well.
MIMO – Spatial Diversity and Spatial Multiplexing.
One of them is called spatial multiplexing where the idea is to increase the data transfer rate since more than one independent stream of data is transmitted via multiple streams. The risk comes from interference which is why the data streams aren’t transmitted at the same time, but are phased out at different points in time. Another method that helps move data without risking collision or interference is by dividing the bandwidth into multiple frequency bands, each used to stream an independent and separate signal.
It’s also know as FDM, but I am sure you may have also heard about the OFDM which moved data a bit different. To make the bandwidth use even more efficient, the carriers are orthogonal. This means that instead of being far apart, as they were with the FDM, with the OFDM, they are more densely packed and the distance between carriers is minimal since there is little adjacent channel interference.
Spatial Streams and MU-MIMO
MU-MIMO (Multiple User Multiple Input Multiple Output) is supposed to be some sort of holy grail for handling multiple demanding client devices. That’s because while SU-MIMO (or MIMO) can handle one client device at a time, the MU-MIMO should serve more than one devices at the same time.
MU-MIMO – Linksys EA8500.
If you don’t yet know, the way the client devices are handled ‘in the traditional sense’ (SU-MIMO), is first arrived, first served. So, if the device is connected at a high data transfer rate, it receives or sends the data quickly and lets another device to be served. With the modern hardware, you won’t even notice that your WiFi devices actually take turns. That it, unless you start streaming large packets of data at the same time on multiple devices which is where you’re going to start seeing the buffering icon.
Furthermore, be aware that devices that are far away and are connected at a lower data transfer rate are going to slow down the network because it will take longer to finish up the task (which is why it’s better to avoid legacy devices and to not increase the transmit power on your access point).
MU-MIMO doesn’t really change the way it handles a single client, but it can do the same for more than one devices at the same time. Imagine that your router starts behaving as if it were two, four or more routers at the same time. This way, the client devices don’t have to wait one after the other. The problem is that MU-MIMO doesn’t seem to rise to the expectations. Yet.
Is MU-MIMO under performing?
On paper, it shouldn’t. And the router boxes do have the theoretical maximum data transfer rates printed in bold letters and numbers. So, the first culprit is the advertisement. You know that Asus, TP-Link, Linksys or Netgear router that seemingly should reach 6,000Mbps (AX6000) or more since we also have AX1100 routers now? Well, you’re not going to see those number in real life.
Netgear RAX43.
Actually if you’re checking the single stream performance, it most likely won’t even get close to 1Gbps. So, what’s the deal? Well, the manufacturers add up the maximum possible rate for each radio, which, in turn is based on the maximum amount of data streams that can be handled at the same time. This means that using MU-MIMO, you’re going to actually see a better performance? Well, not as much as you’d have hoped and in some cases, you may actually see a worse performance.
At least two sources (1)(2) have confirmed that not only did they not see a better performance when using MU-MIMO devices, but in some cases it was actually a bit worse. That’s not because the technology is bad, it’s because the WiFi adapters just aren’t that great. Most PC adapters, laptops and smartphones are still stuck with a 2×2 MU-MIMO WiFi adapter. And both Qualcomm and Broadcom chipsets seem to drop to 1×1 even if the client devices were 2×2, while the router was 4×4. These tests were done with WiFi 5 hardware, where MU-MIMO was limited to downstream only. So has anything changed with WiFi 6?
Besides adding support for MU-MIMO upstream as well, it does seem that MU-MIMO does offer some improvements with WiFi 6 client devices and access points, but only detrimental. So, it seems that MU-MIMO can be useful in only very specific scenarios, in a very crowded network, where the client devices don’t move around.
WiFi 6 adapter on a Desktop PC.
But, in most cases, it’s still a borderline gimmick that manufacturers like to put on their box to sell the router. That’s because the client devices are still way behind the WiFi technological advances and the consumer routers are underpowered. Still, if you have multiple 4×4 MU-MIMO PCs and a powerful WiFi 6 access points, you may see a benefit if your network is pushed to the limit.
Beamforming
You may have seen the term Beamforming being advertised alongside MU-MIMO on the wireless router / AP boxes and it refers to a very interesting technique where the signal is transmitted towards the connected clients and not broadcasted everywhere. The way the wireless routers (or access points) do this is by identifying the compatible receiver and then increasing the power output (including the transfer data rates) only towards that client device. The particularity of using Beamforming is that it’s effective only for medium-range transmissions.
If the client device is close enough to the router, then it’s already at a high transfer rate and it doesn’t need to use Beamforming. The same is true if the client device is too far because the gain from Beamforming will not be enough to increase the data transfer rate. But what’s even more interesting is that despite being advertised as a technology that’s going to change the way your devices connect to the network, it’s actually very rarely used with commercial devices. That’s because of the aforementioned antenna gain.
Source: TP-Link official website.
Beamforming works best with Point to Point access points because the idea is to focus the signal over very large distances with clear line of sight, without worrying about going above some set limit. Indoors, there is a limit set by EIRP and your access point or wireless router will make sure it won’t go above it. So, even if the Beamforming is able to push way past that limit (for example, three or four beamforming antennas can easily go past the 6dbi maximum gain), the transmit power will be severely cut.
But there is more because it seems that the WiFi 5 and WiFi 6 routers (and access points) will prioritize spatial multiplexing over beamforming, especially on the 4×4 and lower devices. Obviously, the one at a time approach still applies here as well, and the AP will switch dynamically between the supported modes when handling a client device. Even so, having the support for more multiple spatial streams, the better for the signal, right? Yes, the more spatial streams that are available, the more ways to properly transmit the data you will have, ensuring that it arrives at the destination quickly and as intact as possible.
Ajax is a JavaScript-based web technology that helps you to build dynamic and interactive websites. WordPress uses Ajax to power many of its core admin area features such as auto-saving posts, user session management, and notifications.
By default, WordPress directs all Ajax calls through the admin-ajax.php file located in the site’s /wp-admin directory.
Numerous simultaneous Ajax requests can lead to high admin-ajax.php usage, resulting in a considerably slowed down server and website. It’s one of the most common problems faced by many unoptimized WordPress sites. Typically, it manifests itself as a slow website or an HTTP 5xx error (mostly 504 or 502 errors).
In this article, you’ll learn about WordPress’ admin-ajax.php file, how it works, its benefits and drawbacks, and how you can diagnose and fix the high admin-ajax.php usage issue.
Ready to go? Let’s roll out!
What Is the admin-ajax.php File?
The admin-ajax.php file contains all the code for routing Ajax requests on WordPress. Its primary purpose is to establish a connection between the client and the server using Ajax. WordPress uses it to refresh the page’s contents without reloading it, thus making it dynamic and interactive to the users.
A basic overview of how Admin Ajax works on WordPress
Since the WordPress core already uses Ajax to power its various backend features, you can use the same functions to use Ajax on WordPress. All you need to do is register an action, point it to your site’s admin-ajax.php file, and define how you want it to return the value. You can set it to return HTML, JSON, or even XML.
admin-ajax.php file in WordPress
As per WordPress Trac, the admin-ajax.php file first appeared in WordPress 2.1. It’s also referred to as Ajax Admin in the WordPress development community.
Checking Ajax usage in MyKinsta dashboard
The chart above only shows the amount of admin-ajax.php requests, not where they might be coming from. It’s a great way to see when the spikes are occurring. You can combine it with other techniques mentioned in this post to narrow down the primary cause.
Checking the number of admin-ajax.php requests in Chrome DevTools
You can also use Chrome DevTools to see how many requests are being sent to admin-ajax.php. You can also check out the Timings tab under the Network section to find out how much time it takes to process these requests.
As for finding the exact reason behind high admin-ajax.php usage, there are primarily two main causes: one due to frontend, and the other due to backend. We’ll discuss both below.
Unlock more growth, zero guesswork
Subscribe to our newsletter – we’re serving up the latest web dev news and tips you’ll actually use.
How to Debug High admin-ajax.php Usage on WordPress
Third-party plugins are one of the most common reasons behind high admin-ajax.php usage. Typically, this issue is seen on the site’s frontend and shows up frequently in speed test reports.
But plugins aren’t the only culprit here as themes, the WordPress core, the webserver, and a DDoS attack can also be the reason behind high Admin Ajax usage.
Let’s explore them in more detail.
How to Determine the Origin of High admin-ajax.php Usage for Plugins and Themes
Just because a plugin uses Ajax doesn’t mean that it’ll slow down your site.
Viewing the admin-ajax.php request in WebPageTest report
Usually, Admin Ajax loads towards the end of the page load. Also, you can set Ajax requests to load asynchronously, so it can have little to no effect on the page’s perceived performance for the user.
As you can see in the WebPageTest report above, admin-ajax.php loads towards the end of the requests queue, but it still takes up 780 ms. That’s a lot of time for just one request.
GTmetrix report indicating a serious admin-ajax.php usage spike
When developers don’t implement Ajax properly on WordPress, it can lead to drastic performance issues. The above GTmetrix report is a perfect example of such behavior.
You can also use GTmetrix to dig into individual post and response data. You can use this feature to pinpoint what’s causing the issue.
To do that, go to GTmetrix report’s Waterfall tab, and then find and click the POST admin-ajax.php item. You’ll see three tabs for this request: Headers, Post, and Response.
POST admin-ajax.php request’s Headers data
Checking out the request’s Post and Response tabs will give you some hints to find out the reasons behind the performance issue. For this site, you can see clues in the Response tab.
POST admin-ajax.php request’s Response data
You can see that part of the response has something to do with an input tag with id set to “fusion-form-nonce-656”.
A quick search of this clue will lead you to ThemeFusion’s website, the creators of Avada theme. Hence, you can conclude that the request is originating from the theme, or any of the plugins it’s bundled with.
In such a case, you must first ensure that the Avada theme and all its related plugins are fully updated. If that doesn’t fix the issue, then you can try disabling the theme and see if that fixes the issue.
Unlike disabling a plugin, disabling a theme isn’t feasible in most scenarios. Hence, try optimizing the theme to remove any bottlenecks. You can also reach out to the theme’s support team to see if they can suggest a better solution.
Testing another slow website in GTmetrix led to finding similar issues with Visual Composer page builder and Notification Bar plugins.
Another POST admin-ajax.php request’s Response dataPOST admin-ajax.php request’s Post data
Thankfully, if you cannot resolve an issue with the plugin, you most like have many alternative plugins available to try out. For example, when it comes to page builders you could also try out Beaver Builder or Elementor.
One platform, dozens of premium hosting features
The list is too long for this section. But you can find them all here. (Hint: you’ll save $275 worth of premium features, included in all WordPress plans.)
How to Determine the Origin of High admin-ajax.php
Sometimes, the Post and Response data presented in speed test reports may not be as clear and straightforward. Here, finding the origin of high admin-ajax.php usage isn’t as easy. In such cases, you can always do it the old-school way.
Disable all your site’s plugins, clear your site’s cache (if any), and then run a speed test again. If admin-ajax.php is still present, then the most likely culprit is the theme. But if it’s nowhere to be found, then you must activate each plugin one-by-one and run the speed tests each time. By process of elimination, you’ll lock down on the issue’s origin.
Diagnosing Backend Server Issues with admin-ajax.php
The second most common reason for high admin-ajax.php usage is the WordPress Heartbeat API generating frequent Ajax calls, leading to high CPU usage on the server. Typically, this is caused because of many users logged into the WordPress backend dashboard. Hence, you won’t see this show up in speed tests.
By default, the Heartbeat API polls the admin-ajax.php file every 15 seconds to auto-save posts or pages. If you’re using a shared hosting server, then you don’t have many server resources dedicated to your site. If you’re editing a post or page and leave the tab open for a significant time, then it can rack up a lot of Admin Ajax requests.
For example, when you’re writing or editing posts, a single user alone can generate 240 requests in an hour!
Frequent autosave admin-ajax.php requests
That’s a lot of requests on the backend with just one user. Now imagine a site where there are multiple editors logged in concurrently. Such a site can rack up Ajax requests rapidly, generating high CPU usage.
That was the situation discovered by DARTDrones when the company was preparing its WooCommerce site for an expected surge in traffic following an appearance on Shark Tank.
Before being featured on the television show, the DARTDrones site was receiving over 4,100 admin-ajax.php calls in a day with only 2,000 unique visitors. That’s a weak requests-to-visits ratio.
Heavy admin-ajax.php usage on dartdrones.com
Investigators noticed the /wp-admin referrer URL and correctly determined the root cause. These requests were due to DARTDrones’ admins and editors updating the site frequently in anticipation of the show.
WordPress has fixed this Heartbeat API issue partially long ago. For instance, you can reduce the frequency of requests generated by the Heartbeat API on hosts with limited resources. It also suspends itself after one hour of keyboard/mouse/touch inactivity.
Overwhelming your site with a DDoS attack or spam bots can also lead to high admin-ajax.php usage. However, such an attack doesn’t necessarily target increasing Admin Ajax requests. It’s just collateral damage.
If your site is under a DDoS attack, your priority should be to get it behind a robust CDN/WAF like Cloudflare or Sucuri. Every hosting plan with Kinsta includes free Cloudflare integration and Kinsta CDN, which can help you offload your website’s resources to a large extent.
WordPress uses Ajax in its Heartbeat API to implement many of its core features. However, it can lead to increased load times if not used correctly. This is typically caused due to a high frequency of requests to the admin-ajax.php file.
In this article, you learned the various causes for high admin-ajax.php usage, how to diagnose what’s responsible for this symptom, and how you can go about fixing it. In most cases, following this guide should get your site back up and running smoothly in no time.
However, in some cases upgrading to a server with higher resources is the only viable solution. Especially for demanding use cases such as ecommerce and membership sites. If you’re running such a site, consider upgrading to a managed WordPress host who is experienced with these types of performance issues.
If you’re still struggling with high admin-ajax.php usage on your WordPress site, let us know in the comments section.
Save time and costs, plus maximize site performance, with $275+ worth of enterprise-level integrations included in every Managed WordPress plan. This includes a high-performance CDN, DDoS protection, malware and hack mitigation, edge caching, and Google’s fastest CPU machines. Get started with no long-term contracts, assisted migrations, and a 30-day money-back guarantee.
Check out our plans or talk to sales to find the plan that’s right for you.
Salman Ravoof
Salman Ravoof is a self-taught web developer, writer, creator, and a huge admirer of Free and Open Source Software (FOSS). Besides tech, he’s excited by science, philosophy, photography, arts, cats, and food. Learn more about him on his website, and connect with Salman on Twitter.
Welcome to the sixteenth edition of Cloudflare’s DDoS Threat Report. This edition covers DDoS trends and key findings for the fourth and final quarter of the year 2023, complete with a review of major trends throughout the year.
What are DDoS attacks?
DDoS attacks, or distributed denial-of-service attacks, are a type of cyber attack that aims to disrupt websites and online services for users, making them unavailable by overwhelming them with more traffic than they can handle. They are similar to car gridlocks that jam roads, preventing drivers from getting to their destination.
There are three main types of DDoS attacks that we will cover in this report. The first is an HTTP request intensive DDoS attack that aims to overwhelm HTTP servers with more requests than they can handle to cause a denial of service event. The second is an IP packet intensive DDoS attack that aims to overwhelm in-line appliances such as routers, firewalls, and servers with more packets than they can handle. The third is a bit-intensive attack that aims to saturate and clog the Internet link causing that ‘gridlock’ that we discussed. In this report, we will highlight various techniques and insights on all three types of attacks.
Previous editions of the report can be found here, and are also available on our interactive hub, Cloudflare Radar. Cloudflare Radar showcases global Internet traffic, attacks, and technology trends and insights, with drill-down and filtering capabilities for zooming in on insights of specific countries, industries, and service providers. Cloudflare Radar also offers a free API allowing academics, data sleuths, and other web enthusiasts to investigate Internet usage across the globe.
To learn how we prepare this report, refer to our Methodologies.
Key findings
In Q4, we observed a 117% year-over-year increase in network-layer DDoS attacks, and overall increased DDoS activity targeting retail, shipment and public relations websites during and around Black Friday and the holiday season.
In Q4, DDoS attack traffic targeting Taiwan registered a 3,370% growth, compared to the previous year, amidst the upcoming general election and reported tensions with China. The percentage of DDoS attack traffic targeting Israeli websites grew by 27% quarter-over-quarter, and the percentage of DDoS attack traffic targeting Palestinian websites grew by 1,126% quarter-over-quarter — as the military conflict between Israel and Hamas continues.
In Q4, there was a staggering 61,839% surge in DDoS attack traffic targeting Environmental Services websites compared to the previous year, coinciding with the 28th United Nations Climate Change Conference (COP 28).
For an in-depth analysis of these key findings and additional insights that could redefine your understanding of current cybersecurity challenges, read on!
Illustration of a DDoS attack
Hyper-volumetric HTTP DDoS attacks
2023 was the year of uncharted territories. DDoS attacks reached new heights — in size and sophistication. The wider Internet community, including Cloudflare, faced a persistent and deliberately engineered campaign of thousands of hyper-volumetric DDoS attacks at never before seen rates.
These attacks were highly complex and exploited an HTTP/2 vulnerability. Cloudflare developed purpose-built technology to mitigate the vulnerability’s effect and worked with others in the industry to responsibly disclose it.
As part of this DDoS campaign, in Q3 our systems mitigated the largest attack we’ve ever seen — 201 million requests per second (rps). That’s almost 8 times larger than our previous 2022 record of 26 million rps.
Largest HTTP DDoS attacks as seen by Cloudflare, by year
Growth in network-layer DDoS attacks
After the hyper-volumetric campaign subsided, we saw an unexpected drop in HTTP DDoS attacks. Overall in 2023, our automated defenses mitigated over 5.2 million HTTP DDoS attacks consisting of over 26 trillion requests. That averages at 594 HTTP DDoS attacks and 3 billion mitigated requests every hour.
Despite these astronomical figures, the amount of HTTP DDoS attack requests actually declined by 20% compared to 2022. This decline was not just annual but was also observed in 2023 Q4 where the number of HTTP DDoS attack requests decreased by 7% YoY and 18% QoQ.
On the network-layer, we saw a completely different trend. Our automated defenses mitigated 8.7 million network-layer DDoS attacks in 2023. This represents an 85% increase compared to 2022.
In 2023 Q4, Cloudflare’s automated defenses mitigated over 80 petabytes of network-layer attacks. On average, our systems auto-mitigated 996 network-layer DDoS attacks and 27 terabytes every hour. The number of network-layer DDoS attacks in 2023 Q4 increased by 175% YoY and 25% QoQ.
HTTP and Network-layer DDoS attacks by quarter
DDoS attacks increase during and around COP 28
In the final quarter of 2023, the landscape of cyber threats witnessed a significant shift. While the Cryptocurrency sector was initially leading in terms of the volume of HTTP DDoS attack requests, a new target emerged as a primary victim. The Environmental Services industry experienced an unprecedented surge in HTTP DDoS attacks, with these attacks constituting half of all its HTTP traffic. This marked a staggering 618-fold increase compared to the previous year, highlighting a disturbing trend in the cyber threat landscape.
This surge in cyber attacks coincided with COP 28, which ran from November 30th to December 12th, 2023. The conference was a pivotal event, signaling what many considered the ‘beginning of the end’ for the fossil fuel era. It was observed that in the period leading up to COP 28, there was a noticeable spike in HTTP attacks targeting Environmental Services websites. This pattern wasn’t isolated to this event alone.
Looking back at historical data, particularly during COP 26 and COP 27, as well as other UN environment-related resolutions or announcements, a similar pattern emerges. Each of these events was accompanied by a corresponding increase in cyber attacks aimed at Environmental Services websites.
In February and March 2023, significant environmental events like the UN’s resolution on climate justice and the launch of United Nations Environment Programme’s Freshwater Challenge potentially heightened the profile of environmental websites, possibly correlating with an increase in attacks on these sites.
This recurring pattern underscores the growing intersection between environmental issues and cyber security, a nexus that is increasingly becoming a focal point for attackers in the digital age.
DDoS attacks and Iron Swords
It’s not just UN resolutions that trigger DDoS attacks. Cyber attacks, and particularly DDoS attacks, have long been a tool of war and disruption. We witnessed an increase in DDoS attack activity in the Ukraine-Russia war, and now we’re also witnessing it in the Israel-Hamas war. We first reported the cyber activity in our report Cyber attacks in the Israel-Hamas war, and we continued to monitor the activity throughout Q4.
DDoS attacks targeting Israeli and Palestinian websites, by industry
Relative to each region’s traffic, the Palestinian territories was the second most attacked region by HTTP DDoS attacks in Q4. Over 10% of all HTTP requests towards Palestinian websites were DDoS attacks, a total of 1.3 billion DDoS requests — representing a 1,126% increase in QoQ. 90% of these DDoS attacks targeted Palestinian Banking websites. Another 8% targeted Information Technology and Internet platforms.
Top attacked Palestinian industries
Similarly, our systems automatically mitigated over 2.2 billion HTTP DDoS requests targeting Israeli websites. While 2.2 billion represents a decrease compared to the previous quarter and year, it did amount to a larger percentage out of the total Israel-bound traffic. This normalized figure represents a 27% increase QoQ but a 92% decrease YoY. Notwithstanding the larger amount of attack traffic, Israel was the 77th most attacked region relative to its own traffic. It was also the 33rd most attacked by total volume of attacks, whereas the Palestinian territories was 42nd.
Of those Israeli websites attacked, Newspaper & Media were the main target — receiving almost 40% of all Israel-bound HTTP DDoS attacks. The second most attacked industry was the Computer Software industry. The Banking, Financial Institutions, and Insurance (BFSI) industry came in third.
Top attacked Israeli industries
On the network layer, we see the same trend. Palestinian networks were targeted by 470 terabytes of attack traffic — accounting for over 68% of all traffic towards Palestinian networks. Surpassed only by China, this figure placed the Palestinian territories as the second most attacked region in the world, by network-layer DDoS attack, relative to all Palestinian territories-bound traffic. By absolute volume of traffic, it came in third. Those 470 terabytes accounted for approximately 1% of all DDoS traffic that Cloudflare mitigated.
Israeli networks, though, were targeted by only 2.4 terabytes of attack traffic, placing it as the 8th most attacked country by network-layer DDoS attacks (normalized). Those 2.4 terabytes accounted for almost 10% of all traffic towards Israeli networks.
Top attacked countries
When we turned the picture around, we saw that 3% of all bytes that were ingested in our Israeli-based data centers were network-layer DDoS attacks. In our Palestinian-based data centers, that figure was significantly higher — approximately 17% of all bytes.
On the application layer, we saw that 4% of HTTP requests originating from Palestinian IP addresses were DDoS attacks, and almost 2% of HTTP requests originating from Israeli IP addresses were DDoS attacks as well.
Main sources of DDoS attacks
In the third quarter of 2022, China was the largest source of HTTP DDoS attack traffic. However, since the fourth quarter of 2022, the US took the first place as the largest source of HTTP DDoS attacks and has maintained that undesirable position for five consecutive quarters. Similarly, our data centers in the US are the ones ingesting the most network-layer DDoS attack traffic — over 38% of all attack bytes.
HTTP DDoS attacks originating from China and the US by quarter
Together, China and the US account for a little over a quarter of all HTTP DDoS attack traffic in the world. Brazil, Germany, Indonesia, and Argentina account for the next twenty-five percent.
Top source of HTTP DDoS attacks
These large figures usually correspond to large markets. For this reason, we also normalize the attack traffic originating from each country by comparing their outbound traffic. When we do this, we often get small island nations or smaller market countries that a disproportionate amount of attack traffic originates from. In Q4, 40% of Saint Helena’s outbound traffic were HTTP DDoS attacks — placing it at the top. Following the ‘remote volcanic tropical island’, Libya came in second, Swaziland (also known as Eswatini) in third. Argentina and Egypt follow in fourth and fifth place.
Top source of HTTP DDoS attacks with respect to each country’s traffic
On the network layer, Zimbabwe came in first place. Almost 80% of all traffic we ingested in our Zimbabwe-based data center was malicious. In second place, Paraguay, and Madagascar in third.
Top source of Network-layer DDoS attacks with respect to each country’s traffic
Most attacked industries
By volume of attack traffic, Cryptocurrency was the most attacked industry in Q4. Over 330 billion HTTP requests targeted it. This figure accounts for over 4% of all HTTP DDoS traffic for the quarter. The second most attacked industry was Gaming & Gambling. These industries are known for being coveted targets and attract a lot of traffic and attacks.
Top industries targeted by HTTP DDoS attacks
On the network layer, the Information Technology and Internet industry was the most attacked — over 45% of all network-layer DDoS attack traffic was aimed at it. Following far behind were the Banking, Financial Services and Insurance (BFSI), Gaming & Gambling, and Telecommunications industries.
Top industries targeted by Network-layer DDoS attacks
To change perspectives, here too, we normalized the attack traffic by the total traffic for a specific industry. When we do that, we get a different picture.
Top attacked industries by HTTP DDoS attacks, by region
We already mentioned in the beginning of this report that the Environmental Services industry was the most attacked relative to its own traffic. In second place was the Packaging and Freight Delivery industry, which is interesting because of its timely correlation with online shopping during Black Friday and the winter holiday season. Purchased gifts and goods need to get to their destination somehow, and it seems as though attackers tried to interfere with that. On a similar note, DDoS attacks on retail companies increased by 16% compared to the previous year.
Top industries targeted by HTTP DDoS attacks with respect to each industry’s traffic
On the network layer, Public Relations and Communications was the most targeted industry — 36% of its traffic was malicious. This too is very interesting given its timing. Public Relations and Communications companies are usually linked to managing public perception and communication. Disrupting their operations can have immediate and widespread reputational impacts which becomes even more critical during the Q4 holiday season. This quarter often sees increased PR and communication activities due to holidays, end-of-year summaries, and preparation for the new year, making it a critical operational period — one that some may want to disrupt.
Top industries targeted by Network-layer DDoS attacks with respect to each industry’s traffic
Most attacked countries and regions
Singapore was the main target of HTTP DDoS attacks in Q4. Over 317 billion HTTP requests, 4% of all global DDoS traffic, were aimed at Singaporean websites. The US followed closely in second and Canada in third. Taiwan came in as the fourth most attacked region — amidst the upcoming general elections and the tensions with China. Taiwan-bound attacks in Q4 traffic increased by 847% compared to the previous year, and 2,858% compared to the previous quarter. This increase is not limited to the absolute values. When normalized, the percentage of HTTP DDoS attack traffic targeting Taiwan relative to all Taiwan-bound traffic also significantly increased. It increased by 624% quarter-over-quarter and 3,370% year-over-year.
Top targeted countries by HTTP DDoS attacks
While China came in as the ninth most attacked country by HTTP DDoS attacks, it’s the number one most attacked country by network-layer attacks. 45% of all network-layer DDoS traffic that Cloudflare mitigated globally was China-bound. The rest of the countries were so far behind that it is almost negligible.
Top targeted countries by Network-layer DDoS attacks
When normalizing the data, Iraq, Palestinian territories, and Morocco take the lead as the most attacked regions with respect to their total inbound traffic. What’s interesting is that Singapore comes up as fourth. So not only did Singapore face the largest amount of HTTP DDoS attack traffic, but that traffic also made up a significant amount of the total Singapore-bound traffic. By contrast, the US was second most attacked by volume (per the application-layer graph above), but came in the fiftieth place with respect to the total US-bound traffic.
Top targeted countries by HTTP DDoS attacks with respect to each country’s traffic
Similar to Singapore, but arguably more dramatic, China is both the number one most attacked country by network-layer DDoS attack traffic, and also with respect to all China-bound traffic. Almost 86% of all China-bound traffic was mitigated by Cloudflare as network-layer DDoS attacks. The Palestinian territories, Brazil, Norway, and again Singapore followed with large percentages of attack traffic.
Top targeted countries by Network-layer DDoS attacks with respect to each country’s traffic
Attack vectors and attributes
The majority of DDoS attacks are short and small relative to Cloudflare’s scale. However, unprotected websites and networks can still suffer disruption from short and small attacks without proper inline automated protection — underscoring the need for organizations to be proactive in adopting a robust security posture.
In 2023 Q4, 91% of attacks ended within 10 minutes, 97% peaked below 500 megabits per second (mbps), and 88% never exceeded 50 thousand packets per second (pps).
Two out of every 100 network-layer DDoS attacks lasted more than an hour, and exceeded 1 gigabit per second (gbps). One out of every 100 attacks exceeded 1 million packets per second. Furthermore, the amount of network-layer DDoS attacks exceeding 100 million packets per second increased by 15% quarter-over-quarter.
DDoS attack stats you should know
One of those large attacks was a Mirai-botnet attack that peaked at 160 million packets per second. The packet per second rate was not the largest we’ve ever seen. The largest we’ve ever seen was 754 million packets per second. That attack occurred in 2020, and we have yet to see anything larger.
This more recent attack, though, was unique in its bits per second rate. This was the largest network-layer DDoS attack we’ve seen in Q4. It peaked at 1.9 terabits per second and originated from a Mirai botnet. It was a multi-vector attack, meaning it combined multiple attack methods. Some of those methods included UDP fragments flood, UDP/Echo flood, SYN Flood, ACK Flood, and TCP malformed flags.
This attack targeted a known European Cloud Provider and originated from over 18 thousand unique IP addresses that are assumed to be spoofed. It was automatically detected and mitigated by Cloudflare’s defenses.
This goes to show that even the largest attacks end very quickly. Previous large attacks we’ve seen ended within seconds — underlining the need for an in-line automated defense system. Though still rare, attacks in the terabit range are becoming more and more prominent.
1.9 Terabit per second Mirai DDoS attacks
The use of Mirai-variant botnets is still very common. In Q4, almost 3% of all attacks originate from Mirai. Though, of all attack methods, DNS-based attacks remain the attackers’ favorite. Together, DNS Floods and DNS Amplification attacks account for almost 53% of all attacks in Q4. SYN Flood follows in second and UDP floods in third. We’ll cover the two DNS attack types here, and you can visit the hyperlinks to learn more about UDP and SYN floods in our Learning Center.
DNS floods and amplification attacks
DNS floods and DNS amplification attacks both exploit the Domain Name System (DNS), but they operate differently. DNS is like a phone book for the Internet, translating human-friendly domain names like “www.cloudfare.com” into numerical IP addresses that computers use to identify each other on the network.
Simply put, DNS-based DDoS attacks comprise the method computers and servers used to identify one another to cause an outage or disruption, without actually ‘taking down’ a server. For example, a server may be up and running, but the DNS server is down. So clients won’t be able to connect to it and will experience it as an outage.
A DNS flood attack bombards a DNS server with an overwhelming number of DNS queries. This is usually done using a DDoS botnet. The sheer volume of queries can overwhelm the DNS server, making it difficult or impossible for it to respond to legitimate queries. This can result in the aforementioned service disruptions, delays or even an outage for those trying to access the websites or services that rely on the targeted DNS server.
On the other hand, a DNS amplification attack involves sending a small query with a spoofed IP address (the address of the victim) to a DNS server. The trick here is that the DNS response is significantly larger than the request. The server then sends this large response to the victim’s IP address. By exploiting open DNS resolvers, the attacker can amplify the volume of traffic sent to the victim, leading to a much more significant impact. This type of attack not only disrupts the victim but also can congest entire networks.
In both cases, the attacks exploit the critical role of DNS in network operations. Mitigation strategies typically include securing DNS servers against misuse, implementing rate limiting to manage traffic, and filtering DNS traffic to identify and block malicious requests.
Top attack vectors
Amongst the emerging threats we track, we recorded a 1,161% increase in ACK-RST Floods as well as a 515% increase in CLDAP floods, and a 243% increase in SPSS floods, in each case as compared to last quarter. Let’s walk through some of these attacks and how they’re meant to cause disruption.
Top emerging attack vectors
ACK-RST floods
An ACK-RST Flood exploits the Transmission Control Protocol (TCP) by sending numerous ACK and RST packets to the victim. This overwhelms the victim’s ability to process and respond to these packets, leading to service disruption. The attack is effective because each ACK or RST packet prompts a response from the victim’s system, consuming its resources. ACK-RST Floods are often difficult to filter since they mimic legitimate traffic, making detection and mitigation challenging.
CLDAP floods
CLDAP (Connectionless Lightweight Directory Access Protocol) is a variant of LDAP (Lightweight Directory Access Protocol). It’s used for querying and modifying directory services running over IP networks. CLDAP is connectionless, using UDP instead of TCP, making it faster but less reliable. Because it uses UDP, there’s no handshake requirement which allows attackers to spoof the IP address thus allowing attackers to exploit it as a reflection vector. In these attacks, small queries are sent with a spoofed source IP address (the victim’s IP), causing servers to send large responses to the victim, overwhelming it. Mitigation involves filtering and monitoring unusual CLDAP traffic.
SPSS floods
Floods abusing the SPSS (Source Port Service Sweep) protocol is a network attack method that involves sending packets from numerous random or spoofed source ports to various destination ports on a targeted system or network. The aim of this attack is two-fold: first, to overwhelm the victim’s processing capabilities, causing service disruptions or network outages, and second, it can be used to scan for open ports and identify vulnerable services. The flood is achieved by sending a large volume of packets, which can saturate the victim’s network resources and exhaust the capacities of its firewalls and intrusion detection systems. To mitigate such attacks, it’s essential to leverage in-line automated detection capabilities.
Cloudflare is here to help – no matter the attack type, size, or duration
Cloudflare’s mission is to help build a better Internet, and we believe that a better Internet is one that is secure, performant, and available to all. No matter the attack type, the attack size, the attack duration or the motivation behind the attack, Cloudflare’s defenses stand strong. Since we pioneered unmetered DDoS Protection in 2017, we’ve made and kept our commitment to make enterprise-grade DDoS protection free for all organizations alike — and of course, without compromising performance. This is made possible by our unique technology and robust network architecture.
It’s important to remember that security is a process, not a single product or flip of a switch. Atop of our automated DDoS protection systems, we offer comprehensive bundled features such as firewall, bot detection, API protection, and caching to bolster your defenses. Our multi-layered approach optimizes your security posture and minimizes potential impact. We’ve also put together a list of recommendations to help you optimize your defenses against DDoS attacks, and you can follow our step-by-step wizards to secure your applications and prevent DDoS attacks. And, if you’d like to benefit from our easy to use, best-in-class protection against DDoS and other attacks on the Internet, you can sign up — for free! — at cloudflare.com. If you’re under attack, register or call the cyber emergency hotline number shown here for a rapid response.
Visit 1.1.1.1 from any device to get started with our free app that makes your Internet faster and safer.
To learn more about our mission to help build a better Internet, start here. If you’re looking for a new career direction, check out our open positions.