A Step-by-Step Guide to Export Office 365 Mailbox to PST

April 26, 2023 Thiraviam

As an organization admin, you may encounter situations such as users leaving their position or migrating to another mail service, etc. In such circumstances, you need to export Office 365 mailbox to PST and store them offline for investigation purposes. You can accomplish this in Office 365 without depending on any external third-party tools. You can export individual mailboxes or entire exchange mailboxes as an eDiscovery admin through the Microsoft Purview compliance portal. 

This guide will walk you through the steps to export Office 365 mailboxes to PST format using eDiscovery and PowerShell.  

Why Do We Need to Export Exchange Online Mailbox to PST?

PST stands for Personal Storage Table file format used by Microsoft Outlook to store email messages, contacts and calendar entries. When you back up your email mailbox to a PST file, that will be saved on your computer. 

Here are some reasons why PST files are commonly used for exporting Office 365 mailbox data: 

Compatibility: PST files can be opened and accessed by a variety of email clients, including Outlook and some third-party email clients. This makes it easy to share data with others or to access your data from different devices. 

Portability: PST files are small in size and can be easily transferred to a different location, such as a hard drive, USB drive, or cloud storage. This makes it easy to create backups of your mailbox data or to move your data to a different computer. 

Offline Access: PST files can be accessed even when you are not connected to the internet, making it easy to access your email messages and other data when you are on the go. 

Organization: PST files allow you to organize your email messages, contacts, and other data into folders, making it easy to find and retrieve specific items. 

Steps to Export Office 365 Mailbox to PST

As an Office 365 admin you can get the Exchange Online mailboxes and their details by exporting them to PST with eDiscovery admin permission. You need to follow the steps listed below. 

  1. Assign eDiscovery administrator 
  2. Content search to export Office 365 mailbox 
  3. Export Office 365 mailbox to PST 
  4. Download exported PST file from Office 365 mailbox

Assign eDiscovery Administrator 

To export Office 365 mailboxes, you must be an eDiscovery Administrator. By default, this role is not assigned to a global administrator. Follow the steps to assign user(s) to eDiscovery admin role.  

  1. Login to the Microsoft Purview compliance portal with your global administrator account. 
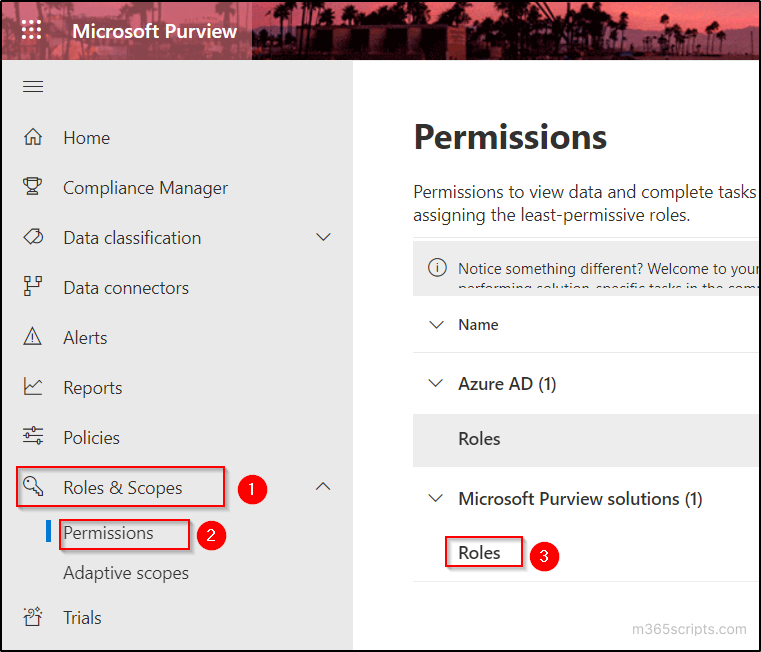
  2. Navigate to ‘Roles & Scopes’ tab and select ‘Permissions’ option. 
  3. Select ‘Roles’ under ‘Microsoft Purview Solutions’ category.                                                                                                                                                                                                                  Assign Permissions eDiscovery Admin
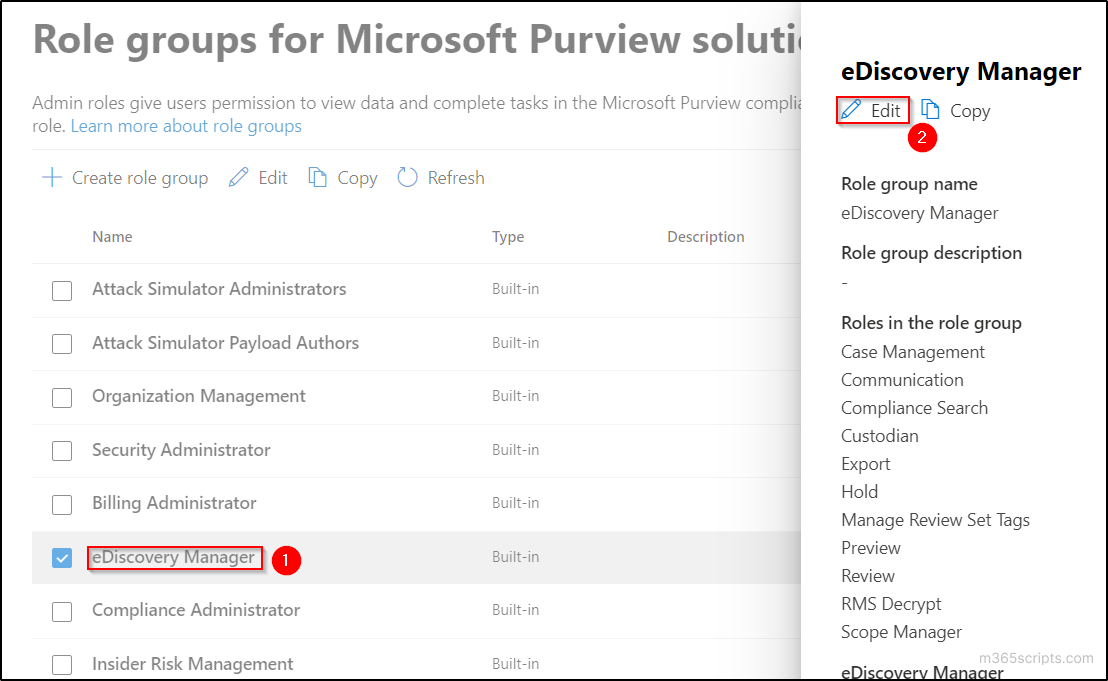
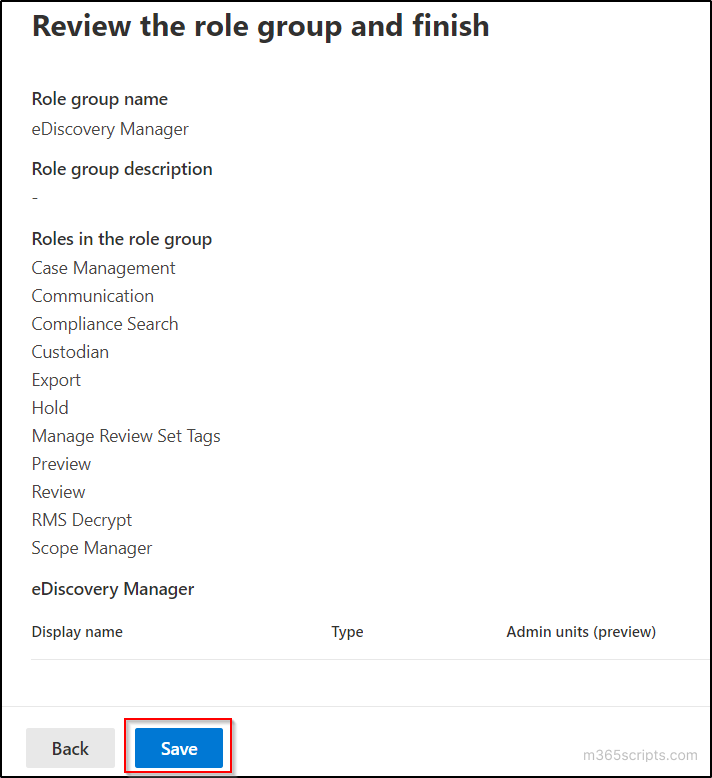
  4. Click on ‘eDiscovery Manager’ role and select ‘Edit’ option in the popup window.                                                                                                 eDiscovery Role Management
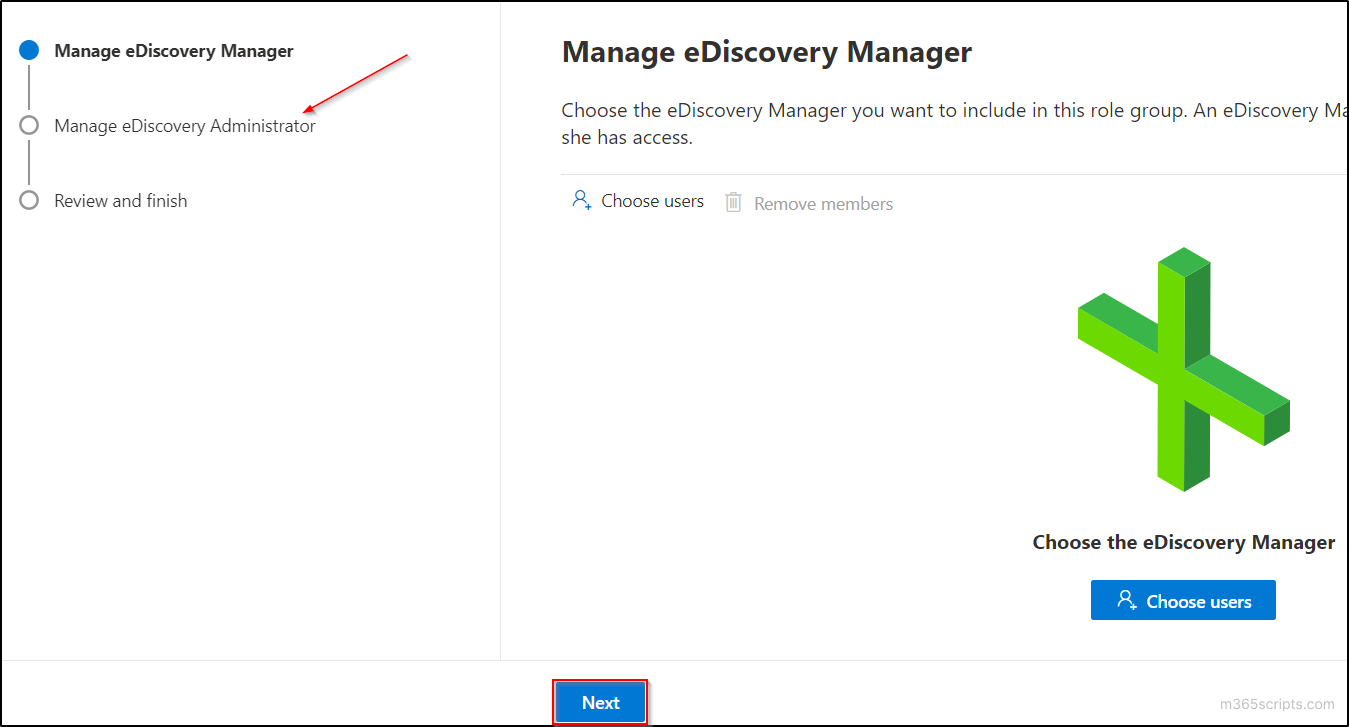
  5. Navigate to ‘Manage eDiscovery Administrator’ page by clicking on ‘Next’ button.                                                                                               Manage eDiscovery Manager
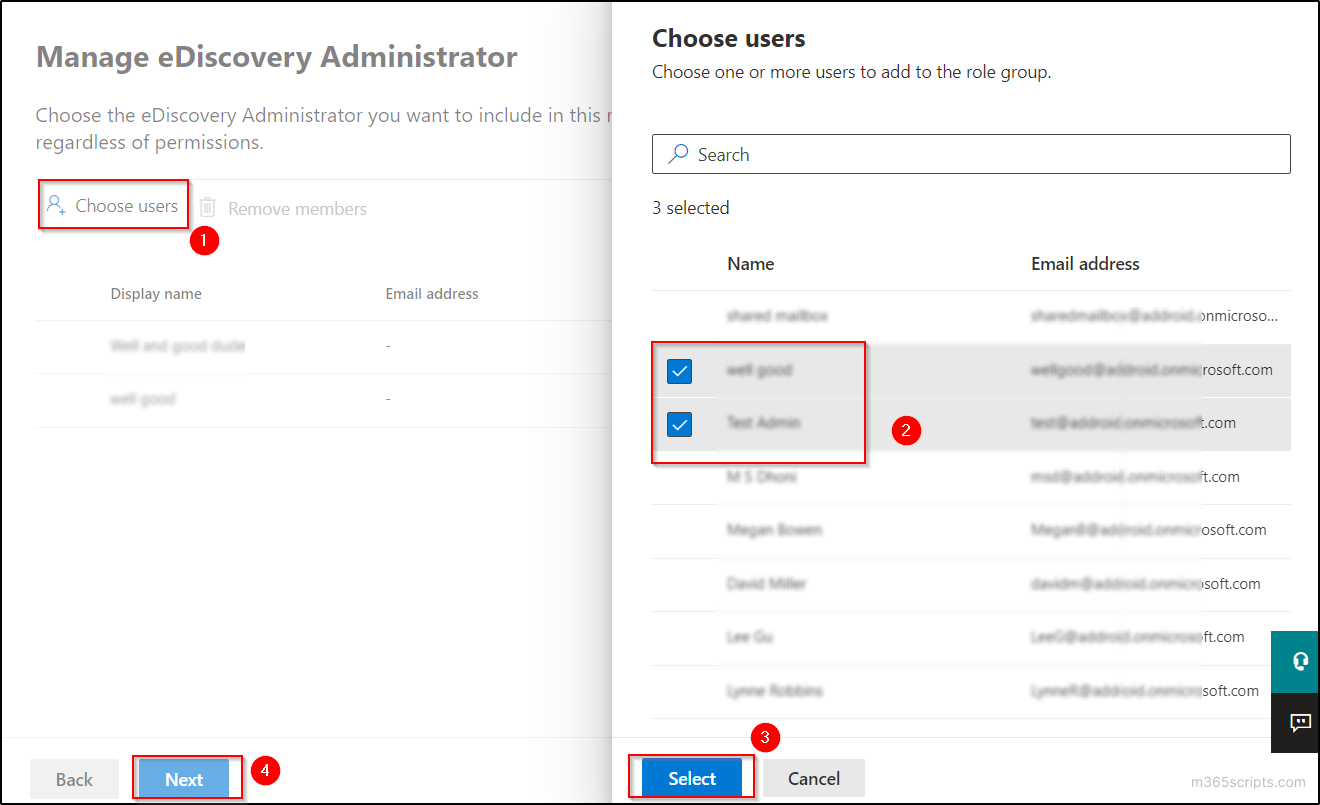
  6. Select ‘Choose users’ and select the user(s) who you want to make as eDiscovery admin. Then click on the ‘Select’ button in the popup and select ‘Next’ button.                                                                                                                                                                                           Manage eDiscovery Administrator
  7. Finally, click ‘Save’ on the ‘Review and finish’ page.                                                                                                                                                     eDiscovery Admin Review and Finish Page

In Office 365, before exporting a mailbox, it’s necessary to perform a content search that collects all the mail of the specified user(s) or all the contents of a mailbox. Once you complete the search, you can use the Export option to export the results to a PST file.

Note: An informational alert will trigger, and you will receive mail when an eDiscovery search started or exported. 

  1. Login to the Microsoft Purview compliance portal with the user account with which you have assigned an eDiscovery Administrator role.  
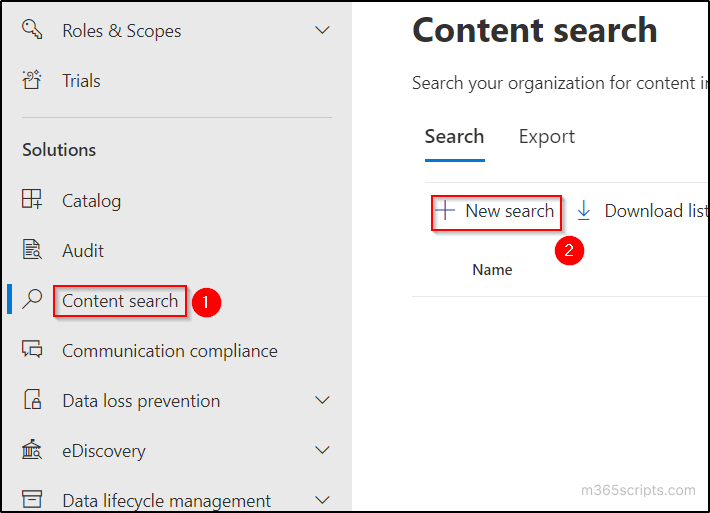
  2. Go to ‘Content search’ tab in the solutions menu and click on ‘New Search’ option.                                                                                      Content Search to Export Office365 Mailbox to PST
  3. Type the preferred name and description in the ‘Name and description’ page and click on ‘Next’.
  4. Turn ‘Exchange mailboxes’ on and click on ‘Choose users, groups, or Teams’ to select the users from the list.                                                                                                                                                                                                       Choose Users, Groups, or Teams for Content Search
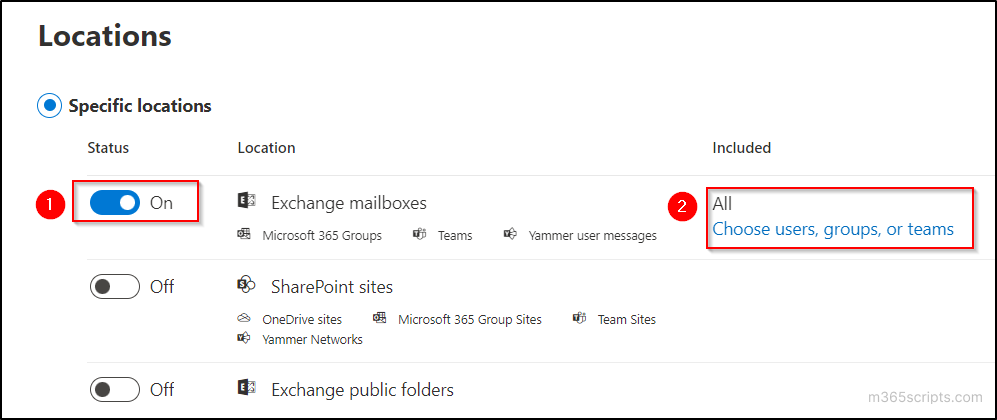
  5. Select the required users whose mailbox is to be exported or leave this option to export all user’s mailboxes and click on the ‘Next’ button. 
  6. Leave the conditions empty if you want to export the complete mailbox and click on ‘Next’. You can also define your conditions if you want filtered results.   
  7. Check the details in ‘Review your search’ page and click on ‘Submit’. 
  8. A message ‘New search created. Soon you will be able to review estimates and preview results for your search’ will show in the portal.
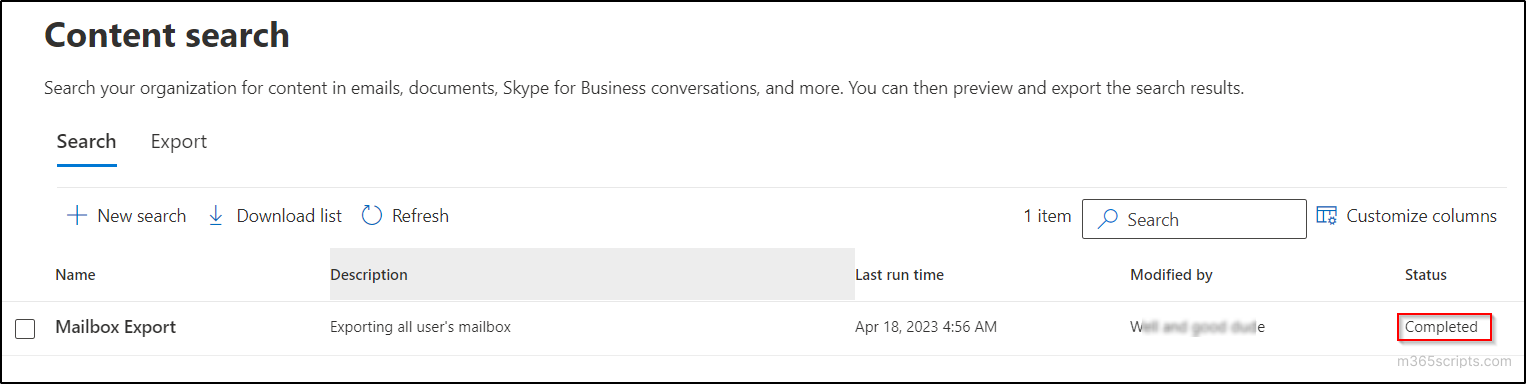
  9. Click on ‘Done’ and wait for the status to change to ‘Completed’ in the content search page.                                                                                                                                                                                                                                                                                             Content Search Status

Note: The waiting time may differ with respect to the size of the mailboxes you have performed a content search. 

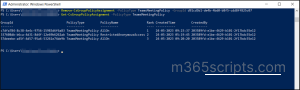
You can also perform Content search using the PowerShell with ‘New-ComplianceSearch cmdlet. First, connect to the compliance center ‘Connect-IPPSSession‘ cmdlet. 

Connect-IPPSSession

Now run the cmdlet below by providing the name for the content search and Exchange location that you want to do content search. 

New-ComplianceSearch <SearchName> -ExchangeLocation <UPN>| Start-ComplianceSearch

Export Office 365 Mailbox to PST 

Once you have successfully created a mailbox content search, the next step is to export the search results. To do this, simply follow the steps below, which will guide you through the process.  

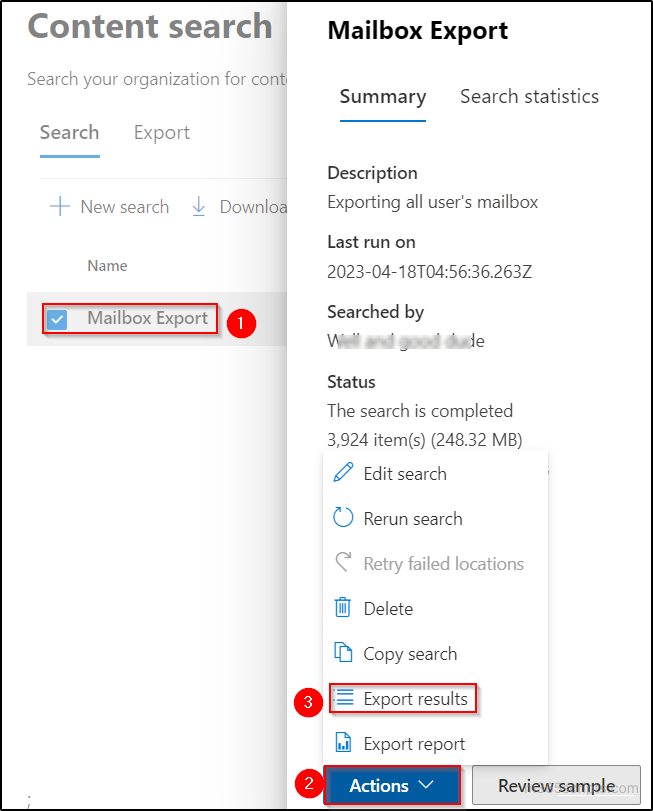
  1. Click on the content search ‘Mailbox Export’ that you have created in the previous steps. 
  2. Select ‘Actions’ and choose ‘Export results’.                                                                                                                                                                               Export Office 365 Mailbox to PST
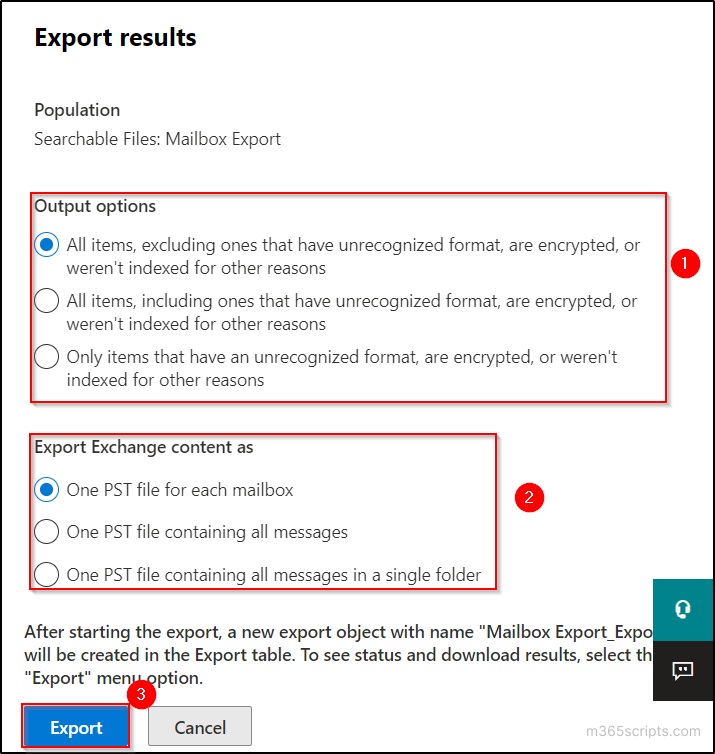
  3. Select the appropriate ‘Output options’ and the ‘Export Exchange Content as’ options. Then click on ‘Export’. If you are not sure about the options, leave it as default.                                                                                                                                                                        PST Export Results Options
  4.  A message box with a message “A job has been created” is displayed. Click on ‘OK’. It will take some time to complete the export. 

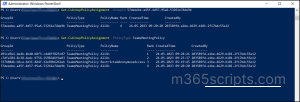
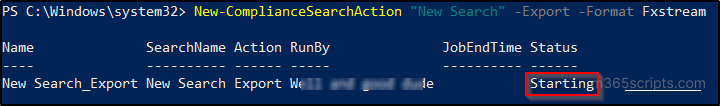
You can also perform export using the PowerShell with ‘New-ComplianceSearchAction cmdlet. 

Run the below cmdlet with the content search name to export the mailbox. 

New-ComplianceSearchAction <SearchName> -Export -Format Fxstream
Content Search Using PowerShell

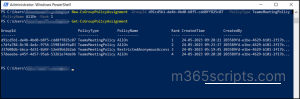
 You can also get the properties related to the export by using the following cmdlet. 

Get-ComplianceSearchAction "<SearchName>_export" -IncludeCredential | FL 

Download Exported PST File From Office 365 Mailbox  

With the help of Microsoft Office 365 eDiscovery Export Tool, you can download the exported mailbox results as a PST file. 

Note:  It’s important to note that this can only be done using the Microsoft Edge browser.

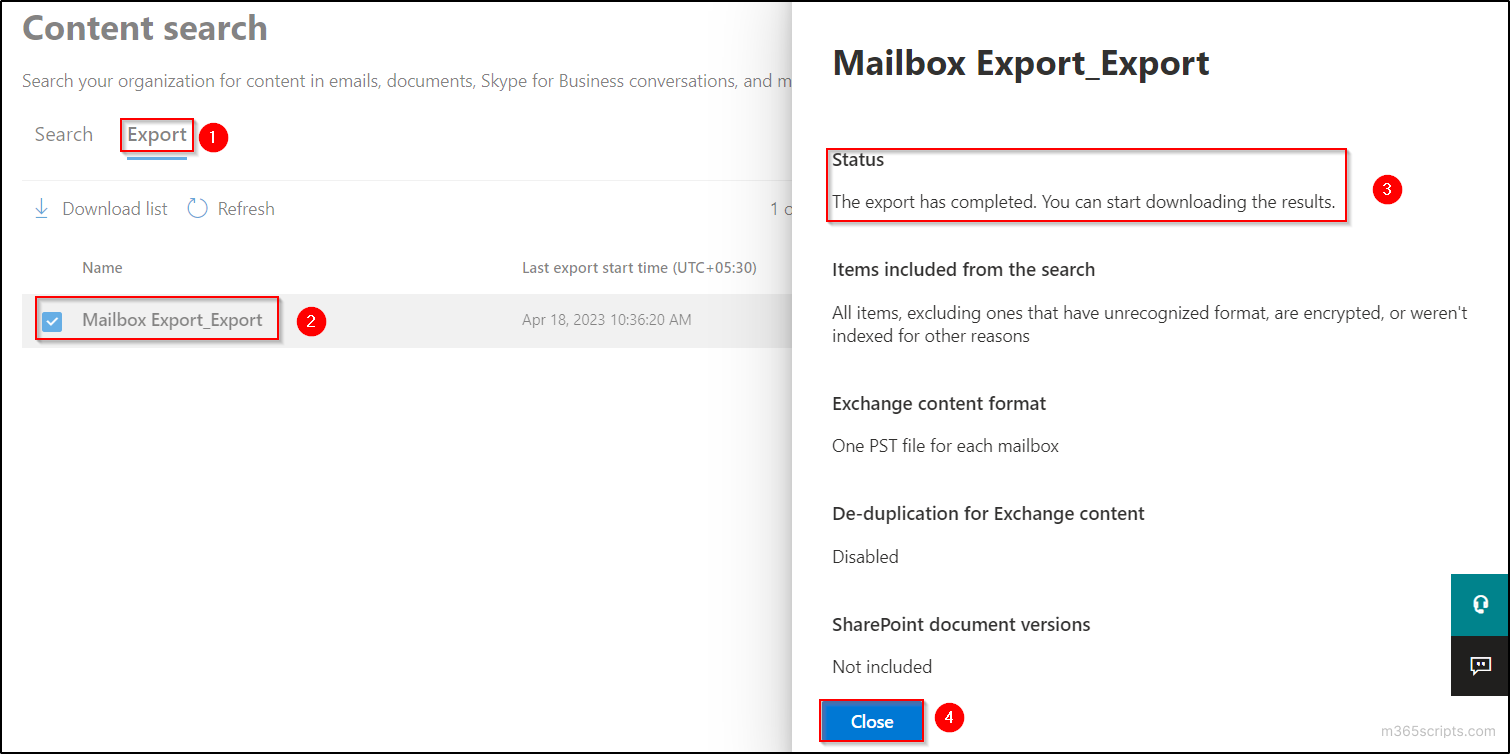
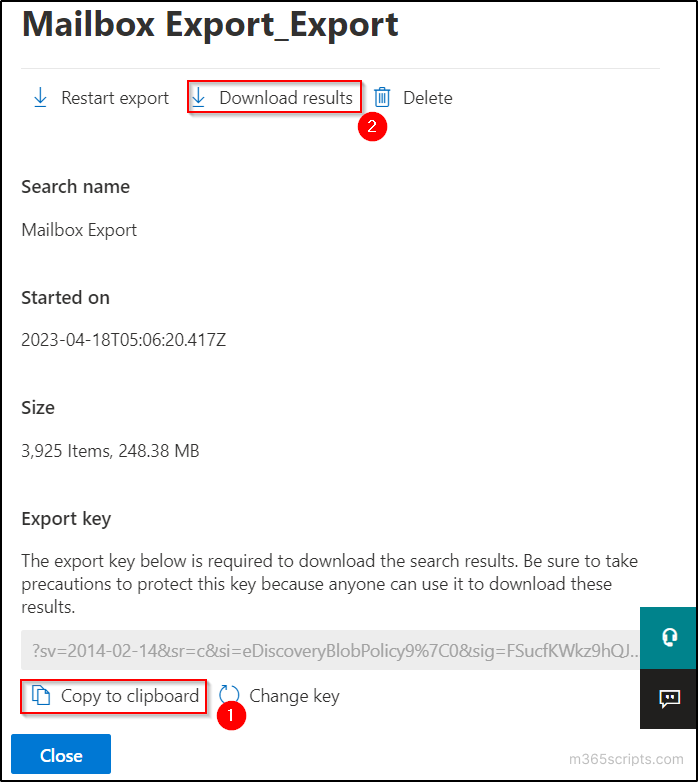
  1. Make sure that the status of the export is completed by clicking on the export job name in the ‘Export’ tab.                                                                                                                                                                                                                                                                  Mailbox Export Status Check
  2. Copy the ‘Export key’ by clicking on the ‘Copy to clipboard’ option and click on the ‘Download results’ option.                                                                                                                                                                                                                                                         Download Exported Results
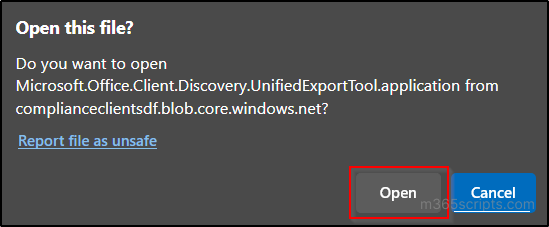
  3. If this is the first time you are downloading a .pst file, you are prompted to install Microsoft Office 365 eDiscovery Export Tool. If you have already installed, skip this step and go to the next step. 
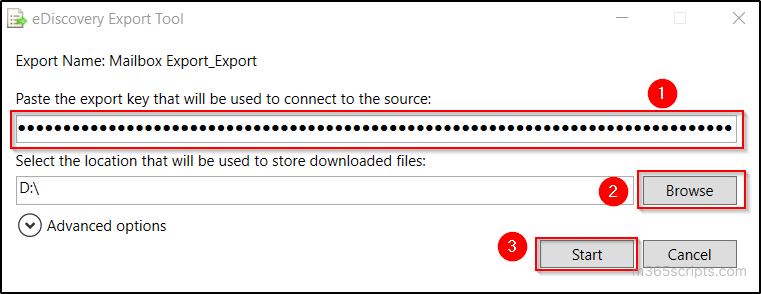
  4. Click ‘Open’ button in the upcoming popup and paste the export key.                                                                                                                    Permission to Open the Exported PST File
  5. Select the required location to store the download file by clicking on the ‘Browse’ button and click ‘Start’.                                                                                                                                                                                                                                                                                                  eDiscovery Export Tool
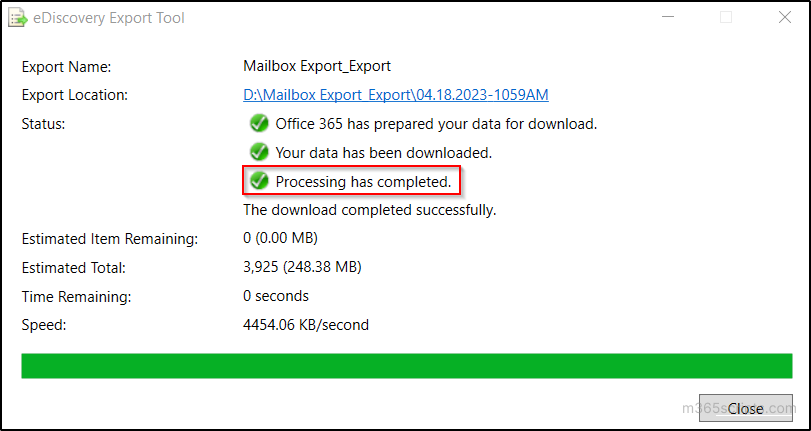
  6. You can be able to see the “Processing has completed” message after the download. Go to the specified location in your PC to view the downloaded PST file(s).                                                                                                                                                                                       Download Exported PST file from Office 365 Mailbox 

Office 365 Export PST File Size Limit 

When exporting PST files, the default file size limit is 10 GB. However, you have the ability to change this limit depending on your specific needs by increasing or decreasing the file size. Additionally, if the exported mailbox exceeds the PST size limit, the tool will automatically split the PST file into sequentially numbered files to accommodate the larger size.  

The main reason to do this is so PST files can fit on removable media, such a DVD, a compact disc, or a USB drive. You can adhere to the following steps to change the PST export file size limit. 

  • Before proceeding, make sure to check whether the eDiscovery Export tool is open, and if so, be sure to close it before continuing.
  • Type the following text in a notepad and save the following text to a filename suffix of .reg. For example, Pst.reg.   
Windows Registry Editor Version 5.00 
[HKEY_LOCAL_MACHINE\SOFTWARE\Microsoft\Exchange\Client\eDiscovery\ExportTool] 
"PstSizeLimitInBytes"="1073741824"

In the example above, the PstSizeLimitInBytes value is set to 1,073,741,824 bytes or approximately 1 GB. However, if you need to change this limit, you can easily do so by replacing the existing value with your desired limit in bytes.

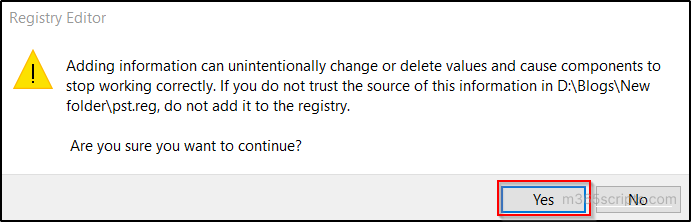
  • Once you have created the .reg file by following the previous steps, it’s time to open it and proceed with the next steps.
  • In the User Access Control window, choose ‘Yes’ to grant permission to the Registry Editor to make the change. 
  • When asked to confirm, select ‘Yes’.                                                                                                                                                                               
Registry entry

The Registry editor will then display a confirmation message indicating that the “keys and values was successfully added to the registry”. 

Limitations in Exporting PST File in Office 365 

When exporting an Office 365 mailbox to a PST file, it is important to be aware of the limitations involved. Here is a list of the limitations you may encounter during the export process.

  • Browser Restrictions: You need to use Microsoft Edge browser. It’s not possible to export mailboxes to PST using other browsers without any extensions. 
  • File Corruption Issues: Increasing the default size of PST files larger than 10 GB might have corruption issues. 
  • Mailbox count limitation: You cannot download more than 100,000 mailboxes for search results using the eDiscovery Export Tool. 
  • Export Data Size Constraint: An organization can export 2TB data per day through content search. 
  • Output Display Restriction: Only 1,000 exports or reports will be displayed in Content search. 

Thus, exporting Office 365 mailbox to PST is a simple process that can be done in a few clicks. You can have a clear understanding of how to complete this task efficiently by following the above steps. Feel free to leave a comment below if you encounter any difficulties or need any assistance.

Source :
https://m365scripts.com/microsoft365/a-step-by-step-guide-to-export-office-365-mailbox-to-pst/

Group Policy Assignments Using Microsoft Teams PowerShell

May 30, 2023 Shan

Unmanaged devices, external file-sharing, and email integration impose a big question mark on the security posture of Microsoft Teams. In order to secure and manage Microsoft Teams, policies are used under various sections like messaging, meetings, calling, conferencing, and many more. Usually, these Teams policies for users, groups, and batches are managed in the Microsoft Teams admin center or using the Teams PowerShell Module (TPM). But now Microsoft extends the managing capability of additional Office 365 group policies using the Teams PowerShell Module as per MC557818.    

According to this latest update, group policy assignments for Microsoft 365 groups, distribution lists, mail-enabled security groups, and security groups support additional policies in the Teams PowerShell Module. Apart from action control, policy assignments also set way for security controls like restricting anonymous access in meetings. 

Let us see how to assign group policies using Microsoft Teams PowerShell Module and their functionalities under this blog. 

What are Group Policy Assignments? 

As the name suggests, assigning a policy to a particular group of users is known as a group policy assignment. The groups can be managed in Microsoft 365 admin center whereas group policies can be managed under the single roof of the Teams PowerShell Module.  

Policy assignments are applied only to the direct members of a group and not to the nested group. That too, they are applied according to the precedence rules. And at the time of addition or deletion of users from a group, the policy assignments are updated which is also applicable when a policy is unassigned. Before jumping into group policy assignments, let us look through the precedence rules and ranking of policies.

What are Microsoft Teams Policy Precedence Rules?

Policy precedence determines the user’s effective policy when a user is assigned two or more of the same policy types. The precedence rules of policies are listed below for deeper insights into how an assigned policy will be deployed according to these rules. 

  • If a user is directly assigned a policy, the same type of policy can’t be inherited from the group. Therefore, the directly assigned policy takes precedence over the same policy type defined by the group. 
  • Also, if a user doesn’t contain a directly assigned policy, the user inherits the highest-ranking policy from the same type of policies applied by two or more groups. 
  • Finally, if the user is not assigned a policy directly or by group, then the global (organization-wide) policy takes precedence


The user policy is updated under the following circumstances. 

  • Especially when a user is added or removed from the policy assigned group. 
  • And when a group policy is unassigned.
  • At last, if a directly assigned policy is removed from a user.

What is Group Policy Assignment Rank in Teams?

As an admin, you are asked to define the rank of policy while assigning the policy. Primarily this ranking weighs the priority of the same type of policies assigned from two or more groups for a common user. Finally, the highest-ranking group policy is assigned as the effective policy to the end user after weighing the priority. Because a policy type can be assigned to a maximum number of 64 groups in Office 365.  

NOTE: If the rank value is undefined, then the lowest ranking is given to the policy assignment. 

How to Assign Policy to a Group in Teams Admin Center? 

Follow the below steps to configure group policies in the Teams admin center where it majorly supports Teams calling policy, Teams call park policy, Teams policy, Teams live events policy, Teams meeting policy, and Teams messaging policy. 

  1. Navigate using the path below.  

Microsoft Teams admin center 🡢 Messaging Policies (Select the desired policy type page) 🡢 Group policy assignment 🡢 Add group 🡢 Assign policy to group  

Group Policy Assignments in the Teams admin center

2. Then, select a group to which you want to assign a policy.
3. Set the ranking value for the group policy assignment through the select rank option. 
4. After that, select a policy from the available policy types in the drop-down list and click Apply

Unfortunately, all policy types can’t be managed under the Microsoft Teams admin center since it supports only certain policy types. Without a second thought, PowerShell is the go-to solution! Yes, managing policies using PowerShell is easy and efficient as it is the primary automation tool that ensures the deployment of objects in multiple tenants. Also, it is a place where error handling and logging are more flexible compared to the native admin center. Thus, let us deeply look through the next section of the blog to manage group policy assignments using Microsoft Teams PowerShell.  

Manage Group Policy Assignments Using Teams PowerShell Module 

As per the new update, Teams PowerShell Module now helps to manage group policies of Microsoft 365 groups, mail-enabled security groups, distribution lists, and security groups including Teams-related policies. Thus, create & manage groups in Microsoft 365 admin center and manage their policies in Teams PowerShell. Before getting started with PowerShell cmdlets, make sure to connect to the Teams PowerShell Module.  

  1. Assign Policy to Group Using Teams PowerShell Module 
  2. Get Group Policy Assignments Using MS Teams PowerShell 
  3. Remove Policy Assignment from a Group Using TPM 
  4. Modify Group Policy Assignment Using Teams PowerShell Module


Assign Policy to Group Using Teams PowerShell Module

By defining group policies, you can control user-specific actions like allowing them to schedule meetings, edit sent messages, etc. You can assign the available policies or create and assign custom policies depending on your requirements.
Execute the following cmdlet after replacing the unique group identifier, policy type, policy name, and expected rank to assign a new policy for a group.  

New-CsGroupPolicyAssignment -GroupId d8ebfa45-0f28-4d2d-9bcc-b158a49e2d17 -PolicyType TeamsMeetingPolicy -PolicyName AllOn -Rank 1 

This “New-CsGroupPolicyAssignment” cmdlet is basically used to create new policy assignments for security groups and distribution lists. In which the group ID, policy type, policy name, and rank must be mentioned as mandatory parameters. Here with the rank value as one, the ‘AllOn’ policy under TeamsMeetingPolicy type is created for the given group. 

The rank of the policy must be defined to determine the precedence. The recommended group membership size is 50,000 users per group while assigning a group policy. Also, it takes 24 hours or more to propagate the policy to all members of the larger groups.


Get Group Policy Assignments Using MS Teams PowerShell

Knowing all the available policy assignments allows you to understand the working conditions and their precedence levels better. Using this you can remove unnecessary policies, alter the desired ranking for policies and efficiently manage teams & groups around your Office environment. 

The “Get-CsGroupPolicyAssignment” cmdlet primarily returns all the group policy assignments with some optional parameters to filter the results.    

  1. Primarily, list all the policy-assigned groups by running the following command. 
Get-CsGroupPolicyAssignment 
Group Policy Assignments Using Microsoft Teams PowerShell

2. However, you can also retrieve all the policies assigned to a particular group using the below cmdlet. 

Get-CsGroupPolicyAssignment -GroupId e050ce51-54bc-45b7-b3e6-c00343d31274 

Here the cmdlet is mentioned with group ID so that retrieving only the policy assignments of that particular group. 

3.Also, you can list the groups based on their policy type by executing the below command.   

Get-CsGroupPolicyAssignment -PolicyType TeamsMeetingPolicy 

In this case, the policy type is mentioned as TeamsMeetingPolicy. Hence this cmdlet returns only the groups assigned with this policy.

Get Group Policy Assignments Using Microsoft Teams PowerShell Module


Remove Policy Assignment from a Group Using TPM

Remove the unnecessary policies found in your organization that are interrupting the ranking and slowing down the work progress. Most importantly, the removal of policies will update the ranking value of the same type policies where the policies in the list will be ranked consecutively after the removal. 

Run the following cmdlet to remove a specific group policy assignment in Microsoft 365 environment. 

Remove-CsGroupPolicyAssignment -PolicyType TeamsMeetingPolicy -GroupId f985e013-0826-40bb-8c94-e5f367076044 

The” Remove-CsGroupPolicyAssignment” cmdlet removes the given policy type in mentioned group ID.  

Remove Group Policy Assignment Using Teams PowerShell Module


Modify Group Policy Assignment Using Teams PowerShell Module

Directly altering the policy assignment ranking value is not possible in the Teams admin center. The policy assignments should be removed and newly assigned again with a new rank value to change the ranking. To take away this hassle, PowerShell lends you a hand with a simple and reusable cmdlet which is described below.   

Set-CsGroupPolicyAssignment -GroupId 566b8d39-5c5c-4aaa-bc07-4f36278a1b38 -PolicyType TeamsMeetingPolicy -PolicyName SupportCallPark -Rank 3 

The “Set-CsGroupPolicyAssignment” cmdlet can be used to make the following alterations in group policy assignments based on the given attributes. 

  1. Change policy assignment ranking. 
  2. Change the policy under the existing policy type. 
  3. Change policy assignment ranking value and policy of a given policy type. 

In this example, the policy is changed to ‘SupportCallPark’ policy, and the rank value is assigned to 3. 

NOTE: The “Set-CsGroupPolicyAssignment” cmdlet is currently not released for use. So, for now, you need to remove policies and add new policies to change the policy or ranking. But you can easily alter the policy settings once after the availability of this cmdlet.
 

New Group Policy Assignment Support in Teams PowerShell Module 

Microsoft rolls out group policy assignment support for additional policies in Teams PowerShell Module as a new update. So that admins can manage their groups in the M365 admin center and group policies in Teams PowerShell with a breeze. This feature will allow you to configure custom policies to groups for all Microsoft commercial licenses. With this update, dependency on global or direct policy assignments through manual methods is eliminated. In addition to the core policies such as meeting policies, calling policies, and messaging policies, the following policies are now expected to be available in Teams PowerShell by late May 2023.    

  • Application Access Policy 
  • Call Hold Policy 
  • Carrier Emergency Call Routing Policy 
  • Cortana Policy 
  • Dial Out Policy 
  • Education Assignments App Policy 
  • Emergency Calling Policy 
  • Enhanced Encryption Policy 
  • Events Policy 
  • External Access Policy 
  • Feedback Policy 
  • Files Policy 
  • IPPhone Policy 
  • Media Logging Policy 
  • Meeting Branding Policy 
  • Meeting Template Permission Policy 
  • Mobility Policy 
  • Notification And Feeds Policy 
  • Room Video Tele Conferencing Policy 
  • Synthetic Automated Call Policy 
  • Teams Branch Survivability Policy 
  • Template Permission Policy 
  •  VDI Policy 
  • Video Interop Service Policy 
  • Voice Routing Policy 
  • Voicemail Policy 

In conclusion, ultimately manage all group policies including Teams using PowerShell cmdlets. Take charge of the user-specific actions and security controls through this group policy assignment. Not only policies, you can also manage your Teams using PowerShell for effective administration. Rather than performing numerous repetitive tasks in the Teams admin center, automate them with just a few cmdlets in PowerShell.  

I hope that this blog provides you with deeper insights into group policy assignments using Teams PowerShell. For any clarifications feel free to reach us through comments. 

Source :
https://m365scripts.com/microsoft365/group-policy-assignments-using-microsoft-teams-powershell/

8 Best Network Scanning Tools & Software for 2023

BY KIHARA KIMACHIA
MAY 30, 2023

Network scanning tools are a critical investment for businesses in this era of increasing cyber threats. These tools perform an active examination of networks to identify potential security risks and help IT administrators maintain the health and security of their networks.

As businesses become more digital and interconnected, the demand for such tools has significantly increased. To help businesses sort through the plethora of these solutions available on the market, we’ve narrowed down the list to eight top products and their ideal use cases.

Here are our picks for the top network scanning software:

Top network scanning tools and software comparison

Vulnerability ScanningReal-time Network MonitoringPenetration TestingCompliance AssuranceIntegration with Other ToolsEase of UseRange of Vulnerabilities DetectedScalabilityPricing (Starting)
Burp SuiteModerateHighHigh$1,999/yr
DetectifyHighModerateHigh$89/mo.
IntruderHighHighHigh$160/mo.
Manage Engine OpManagerModerateModerateHigh$245
Tenable NessusHighHighHigh$4,990/yr
Pentest ToolsModerateHighModerate$72/mo.
Qualys VMDRModerateHighHigh$6,368/yr
SolarWinds ipMonitorHighModerateHigh$1,570/yr

Jump to:

Burp Suite

Best for comprehensive web vulnerability scanning

PortSwigger BurpSuite dashboard
Source: portswigger.net

Burp Suite is a trusted tool among IT professionals for its robust web vulnerability scanning capabilities. It identifies security holes in web applications and is particularly well-suited for testing complex applications.

Pricing

The vendor has three enterprise pricing options as follows:

  • Pay as you scan: This tier starts at $1,999 per year plus $9 per hour scanned. It includes unlimited applications and users.
  • Classic: This tier is priced at $17,380 per year and includes 20 concurrent scans, unlimited applications and unlimited users.
  • Unlimited: This is the superior plan and is priced at $49,999 per year. It includes unlimited concurrent scans, applications, and users.

Features

  • Out-of-band Application Security Testing (OAST) added to dynamic scans for accurate identification of vulnerabilities.
  • Easy setup with point-and-click scanning or trigger via CI/CD.
  • Recurring scanning options for daily, weekly, or monthly scans.
  • Out-of-the-box configurations for fast crawl or critical vulnerability audits.
  • API security testing for increased coverage of microservices.
  • JavaScript scanning to uncover more attack surfaces in Single Page Applications (SPAs).
  • Scalable scanning with the ability to adjust the number of concurrent scans.
  • Custom configurations available, including crawl maximum link depth and reported vulnerabilities.
  • Burp Scanner, a trusted dynamic web vulnerability scanner used by over 16,000 organizations.
  • Integration with major CI/CD platforms such as Jenkins and TeamCity.
  • API-driven workflow for initiating scans and obtaining results via the REST API.
  • Integration with vulnerability management platforms for seamless scanning and security reporting.
  • Burp extensions allow customization of Burp Scanner to meet specific requirements.
  • Multiple deployment options including interactive installer and Kubernetes deployment.
  • Integration with bug tracking systems like Jira with auto ticket generation and severity triggers.
  • GraphQL API for initiating, scheduling, canceling, and updating scans.
  • Role-based access control for multi-user functionality and control.
  • Compatible configurations from Burp Suite Pro can be manually integrated into the Enterprise environment.
  • Reporting features include graphical dashboards, customizable HTML reports, scan history metrics, intuitive UI, rich email reporting, security posture graphing, aggregated issue reporting, and compliance reporting for PCI DSS and OWASP Top 10.

Pros

  • Extensive vulnerability detection.
  • Can handle complex web applications.
  • Integration with popular CI/CD tools.

Cons

  • Steep learning curve for beginners.
  • Relatively higher pricing.

Detectify

Best for ease of use and automation

Detectify dashboard
Source: detectify.com

Detectify is a fully automated External Attack Surface Management (EASM) solution powered by a world-leading ethical hacker community. It can help map out a company’s security landscape and find vulnerabilities that other scanners may miss​.

Pricing

The vendor has several pricing options as follows:

  • The full EASM package comes with a 2-week free trial. Pricing is custom and based on the number of domains, sub-domains, and web applications of the attack surface.
  • For organizations with a small attack surface, the vendor offers two pricing tiers that also come with a free 2-week trial:
    • Surface Monitoring: Pricing starts from $289 per month (billed annually). This package includes up to 25 subdomains.
    • Application Scanning: Pricing starts from $89 per month per scan profile (billed annually).

Features

The features of the full EASM solution are:

  • Continuous 24/7 coverage for discovering and monitoring your modern tech stack.
  • Crawling and fuzzing engine that surpasses traditional DAST scanners.
  • Ability to monitor large enterprise products and protect sensitive organizational data.
  • Accurate results with 99.7% accuracy in vulnerability assessments through payload-based testing.
  • SSO, API access, automatic domain verification, custom modules, and attack surface custom policies.
  • Identify risks before they are exploited by enriching assets with critical information like open ports, DNS record types, and technologies.
  • Integrates with popular tools such as Slack, Jira, and Splunk, and comes with an API that allows users to export results in the manner that best suits their workflows.

Pros

  • Simple and clean interface, easy to use.
  • Continuous automatic updates and scans.
  • Customizable reports and notifications.

Cons

  • Limited manual testing capabilities.
  • May generate false positives.

Intruder

Best for cloud-based network security

Intruder dashboard
Source: intruder.io

Intruder is a powerful cloud-based network security tool that helps businesses prevent security breaches by automating routine security checks. Each threat found is classified according to severity and a remediation plan proposed.

Pricing

  • Pricing is based on the number of applications and infrastructure targets with three pricing tiers: Essential, Pro and Premium. The Pro plan comes with a 14-day free trial.
  • Example pricing for 1 application and 1 infrastructure target is as follows:
    • Essential: $160 per month, billed annually.
    • Pro: $227 per month, billed annually.
    • Premium: From $3,737 per year.

Features

  • Easy-to-use yet powerful online vulnerability tool.
  • Comprehensive risk monitoring across your stack, including publicly and privately accessible servers, cloud systems, websites, and endpoint devices.
  • Detection of vulnerabilities such as misconfigurations, missing patches, encryption weaknesses, and application bugs, including SQL injection, Cross-Site Scripting, and OWASP Top 10.
  • Ongoing attack surface monitoring with automatic scanning for new threats and alerts for changes in exposed ports and services.
  • Intelligent results that prioritize actionable findings based on context, allowing you to focus on critical issues like exposed databases.
  • Compliance and reporting with high-quality reports to facilitate customer security questionnaires and compliance audits such as SOC2, ISO27001, and Cyber Essentials.
  • Continuous penetration testing by security professionals to enhance coverage, reduce the time from vulnerability discovery to remediation, and benefit from vulnerability triage by certified penetration testers.
  • Seamless integration with your technical environment, with no lengthy installations or complex configurations required.

Pros

  • Cloud-based, eliminating the need for on-site servers.
  • Comprehensive vulnerability coverage.
  • Automated, regular security checks.

Cons

  • Dependency on automated scanning engines may result in occasional false positives or false negatives.

ManageEngine OpManager

Best for real-time network monitoring

ManageEngine OpManager dashboard
Source:manageengine.com

ManageEngine OpManager is a comprehensive network monitoring application, capable of providing intricate insights into the functionality of various devices such as routers, switches, firewalls, load balancers, wireless LAN controllers, servers, virtual machines, printers, and storage systems. This software facilitates in-depth problem analysis to identify and address the core source of network-related issues.

Pricing

The vendor offers three editions with starting prices as follows:

  • Standard: $245 for up to 10 devices.
  • Professional: $345 for up to 10 devices.
  • Enterprise: $11,545 for 250 up to 250 devices.

Features

  • Capable of monitoring networks using over 2,000 performance metrics, equipped with user-friendly dashboards, immediate alert systems, and intelligent reporting features.
  • Provides crucial router performance data including error and discard rates, voltage, temperature, and buffer statistics.
  • Enables port-specific traffic control and switch port mapping for device identification.
  • Continuous monitoring of WAN link performance, latency, and availability, leveraging Cisco IP SLA technology.
  • Active monitoring of VoIP call quality across WAN infrastructure, facilitating the troubleshooting of subpar VoIP performance.
  • Automatic generation of L1/L2 network mapping, aiding in the visualization and identification of network outages and performance issues.
  • Provides monitoring for both physical and virtual servers across various operating systems such as Windows, Linux, Solaris, Unix, and VMware.
  • Detailed, agentless monitoring of VMware-virtualized servers with over 70 VMware performance monitors.
  • Utilizes WMI credentials to monitor Microsoft Hyper-V hosts and guest performance with over 40 in-depth metrics.
  • Enables monitoring and management of Host, VMs, and Storage Repositories of Citrix Hypervisor, providing the necessary visibility into their performance.
  • Allows for monitoring and management of processes running on discovered devices through SNMP/WMI/CLI.
  • Uses protocols like SNMP, WMI, or CLI for monitoring system resources and gathering performance data.
  • Provides immediate notifications on network issues via email and SMS alerts.
  • Facilitates the orchestration and automation of initial network fault troubleshooting steps and maintenance tasks.
  • Provides a centralized platform for identifying network faults, allowing for visualization, analysis, and correlation of multiple monitor performances at any instant.
  • Enables network availability, usage trend, and performance analysis with over 100 ready-made and customizable reports.
  • Employs a rule-based approach for syslog monitoring to read incoming syslogs and assign alerts.
  • Includes a suite of OpManager’s network monitoring tools to assist in first and second-level troubleshooting tasks.

Pros

  • In-depth network monitoring.
  • Easy-to-understand performance dashboards.
  • Supports both physical and virtual servers.

Cons

  • May be complex for beginners.
  • Cost can quickly escalate based on number of devices.

Tenable Nessus

Best for vulnerability analysis

Tenable Nessus dashboard
Source: tenable.com

Tenable Nessus is a vulnerability assessment tool that enables organizations to actively detect and rectify vulnerabilities throughout their ever-evolving attack surface. It is formulated to evaluate contemporary attack surfaces, expanding beyond conventional IT assets to ensure the security of cloud infrastructure and provide insights into internet-connected attack surfaces.

Pricing

  • Nessus offers a free 7-day trial. Customers can scan up to 32 IPs per scanner during the trial period.
  • After the trial, the product is available at a starting fee of $4,990 per year for an unlimited number of IPs per scanner.
  • Nessus Enterprise pricing is dependent on business requirements.

Features

  • Evaluates contemporary attack surfaces, extends beyond conventional IT assets, and provides insights into internet-connected environments.
  • Built with an understanding of security practitioners’ work, aiming to make vulnerability assessment simple, intuitive, and efficient.
  • Provides a reporting feature that prioritizes the top ten significant issues.
  • Nessus is deployable on a range of platforms, including Raspberry Pi, emphasizing portability and adaptability.
  • Ensures precise and efficient vulnerability assessment.
  • Offers visibility into your internet-connected attack environments.
  • Ensures the security of cloud infrastructure before deployment.
  • Focuses on the most significant threats to enhance security efficiency.
  • Provides ready-to-use policies and templates to streamline vulnerability assessment.
  • Allows for customization of reports and troubleshooting procedures.
  • Provides real-time results for immediate response and rectification.
  • Designed for straightforward and user-friendly operation.
  • Provides an organized view of vulnerability assessment findings for easy interpretation and analysis.

Pros

  • Broad vulnerability coverage.
  • Easy integration with existing security systems.
  • User-friendly interface.

Cons

  • Relatively higher pricing.

Pentest Tools

Best for penetration testing

Pentest Tools dashboard
Source: pentest-tools.com

Pentest Tools is a suite of software designed to assist with penetration testing. Pentest Tools provides the necessary capabilities to effectively carry out penetration tests, offering insights into potential weak points that may be exploited by malicious actors.

Pricing

The vendor offers four pricing plans as follows:

  • Basic: $72 per month, billed annually, for up to 5 assets and up to 2 parallel scans.
  • Advanced: $162 per month, billed annually, for up to 50 assets and up to 5 parallel scans.
  • Teams: $336 per month, billed annually, for up to 500 assets and up to 10 parallel scans.
  • Enterprise: For more than 500 assets and more than 10 parallel scans, plan pricing varies.

Features

  • Initially built on OpenVAS, now includes proprietary technology to assess network perimeter and evaluate a company’s external security posture.
  • Uses proprietary modules, like Sniper: Auto Exploiter, for a comprehensive security scan.
  • Provides a simplified and intuitive interface for immediate scanning.
  • Conducts in-depth network vulnerability scans using over 57,000 OpenVAS plugins and custom modules for critical CVEs.
  • Includes a summarized report of vulnerabilities found, their risk rating, and CVSS score.
  • Each report offers recommendations for mitigating detected security flaws.
  • Prioritizes vulnerabilities based on risk rating to optimize manual work and time.
  • Generates customizable reports with ready-to-use or custom templates.
  • Provides a complete view of “low hanging fruit” vulnerabilities, enabling focus on more advanced tests.
  • Allows testing of internal networks through a ready-to-use VPN, eliminating the need for time-consuming scripts and configurations.
  • Identifies high-risk vulnerabilities such as Log4Shell, ProxyShell, ProxyLogon, and others.
  • Assists in running vulnerability assessments necessary to comply with various standards like PCI DSS, SOC II, HIPAA, GDPR, ISO, the NIS Directive, and others.
  • Facilitates thorough infrastructure tests, detecting vulnerabilities ranging from weak passwords to missing security patches and misconfigured web servers.
  • Third-party infrastructure audit that’s useful for IT services or IT security companies, providing reports for client assurance on implemented security measures.

Pros

  • Broad coverage of penetration testing scenarios.
  • Easy to use, with detailed reports.
  • Regular updates and enhancements.

Cons

  • Proprietary technology can also limit interoperability with other tools or platforms.
  • New users may experience a steep learning curve.

Qualys VMDR

Best for cloud security compliance

Qualys VMDR dashboard
Source: qualys.com

Qualys VMDR is a top choice for businesses looking for cloud-based network security software. It provides automated cloud security and compliance solutions, allowing businesses to identify and fix vulnerabilities.

Pricing

  • Prospective customers can try out the tool for free for 30 days.
  • Pricing starts at $199 per asset with a minimum quantity of 32 (i.e., $6,368 total starting cost).
  • Flexible pricing for larger packages based on business needs.

Features

  • Qualys is a strong solution for businesses seeking cloud-based network security software, providing automated cloud security and compliance solutions.
  • Utilizes TruRisk™ to quantify risk across vulnerabilities, assets, and asset groups, enabling proactive mitigation and risk reduction tracking.
  • Automates operational tasks for vulnerability management and patching with Qualys Flow, saving valuable time.
  • Leverages insights from over 180,000 vulnerabilities and 25+ threat sources to provide preemptive alerts on potential attacks with the Qualys Threat DB.
  • Detects all IT, OT, and IoT assets for a comprehensive, categorized inventory with detailed information such as vendor lifecycle.
  • Automatically identifies vulnerabilities and critical misconfigurations per Center for Internet Security (CIS) benchmarks, by asset.
  • Integrates with ITSM tools like ServiceNow and Jira to automatically assign tickets and enable orchestration of remediation, reducing Mean Time To Resolution (MTTR).

Pros

  • Cloud-based, reducing on-premise hardware needs.
  • Comprehensive vulnerability and compliance coverage.
  • Powerful data analytics capabilities.

Cons

  • Can be complex for small businesses.
  • Pricing is high and can be prohibitive for smaller organizations.

SolarWinds ipMonitor

Best for large-scale enterprise networks

SolarWinds ipMonitor dashboard
Source:solarwinds.com

SolarWinds ipMonitor is an established network monitoring solution ideal for monitoring servers, VMware hosts, and applications on large-scale enterprise networks. It offers deep performance insights and customizable reports.

Pricing

SolarWinds ipMonitor has three pricing editions, each with a 14-day free trial: 

  • 500 monitors for $1,570
  • 1000 monitors for $2,620
  • 2500 monitors for $5,770

Features

  • The monitoring tool provides over a dozen notification types including alerts via email, text message, or directly to Windows Event Log files.
  • Facilitates the monitoring of common ports with key protocols.
  • Ensures IT environment functionality by continuously monitoring database availability.
  • Enhances end user network experience monitoring capabilities.
  • Offers monitoring of network equipment health in tandem with network infrastructure.
  • Confirms the ability of a web server to accept incoming sessions.
  • Provides critical insights into the overall IT environment.
  • Offers an affordable tool for network monitoring.
  • Utilizes VM ESXi host monitors to track the health and performance of your virtual environment.
  • Enables monitoring of Windows services and applications..

Pros

  • Extensive scalability for large networks.
  • Deep insights and comprehensive reporting.
  • Wide range of integrated applications.

Cons

  • Can be overly complex for smaller networks.
  • The pricing model may not suit smaller businesses.

Key features of network scanning tools and software

Vulnerability scanning is central to all network scanning tools, but other features, such as real-time monitoring, penetration testing, and integrability, should not be overlooked.

Vulnerability scanning

This is the most critical feature buyers typically look for in network scanning tools. Vulnerability scanning helps identify potential security threats and weak spots within the network. 

The tools do this by scanning the network’s devices, servers, and systems for known vulnerabilities such as outdated software, open ports, or incorrect configurations. 

This feature matters because it provides an overview of the network’s security posture, enabling users to take corrective measures promptly.

Real-time network monitoring

Real-time network monitoring allows for continuous observation of the network’s performance, detecting any issues or anomalies as they occur. 

This feature is vital because it can significantly reduce downtime and address performance issues before they impact business operations.

Penetration testing

Penetration testing (or pentesting) simulates cyberattacks on your network to test the effectiveness of your security measures and identify potential vulnerabilities that may not be detectable through standard vulnerability scanning. 

Penetration testing is essential for businesses as it offers a more proactive approach to cybersecurity than standard vulnerability scans.

Compliance assurance

Compliance assurance ensures that the organization’s network aligns with various regulatory standards, such as HIPAA for healthcare or PCI DSS for businesses that handle credit card information.

Compliance assurance is critical because non-compliance can result in hefty fines and damage to the company’s reputation.

Integration with other tools

Integration capabilities are an often overlooked but essential feature of network scanning tools. The ability to integrate with other IT management and security tools allows for a more streamlined and efficient workflow.

For example, integrating a network scanning tool with a ticketing system could automatically create a ticket when a vulnerability is detected.

This feature is vital as it enables businesses to enhance their overall IT infrastructure management and improve response times to potential threats.

How to choose the best network scanning software for your business

Selecting the best network scanning tool for your business involves several key considerations:

  1. Identify your needs: The first step is to understand what you need from a network scanning tool. Do you require real-time network monitoring, pentesting, compliance assurance, or more? The type of network you’re operating and the size of your business can heavily influence your needs.
  2. Consider the ease of use: The usability of the software is an important factor depending on the size and expertise of your IT team. If it’s too complex, it may be challenging for your team to use effectively. Look for software that has a user-friendly interface and offers good customer support.
  3. Examine the features: Look for software that offers the features that match your specific requirements. If you’re unsure what features you might need, consulting with an IT professional can be beneficial.
  4. Evaluate scalability: Your business is likely to grow, and so will your network. The network scanning tool you choose should be able to scale along with your business without losing efficiency.
  5. Check for regular support and updates: Good network scanning software should provide reliable support and regular updates to address emerging security threats. Check whether the software is frequently updated and if technical support is readily available.
  6. Review pricing: Lastly, consider the pricing and your budget. Keep in mind that while some software might be more expensive, it could offer more features or better support, leading to better value for your business in the long run.

Frequently Asked Questions (FAQs)

What are the benefits of network scanning tools?

Network scanning tools offer a multitude of benefits, including:

  • Security enhancement: Network scanning tools identify vulnerabilities and security risks within a network, allowing businesses to address these issues proactively and bolster their security posture.
  • Compliance assurance: Many of these tools help ensure that your network aligns with various regulatory and industry standards, reducing the risk of non-compliance penalties.
  • Real-time monitoring: By providing real-time network monitoring, these tools allow for immediate detection and mitigation of issues, thereby reducing network downtime and improving performance.
  • Resource optimization: Network scanning can identify underutilized resources, aiding in more efficient resource allocation and cost savings.
  • Improved network management: With a thorough understanding of the network infrastructure, administrators can make more informed decisions regarding network planning and expansion.

Who should use network scanning software?

Network scanning software is beneficial for a variety of roles and industries, including:

  • Network administrators: These professionals can use network scanning tools to monitor and manage the health of the network, consistently optimizing its performance.
  • IT security professionals: These tools are crucial for IT security staff in identifying potential vulnerabilities and mitigating security risks.
  • Managed Service Providers (MSPs): MSPs can utilize network scanning tools to manage and monitor their clients’ networks, ensuring they are secure and comply with relevant regulations.
  • Regulated industries: Businesses within industries that must adhere to strict data security standards, such as healthcare, finance, and e-commerce, can benefit significantly from these tools to ensure compliance and protect sensitive data.

What are the types of network scanning?

Network scanning can be categorized into several types based on their function:

  • Port scanning: This type identifies open ports and services available on a network host. It can help detect potential security vulnerabilities.
  • Vulnerability scanning: This process involves identifying known vulnerabilities in the network, such as outdated software or misconfigurations, that could be exploited.
  • Network mapping: This type of scanning identifies the various devices on a network, their interconnections, and topology.
  • Performance scanning: This form of scanning monitors network performance, identifying potential issues that could affect the speed or reliability of the network.
  • Compliance scanning: This type checks the network’s compliance with certain regulatory or industry standards, helping avoid potential legal issues.

Methodology

The selection, review, and ranking of the network scanning tools in this list was carried out through a comprehensive and structured methodology, which involved several key steps: namely, requirement identification, market research, feature evaluation, user reviews and feedback, ease of use, pricing, and scalability.

By combining these steps, we have aimed to provide a balanced and comprehensive overview of the top network scanning tools of 2023, thereby enabling potential buyers to make an informed decision that best suits their specific needs and circumstances.

Bottom line: Managing vulnerabilities with network scanning tools

Network scanning tools are essential for any organization striving to maintain a secure and efficient IT environment. From identifying vulnerabilities to ensuring compliance and enhancing overall network performance, these tools play a pivotal role in successful network management.

The eight tools discussed in this article offer a variety of features and capabilities, catering to different needs and business sizes. However, choosing the right tool should be guided by an organization’s unique requirements, budget, and the tool’s ability to scale alongside the growth of the business.

By doing so, businesses can foster a more secure, compliant, and reliable IT network, boosting operational efficiency and business resilience.

Knowing your network’s vulnerabilities is just the beginning. Here are the best vulnerability management tools to keep your data locked up safe.

Source :
https://www.enterprisenetworkingplanet.com/security/network-scanning-tools/

Top 20 Open Source Cyber Security Monitoring Tools in 2023

As cyber threats continue to evolve, security professionals require reliable tools to defend against security vulnerabilities, protect sensitive data, and maintain network security. Open source cyber security tools provide a cost-effective solution for individuals and organizations to combat these threats on-premises and with cloud security and mobile devices. Let’s consider the top 25 open-source cyber security monitoring tools in 2023 that help ensure continuous network and system performance monitoring.

Table of contents

What are the Top Cybersecurity Threats Today?

As cyber threats continue to evolve and become more sophisticated, organizations must stay informed and prepared to defend against a wide range of security risks.

Here are the top cybersecurity threats that businesses and individuals should be aware of today:

1. Phishing Attacks: Phishing attacks are a prevalent form of social engineering where cybercriminals use deceptive emails or websites to trick users into revealing sensitive information or installing malware. These attacks often target login credentials, financial information, and other personal data.

Altaro VM Backup

2. Ransomware: Ransomware is a type of malicious software that encrypts a victim’s files or locks their systems, demanding a ransom payment to restore access. Ransomware attacks can cause significant financial losses and operational disruptions for organizations.

3. Insider Threats: Insider threats refer to security risks posed by employees, contractors, or other individuals with authorized access to an organization’s systems and data. These threats can result from malicious intent or negligence, leading to data breaches or system compromises.

4. Supply Chain Attacks: Also known as third-party attacks or vendor risk, supply chain attacks target an organization’s suppliers, vendors, or partners to gain access to their systems and data. These attacks often exploit security vulnerabilities in the supply chain to compromise multiple organizations.

5. Distributed Denial of Service (DDoS) Attacks: DDoS attacks involve overwhelming a target’s network or system with a flood of traffic, rendering it inaccessible to legitimate users. DDoS attacks can cause severe downtime and service disruptions.

6. Advanced Persistent Threats (APTs): APTs are sophisticated, coordinated cyberattacks by well-funded threat actors or nation-state groups that target specific organizations for espionage, data theft, or sabotage. APTs often use advanced techniques and tactics to evade detection and maintain a long-term presence within a target’s network.

7. Zero-Day Exploits: Zero-day exploits are attacks that take advantage of previously unknown security vulnerabilities in software or systems. These vulnerabilities, also known as zero-day flaws, have no existing patches or fixes, making them particularly dangerous and challenging to defend against.

8. Internet of Things (IoT) Security: The increasing adoption of IoT devices and connected technologies has expanded the attack surface for cybercriminals. IoT devices are often vulnerable to cyber threats due to weak security measures, creating new risks for organizations and consumers.

9. Data Breaches: Data breaches occur when unauthorized individuals gain access to an organization’s sensitive data, such as customer information, financial records, or intellectual property. Data breaches can result in significant financial and reputational damage for organizations.

10. Cloud Security Threats: As more organizations migrate to cloud-based services, cloud security has become a critical concern. Threats in the cloud can arise from misconfigurations, weak authentication mechanisms, and vulnerabilities in cloud applications or infrastructure.

Benefits of Open-Source CyberSecurity tools

Open source cyber security monitoring tools offer numerous advantages over proprietary solutions, making them an attractive option for businesses, organizations, and individuals looking to enhance their security posture and perform effective security testing.

Here are some key benefits of using open-source tools for cyber security monitoring for monitoring services that pose security threats, even if you have another network monitoring system. Proper cybersecurity monitoring and access management are key to maintaining a secure environment.

Cost-Effectiveness

One of the most significant benefits of open-source cyber security tools is their cost-effectiveness. With no licensing fees or subscription costs, these free tools enable security teams to access powerful network monitoring solutions without breaking the bank.

This particularly benefits small businesses and startups with limited budgets, allowing them to allocate resources to other critical areas.

Customizability and Flexibility

Open-source network monitoring tools offer high customizability and flexibility, allowing security professionals to tailor the tools to their specific needs. This adaptability enables organizations to address unique security threats and vulnerabilities, ensuring a more robust security posture.

Additionally, the ability to integrate these tools with existing security infrastructure adds an extra layer of protection to network security.

Rapid Development and Updates

The open-source community is known for its rapid development and frequent updates. As new security threats and vulnerabilities emerge, open-source cyber security tools are often among the first to receive patches and updates.

This continuous monitoring and proactive response help organizations stay ahead of potential security risks and maintain a strong security posture.

Extensive Support and Collaboration

Open-source cyber security tools benefit from an extensive support network, comprising developers, users, and experts from around the world.

This collaborative environment fosters knowledge sharing, allowing security professionals to learn from one another and develop more effective security strategies.

Additionally, the availability of comprehensive documentation and online forums makes it easier for users to troubleshoot issues and enhance their understanding of network monitoring and security.

Improved Security and Transparency

With their source code openly available for inspection, open-source cyber security tools offer greater transparency than proprietary alternatives. This transparency allows security professionals and researchers to scrutinize the code for potential security vulnerabilities and ensure its integrity.

Moreover, the collaborative nature of the open-source community means that any identified issues are addressed quickly, further enhancing the overall security of these tools.

Platform Independence and Interoperability

Open-source network monitoring software often supports a wide range of operating systems, including Windows, macOS, and Linux, allowing organizations to deploy these tools across diverse environments.

This platform independence and interoperability help organizations ensure comprehensive network monitoring, regardless of the underlying infrastructure.

Top 25 Open Source Cyber Security Monitoring Tools in 2023

Note the following free cyber security monitoring tools in 2023 and the open-source list of solutions you can take advantage of and no free trial needed.

1. Wireshark: Network Protocol Analyzer

Wireshark is a widely-used network protocol analyzer that enables security teams to troubleshoot, analyze, and monitor network traffic in real-time to detect security issues. It is a defacto standard network monitoring tool.

command line interface data packets open source platform data breaches packet capture web apps network packets computer security experts solarwinds security event manager security scanning

By dissecting network protocols, Wireshark provides valuable insights into potential security risks and network vulnerabilities, allowing professionals to identify and resolve issues efficiently with the Wireshark network monitoring solution.

You can monitor a wide range of protocols, including TCP/IP, simple network management protocol, FTP, and many others. If you are looking for a network monitor this is it.

2. Snort: Network Intrusion Detection and Prevention System

Snort is a powerful open-source intrusion detection and prevention system (IDPS) that monitors network traffic and detects potential security threats.

It provides real-time traffic analysis, packet logging, and alerting capabilities, making it an essential tool for security auditing and network monitoring.

3. OSSEC: Host-Based Intrusion Detection System

OSSEC is a comprehensive host-based intrusion detection system (HIDS) that offers log analysis, file integrity checking, rootkit detection, and more.

It supports various operating systems, including Linux, Windows, and macOS, and helps security professionals monitor and analyze network protocols for potential security vulnerabilities.

4. Security Onion: Intrusion Detection and Network Security Monitoring Distribution

Security Onion is a Linux distribution specifically designed for intrusion detection, network security monitoring, and log management.

With a suite of powerful open-source tools, including Snort, Suricata, and Zeek, Security Onion provides a robust solution for security teams to monitor networks and detect security breaches.

5. Nmap: Network Scanning and Discovery Tool

Nmap is a versatile network scanning and discovery tool that helps security professionals identify network devices, open ports, and running services.

It is an essential network monitoring software for vulnerability management, penetration testing, and network inventory management.

6. Kismet: Wireless Network Detector, Sniffer, and Intrusion Detection System

Kismet is a wi fi security tool that detects, sniffs, and analyzes wireless networks. By monitoring wireless network traffic, Kismet identifies potential security risks, network vulnerabilities, and unauthorized users, making it an invaluable tool for wireless network security.

7. Suricata: High-Performance Network Intrusion Detection and Prevention Engine

Suricata is an open-source, high-performance network intrusion detection and prevention engine that provides real-time network traffic analysis, threat detection, and alerting.

Suricata enables security professionals to maintain network integrity and security by employing advanced threat defense and anomaly detection techniques.

8. Zeek (formerly Bro): Network Analysis Framework for Security Monitoring

Zeek, previously known as Bro, is a powerful network analysis framework that offers real-time insight into network traffic.

With its flexible scripting language and extensible plugin architecture, Zeek provides comprehensive visibility into network activity, enabling security teams to detect and prevent security threats.

9. OpenVAS: Vulnerability Scanning and Management Solution

OpenVAS is a comprehensive vulnerability scanning and management solution that helps security professionals identify, assess, and remediate security vulnerabilities.

With its extensive plugin library, OpenVAS ensures continuous monitoring and up-to-date vulnerability information, making it a critical tool for vulnerability management.

10. ClamAV: Open-Source Antivirus Engine

ClamAV is an open-source antivirus engine that detects trojans, viruses, and other malicious software.

It offers a command-line scanner, a graphical user interface (GUI) for Windows operating system, and integration with mail servers, ensuring that your systems are protected from security threats.

11. Fail2Ban: Log-Parsing Application to Protect Against Brute-Force Attacks

Fail2Ban is a log-parsing application that monitors log files for malicious activity, such as repeated failed login attempts. Fail2Ban bans the offending IP address when a potential attack is detected, effectively protecting your network from brute-force attacks and unauthorized access.

12. AlienVault OSSIM: Open-Source Security Information and Event Management Platform

AlienVault OSSIM is an open-source security information and event management (SIEM) platform that provides real-time event correlation, log analysis, and threat intelligence.

By integrating multiple security tools, OSSIM helps security teams maintain a unified user interface and enhance their overall security posture.

13. Cuckoo Sandbox: Automated Malware Analysis System

Cuckoo Sandbox is an open-source automated malware analysis system that enables security professionals to analyze suspicious files and URLs in a safe, isolated environment.

It provides detailed reports on malware behavior, including network traffic analysis, file system changes, and API traces, helping security teams identify and mitigate security risks.

14. Logstash: Log Processing and Management Tool

Logstash is part of the Elastic Stack (ELK Stack) and offers log processing and management capabilities.

It collects, parses, and stores log data from various sources, making it an essential tool for security professionals to monitor and analyze network activity, detect security breaches, and maintain system performance.

15. pfSense: Open-Source Firewall and Router Distribution

pfSense is an open-source firewall and router distribution based on FreeBSD. It offers a powerful and flexible network security, traffic shaping, and VPN connectivity solution.

With its extensive features and customization options, pfSense is ideal for securing web servers and internal networks.

16. ModSecurity: Open-Source Web Application Firewall

ModSecurity is an open-source web application firewall (WAF) providing real-time security monitoring and access control. It detects and prevents web attacks, protects sensitive data, and helps security professionals maintain compliance with industry standards and regulations.

17. AIDE (Advanced Intrusion Detection Environment): File and Directory Integrity Checker

AIDE is a file and directory integrity checker that monitors system files for unauthorized changes. It detects modifications, deletions, and additions, allowing security teams to maintain system integrity and prevent security breaches.

18. Graylog: Open-Source Log Management Platform

Graylog is an open-source log management platform that centralizes and analyzes log data from various sources.

Graylog helps security professionals detect security threats, identify network vulnerabilities, and maintain network security by providing comprehensive visibility into network activity.

19. Wazuh: Security Monitoring and Compliance Solution

Wazuh is a free, open-source security monitoring and compliance solution that integrates host-based and network-based intrusion detection systems, file integrity monitoring and security policy enforcement.

Wazuh’s centralized management and powerful analytics capabilities make it an essential tool for security teams to detect and respond to security threats.

20. T-Pot: Honeypot Platform

T-Pot is a platform combining multiple honeypots into a single, easy-to-deploy solution for cyber security monitoring. By simulating vulnerable systems and services, T-Pot attracts attackers and collects threat data, providing valuable insights into current attack trends and techniques.

Honorable mentions

Samhain: Host-Based Intrusion Detection System

Samhain is a host-based intrusion detection system (HIDS) that provides file integrity checking and log file monitoring. It detects unauthorized modifications, deletions, and additions, helping security professionals maintain system integrity and prevent security breaches.

SELKS: Network Security Management ISO with Suricata

SELKS is a live and installable network security management ISO based on Debian, focusing on a complete and ready-to-use Suricata IDS/IPS ecosystem. It offers a user-friendly interface and powerful analytics tools, making it an ideal choice for security teams to monitor networks and detect potential security threats.

Squid: Open-Source Web Proxy Cache and Forward Proxy

Squid is an open-source web proxy cache and forward proxy that improves web performance and security. By caching frequently-requested web content and filtering web traffic, Squid helps reduce bandwidth usage, enhance user privacy, and protect against web-based security threats.

YARA: Pattern-Matching Tool for Malware Researchers

YARA is a pattern-matching tool designed for malware researchers to identify and classify malware samples. By creating custom rules and signatures, YARA enables security professionals to detect and analyze malicious software, enhancing their understanding of current malware trends and techniques.

Arkime (formerly Moloch): Large-Scale, Open-Source, Indexed Packet Capture and Search System

Arkime is a large-scale, open-source, indexed packet capture and search system that provides comprehensive visibility into network traffic. It enables security professionals to analyze network protocols, detect security vulnerabilities, and identify potential security threats, making it an essential tool for network monitoring and security auditing.

Tips to Improve Your Cybersecurity Posture

Improving your cybersecurity posture is essential for safeguarding your organization from various cyber threats. Here are some practical tips to help enhance your cybersecurity defenses:

  1. Implement Regular Security Audits: Conducting routine security audits can help identify potential weaknesses in your organization’s cybersecurity infrastructure.
  2. This includes checking for outdated software, misconfigured settings, and other vulnerabilities that may expose your systems to attacks.
  3. Keep Software and Systems Updated: Regularly update your software, operating systems, and firmware to protect against known vulnerabilities and exploits.
  4. This includes applying security patches and updates as soon as they become available.
  5. Use Strong Authentication Mechanisms: Implement multi-factor authentication (MFA) for all critical systems and applications.
  6. MFA adds an extra layer of security by requiring users to provide additional verification, such as a one-time code or biometric authentication, in addition to their password.
  7. Encrypt Sensitive Data: Encrypt sensitive data both in transit and at rest to prevent unauthorized access. This includes using secure communication protocols, such as HTTPS and TLS, and implementing encryption solutions for data storage.
  8. Establish a Strong Password Policy: Enforce a robust password policy that requires users to create complex, unique passwords and update them regularly. Additionally, consider using a password manager to help users manage and store their passwords securely.
  9. Educate Employees on Cybersecurity Best Practices: Provide ongoing security awareness training to educate employees about common cyber threats, safe online practices, and how to recognize and report potential security incidents.
  10. Implement Network Segmentation: Divide your network into smaller segments, isolating critical systems and data from less secure areas. This can help prevent the spread of malware and limit the damage in case of a security breach.
  11. Regularly Backup Important Data: Regularly back up essential data and store copies offsite or in the cloud. This ensures that you can quickly recover from data loss or ransomware attacks.
  12. Utilize Endpoint Security Solutions: Deploy comprehensive endpoint security solutions to protect devices connected to your network.
  13. This includes antivirus software, firewalls, intrusion detection and prevention systems, and device management tools.
  14. Monitor and Analyze Network Traffic: Use network monitoring tools to analyze network traffic, detect anomalies, and identify potential security threats. Regular monitoring can help detect and respond to security incidents more effectively.
  15. Develop a Cybersecurity Incident Response Plan: Create a detailed incident response plan outlining the steps to take in a security breach. Regularly review and update the plan, and ensure that all employees are familiar with the procedures.
  16. Collaborate with Security Professionals: Engage with cybersecurity experts or managed service providers to help develop and maintain a strong security posture.
  17. This can provide access to specialized knowledge and resources to stay up-to-date with the latest threats and best practices.

Frequently Asked Questions (FAQs)

1. What are the best open-source cyber security monitoring tools available in 2023?

This blog post covers the top 25 open-source cyber security monitoring tools in 2023, including Wireshark, Snort, OSSEC, Security Onion, Nmap, Kismet, Suricata, Zeek, OpenVAS, ClamAV, and more.

These tools provide comprehensive network monitoring, threat detection, and vulnerability management capabilities to help organizations maintain a robust security posture.

2. Why choose open-source cyber security monitoring tools over proprietary alternatives?

Open-source cyber security monitoring tools offer several advantages: cost-effectiveness, customizability, rapid development and updates, extensive support, improved security, and platform independence.

These benefits make open-source tools attractive for organizations looking to enhance their network security and protect sensitive data.

3. How can I improve my organization’s cybersecurity hygiene?

In addition to utilizing open-source cyber security monitoring tools, organizations can improve their cybersecurity hygiene by implementing security awareness training, regularly updating software and systems, employing strong password policies, using multi-factor authentication, monitoring network traffic, and conducting regular security audits and penetration testing.

4. What is the importance of continuous monitoring in cybersecurity?

Continuous monitoring plays a crucial role in identifying and addressing security threats and vulnerabilities in real-time.

By regularly analyzing network traffic, security professionals can detect potential issues, respond to incidents promptly, and ensure the safety and integrity of their digital assets.

5. How can I protect my web applications from security threats?

Web application security can be improved by using tools such as ModSecurity, an open-source web application firewall (WAF) that provides real-time application security monitoring and access control.

Regularly updating web applications, conducting vulnerability assessments, and implementing secure coding practices can also help mitigate security risks.

6. What role do threat intelligence and threat data play in cybersecurity?

Threat intelligence and threat data help security professionals understand the latest trends, tactics, and techniques cybercriminals use.

Organizations can proactively address potential issues and maintain a strong security posture by staying informed about emerging threats and vulnerabilities.

7. Are open-source cyber security monitoring tools suitable for small businesses and startups?

Yes, open-source cyber security monitoring tools are ideal for small businesses and startups, as they offer cost-effective and powerful network monitoring solutions.

These tools enable organizations with limited budgets to access advanced security features without incurring high licensing fees or subscription costs.

Wrapping up

The ever-evolving landscape of cyber threats demands reliable and effective tools for security professionals to protect networks, systems, and sensitive data.

These Top 20 open-source cyber security monitoring tools in 2023 provide a comprehensive network monitoring, threat detection, and vulnerability management solution.

By incorporating these tools into your security strategy, you can enhance your overall security posture and ensure the safety and integrity of your digital assets.

Source :
https://www.virtualizationhowto.com/2023/05/top-20-open-source-cyber-security-monitoring-tools-in-2023/

Huge List Of PowerShell Commands for Active Directory, Office 365 and more

This is the ultimate collection of PowerShell commands for Active Directory, Office 365, Windows Server and more.

These commands will help with numerous tasks and make your life easier.

Table of Contents:

This section contains general commands for getting domain details.

View all Active Directory commands

get-command -Module ActiveDirectory

Display Basic Domain Information

Get-ADDomain

Get all Domain Controllers by Hostname and Operating

Get-ADDomainController -filter * | select hostname, operatingsystem

Get all Fine Grained Password Policies

Get-ADFineGrainedPasswordPolicy -filter *

Get Domain Default Password Policy

Gets the password policy from the logged in domain

Get-ADDefaultDomainPasswordPolicy

Backup Active Directory System State Remotely

This will back up the domain controllers system state data. Change DC-Name to your server name and change the Backup-Path. The backup path can be a local disk or a UNC path

invoke-command -ComputerName DC-Name -scriptblock {wbadmin start systemstateback up -backupTarget:"Backup-Path" -quiet}

Related: Windows CMD Commands

This section is all Active Directory user commands.

Get User and List All Properties (attributes)

Change username to the samAccountName of the account

Get-ADUser username -Properties *

Get User and List Specific Properties

Just add whatever you want to display after select

Get-ADUser username -Properties * | Select name, department, title

Get All Active Directory Users in Domain

Get-ADUser -Filter *

Get All Users From a Specific  OU

OU = the distinguished path of the OU

Get-ADUser -SearchBase “OU=ADPRO Users,dc=ad,dc=activedirectorypro.com” -Filter *

Get AD Users by Name

This command will find all users that have the word robert in the name. Just change robert to the word you want to search for.

get-Aduser -Filter {name -like "*robert*"}

Get All Disable User Accounts

Search-ADAccount -AccountDisabled | select name

Disable User Account

Disable-ADAccount -Identity rallen

Enable User Account

Enable-ADAccount -Identity rallen

Get All Accounts with Password Set to Never Expire

get-aduser -filter * -properties Name, PasswordNeverExpires | where {$_.passwordNeverExpires -eq "true" } | Select-Object DistinguishedName,Name,Enabled

Find All Locked User Accounts

Search-ADAccount -LockedOut

Unlock User Account

Unlock-ADAccount –Identity john.smith

List all Disabled User Accounts

Search-ADAccount -AccountDisabled

Force Password Change at Next Login

Set-ADUser -Identity username -ChangePasswordAtLogon $true

Move a Single User to a New OU

You will need the distinguishedName of the user and the target OU

Move-ADObject -Identity "CN=Test User (0001),OU=ADPRO Users,DC=ad,DC=activedirectorypro,DC=com" -TargetPath "OU=HR,OU=ADPRO Users,DC=ad,DC=activedirectorypro,DC=com"

Move Users to an OU from a CSV

Setup a csv with a name field and a list of the users sAmAccountNames. Then just change the target OU path.

# Specify target OU. $TargetOU = "OU=HR,OU=ADPRO Users,DC=ad,DC=activedirectorypro,DC=com" # Read user sAMAccountNames from csv file (field labeled "Name"). Import-Csv -Path Users.csv | ForEach-Object { # Retrieve DN of User. $UserDN = (Get-ADUser -Identity $_.Name).distinguishedName # Move user to target OU. Move-ADObject -Identity $UserDN -TargetPath $TargetOU }

This section list commands used for getting Active Directory group information.

Get All members Of A Security Group

Get-ADGroupMember -identity “HR Full”

Get All Security Groups

This will list all security groups in a domain

Get-ADGroup -filter *

Add User to Group

Change group-name to the AD group you want to add users to

Add-ADGroupMember -Identity group-name -Members Sser1, user2

Export Users From a Group

This will export group members to a CSV, change group-name to the group you want to export.

Get-ADGroupMember -identity “Group-name” | select name | Export-csv -path C:\OutputGroupmembers.csv -NoTypeInformation

Get Group by keyword

Find a group by keyword. Helpful if you are not sure of the name, change group-name.

get-adgroup -filter * | Where-Object {$_.name -like "*group-name*"}

Import a List of Users to a Group

$members = Import-CSV c:itadd-to-group.csv | Select-Object -ExpandProperty samaccountname Add-ADGroupMember -Identity hr-n-drive-rw -Members $members

List of commands for getting Active Directory computers.

Get All Computers

This will list all computers in the domain

Get-AdComputer -filter *

Get All Computers by Name

This will list all the computers in the domain and only display the hostname

Get-ADComputer -filter * | select name

Get All Computers from an OU

Get-ADComputer -SearchBase "OU=DN" -Filter *

Get a Count of All Computers in Domain

Get-ADComputer -filter * | measure

Get all Windows 10 Computers

Change Windows 10 to any OS you want to search for

Get-ADComputer -filter {OperatingSystem -Like '*Windows 10*'} -property * | select name, operatingsystem

Get a Count of All computers by Operating System

This will provide a count of all computers and group them by the operating system. A great command to give you a quick inventory of computers in AD.

Get-ADComputer -Filter "name -like '*'" -Properties operatingSystem | group -Property operatingSystem | Select Name,Count

Delete a single Computer

Remove-ADComputer -Identity "USER04-SRV4"

Delete a List of Computer Accounts

Add the hostnames to a text file and run the command below.

Get-Content -Path C:ComputerList.txt | Remove-ADComputer

Delete Computers From an OU

Get-ADComputer -SearchBase "OU=DN" -Filter * | Remote-ADComputer

List of commands for getting group policy details.

Get all GPO related commands

get-command -Module grouppolicy

Get all GPOs by status

get-GPO -all | select DisplayName, gpostatus

Backup all GPOs in the Domain

Backup-Gpo -All -Path E:GPObackup

Office 365 PowerShell Commands

Commands for Office 365.

Connect To Exchange Online

This will pop up and ask for credentials

$UserCredential = Get-Credential $Session = New-PSSession -ConfigurationName Microsoft.Exchange -ConnectionUri https://ps.outlook.com/powershell/ -Credential $LiveCred -Authentication Basic -AllowRedirection Import-PSSession $Session

Force Azure Sync

This is for the azure ad sync client.

Force delta sync (only sync changes

Start-ADSyncSyncCycle -PolicyType Delta Force a full sync Start-ADSyncSyncCycle -PolicyType Initial

Get A List of All Office 365 Users

Get-MsolUser | Select DisplayName, City, Department, ObjectID

Get Full mailbox details

Get-Mailbox email-address | fl

Get Calendar Permissions

Get-MailboxFolderPermission username:calendar

Enable Remote Mailbox (Hybrid Environment)

Use this command if you have an existing on-premise user that needs an office 365 mailbox. There are other ways to do this but this creates all the attributes in the AD account.

Replace the username and the tenant fields

Enable-RemoteMailbox username -RemoteRoutingAddress "username@tenant.mail.onmicrosoft.com"

Windows Server & Client Commands

Get all Services

get-service

Get all Processes

get-process

Display Network Adapters

Gets detailed about the network adapter installed such as name,  status, speed and mac address.

get-netadapater

Restart Remote Computers

Restart-Computer -ComputerName "Server01", "Server02", "localhost"

Get Last Boot Time

This takes a few lines

$os = Get-WmiObject win32_operatingsystem $uptime = (Get-Date) - $os.ConvertToDateTime($os.LastBootUpTime) Write-Output ("Last boot: " + $os.ConvertToDateTime($os.LastBootUpTime))

You can also run this single line to get last boot time

systeminfo | more

Start a Remote Session

Use this to start an interactive session with a remote computer

Enter-PSSession -ComputerName

Read the Content of a File (Open a file)

This example shows how to read the content of the windows firewall log file

Get-Content -Path "c:windowssystem32logfilesfirewallpfirewall.log"

Copy Files & Folders

Use this command to copy an entire folder to another folder. This will copy the folder and all the sub folder/files. The -verbose command will display the results to the console.

copy-item E:\WindowsImageBackup\exchange -destination \\server1\Backups\Exchange -recurse -verbose

Basic PowerShell Commands

Get Execution Policy

get-executionpolicy

Set Execution Policy to Unrestricted

set-executionpolicy unrestricted

Show PowerShell Version

$PSVersionTable

Get help for a command

Use this to get the help information for a command

get-help command-name

Search Get Help

Use this to search the help files. This is useful if you don’t know the command or want to see if one exists.

get-help *keyword*

Get Installed Modules

Use this command to display all the installed modules on a computer

get-installedmodule

List All Available Modules

This will list all available modules on the computer.

Get-Module -ListAvailable

Exporting results to CSV

Add export-csv to the end of commands

Get-ADUser username -Properties * | Select name, department, title | export-csv c:\user.csv

Display available commands

This will display all commands that are available based on the modules that are loaded.

get-command

Find New Modules

Replace *ntfs* with the keyword you want to search for. This searches modules at https://www.powershellgallery.com/

Find-Module *ntfs*

Install a New Module

Installs modules from https://www.powershellgallery.com/

I found a module called NTFSSecurity, to install it I run this command

install-module NTFSSecurity

Recommended Tool: SolarWinds Hybrid Systems Monitor

Monitor your physical and virtual servers with ease and troubleshoot more easily when downtime or other application performance issues occur.

What I like best about this tool is it’s easy-to-use dashboard and built-in alerting. See key metrics to help identify issues before users complain.

Monitor Active Directory, DNS, DHCP, and other critical IT systems, both locally and cloud hosted. Get automated email alerts and know which applications are having issues in your environment.

Source :
https://activedirectorypro.com/powershell-commands/

Tip – How to Disable Cloud-Based Clipboard (WIN+V) History in Windows 10

This tutorial will help you in disabling cloud-based clipboard (WIN+V) history feature in Windows 10. Once you follow the steps given in this guide, you’ll be able to prevent or restrict Windows 10 as well as other users from enabling cloud-clipboard feature from Settings and accessing your copied data from cloud-clipboard fly-out.

Newer versions of Windows 10 come with new cloud-based Clipboard feature which allows users to copy and paste multiple items from the clipboard. Users can copy multiple items to the new clipboard and then they can select and paste desired copied items from cloud-clipboard to anywhere they want such as Notepad, MS Word, etc.

The new cloud-based clipboard can be used by pressing WIN+V keys together. To copy items you need to use the good old Ctrl+C hotkey but to paste the copied text from new cloud-based clipboard, you need to use the new WIN+V keyboard shortcut.

When you press WIN+V keys together to access cloud-clipboard, Windows 10 launches the new cloud-based clipboard fly-out as shown in following screenshot:

Clear_Cloud_Based_Clipboard_History_Windows_10.png

To paste an item, you need to click on the item and it’ll be immediately pasted at current cursor position in your program window.

Users can enable/disable cloud-clipboard using Windows 10 Settings app. Open Settings app (WIN+I) and go to System -> Clipboard section. Now you can turn on/off Clipboard History option to allow/disallow Windows 10 from copying items to new cloud-clipboard as shown in following screenshot:

Customize_Cloud_Based_Clipboard_Settings_Windows_10.png

We posted a detailed tutorial reviewing cloud-based clipboard feature at following link:

[Tip] How to Configure and Use Cloud-Based Clipboard (WIN+V) Feature in Windows 10

Although it’s a good feature but many Windows 10 users may not like the new cloud-clipboard feature and they may want to disable or deactivate it due to privacy and security reasons.

In this tutorial, we’ll tell you how to permanently disable cloud-clipboard feature in Windows 10 so that no one can access your copied data by pressing WIN+V hotkey.

Once deactivated or disabled, when anyone will try to open Settings -> System -> Clipboard page in your Windows 10 device, he’ll notice that Clipboard History option is grayed out i.e. disabled and he can’t change it. So users will be unable to activate or enable cloud-clipboard feature without your permission. Also a message “Some of these settings are hidden or managed by your organization” will be displayed at the top of the page as shown in following screenshot:

Cloud_Clipboard_History_Disabled_Grayed_Out_Windows_10_Settings.png

If anyone will try to press WIN+V hotkey in Notepad or any other program to access cloud-clipboard feature, the new clipboard fly-out will open blank or empty. Windows 10 will no longer store your copied items to cloud-clipboard.

Following methods will help you in disabling cloud-clipboard feature in Windows 10 operating system:

METHOD 1: Using Group Policy Editor

1. Press WIN+R keys together to launch RUN dialog box. Now type gpedit.msc and press Enter. It’ll open Group Policy Editor.

2. Now go to:

Computer Configuration -> Administrative Templates -> System -> OS Policies

3. In right-side pane, look for following options:

Allow Clipboard History

Allow Clipboard synchronization across devices

4. Double-click on both options one by one and set both of them to Disabled.

Disable_Cloud_Clipboard_History_Windows_10_Group_Policy.png

That’s it. It’ll permanently disable cloud-clipboard feature in Windows 10.

PS: In future, if you decide to restore default settings and restore cloud-clipboard feature, set the above mentioned options to Not Configured again in Group Policy Editor.

METHOD 2: Using Registry Editor

If you are using Home edition of Windows, you’ll not be able to run gpedit.msc command because this edition doesn’t come with Group Policy Editor.

If you can’t use or don’t want to use Group Policy Editor, you can take help of Registry Editor for the same task. Just follow these simple steps:

1. Press WIN+R keys together to launch RUN dialog box. Now type regedit and press Enter. It’ll open Registry Editor.

2. Now go to following key:

HKEY_LOCAL_MACHINE\SOFTWARE\Policies\Microsoft\Windows\System

3. In right-side pane, right-click on empty area and select New -> DWORD (32-bit) Value option. Set the new DWORD name as AllowClipboardHistory and keep its value to 0

Again right-click on empty area and select New -> DWORD (32-bit) Value option. Set the new DWORD name as AllowCrossDeviceClipboard and keep its value to 0

Disable_Cloud_Clipboard_History_Windows_10_Registry_Editor.png

4. Close Registry Editor. You may need to restart your computer to take effects.

That’s it. It’ll completely disable cloud-clipboard feature in Windows 10.

PS: In future, if you decide to restore default settings and restore cloud-clipboard feature, delete the DWORD values created in above mentioned steps from Registry Editor.

Also Check:

[Fix] Some Settings are Managed by Your Organization in Windows 10

You are here: Home » Windows 10 » [Tip] How to Disable Cloud-Based Clipboard (WIN+V) History in Windows 10

Published in: Windows 10

About the author: Vishal Gupta (also known as VG) has been awarded with Microsoft MVP (Most Valuable Professional) award. He holds Masters degree in Computer Applications (MCA). He has written several tech articles for popular newspapers and magazines and has also appeared in tech shows on various TV channels.

Source :
https://www.askvg.com/tip-how-to-disable-cloud-based-clipboard-winv-history-in-windows-10/

How to automatically generate email summaries with Zapier and OpenAI

By Michael Toth · May 1, 2023

Keeping up with your email inbox can be a daunting task. It’s easy to get bogged down in long, rambling messages or get overwhelmed by a million unimportant emails and miss the important information buried within. Fortunately, there’s a solution that can help. 

Do more with OpenAI

Discover more ways to add AI to your workflows.

Explore now

With Zapier and OpenAI’s GPT-3, summarizing your email’s essential details has never been easier. With just a few clicks, you can automatically get a summary for each email in Slack or a handy daily digest that includes all the critical info you need from each email all in one go.

In this article, we’ll walk you through the steps of setting up this powerful Zap—our word for Zapier’s automated workflows. Whether you’re a busy professional or simply seeking to optimize your process, this tutorial will help you streamline your email management and stay on top of your inbox.

Looking for GPT-4? GPT-4 may be available with our OpenAI integration in the future. In the meantime, users with a paid subscription to ChatGPT Plus can access GPT-4 via our ChatGPT integration now—allowing you to add ChatGPT-powered conversations into apps like Slack.

How it works

For this project, we’ll be using OpenAI’s GPT-3 to summarize our emails, and then we’ll send the summaries to Slack. 

A 4-step Zap in the Zap editor.

If you’d like to start with a template, click on the Zap template below to go to the Zap editor. You’ll need to create a Zapier account if you don’t already have one. Then, follow the directions below to set up your Zap.

Get an OpenAI-generated email summary in Slack for new Gmail emails

Try it

  • Gmail logo
  • +2
  • Slack logo

Gmail, Formatter by Zapier, OpenAI (GPT-3, DALL·E, Whisper), Slack

Gmail + Formatter by Zapier + OpenAI (GPT-3, DALL·E, Whisper) + 1 moreMore details

Alternatively, if you prefer to receive the notifications as a daily digest rather than individually, we’ll walk through how you can use Digest by Zapier for this purpose. 

A 5-step Zap in the Zap editor.

If you’d like to go the digest route, you can start with the following Zap template:

Get an AI-generated daily digest of your emails in Slack

Try it

  • Gmail logo
  • +3
  • Slack logo

Gmail, Digest by Zapier, Formatter by Zapier, OpenAI (GPT-3, DALL·E, Whisper), Slack

Gmail + Digest by Zapier + Formatter by Zapier + 2 moreMore details

Before we begin developing our Zap, you’ll also need an OpenAI account if you don’t already have one. Go to platform.openai.com to sign up for your account. You’ll also need a free Slack account, which you can sign up for at www.slack.com

Are you ready to build this yourself? Let’s get started!

New to Zapier? It’s a tool that helps anyone connect apps and automate workflows—without any complicated code. Sign up for free.

Step 1: Set up your Gmail trigger step

Head over to Zapier, and click the Create Zap button to create a new Zap. 

Search for and select Gmail for the trigger app and New Email in Gmail for the trigger event (if you’re using the Zap template, these will already be selected for you). 

A Zap with Gmail selected for the trigger app and New Email for the trigger event.

Next, connect your Gmail account if you haven’t already connected it to Zapier.

In the Label/Mailbox field, select INBOX. You can optionally leave this blank to trigger for all emails. But since that will also trigger for sent messages and drafts, INBOX is the best choice unless you do heavy email filtering/labeling to remove emails from your inbox.

In the Label/Mailbox field, INBOX is shown selected.

Click Test Trigger, and you should see a recent email from your inbox, as shown below:

A successful test result that shows an email found in a Gmail inbox.

Step 2: Set up a formatter step to truncate your email

Currently, GPT-3 only allows you to send a limited amount of data to summarize, so we’ll need to truncate our email to make sure we don’t exceed this limit. In the future, OpenAI plans to develop new models with higher limits, or possibly no limits, but for now, this is a necessary step.

Click the + symbol beneath your Gmail trigger, then search for and select Formatter by Zapier for the action app and Text for the event. 

An action step of a Zap with Formatter by Zapier selected for the action app and Text for the action event.

Select Truncate as your transform action. Click in the Input field, and select Body Plain from the data dropdown from your Gmail trigger—this contains the plain-text body of the email. 

In the Max Length field, enter 6000, and then select True for the Append Ellipsis option. Here’s what your complete action step should look like:

A formatter step in the Zap editor with assorted fields filled out.

This 6000-character truncation means that if the email is shorter than 6000 characters, we’ll keep the entire thing, but if it’s longer, we’ll only keep the first 6000. 6000 characters is quite long, but I do often see emails that go over this limit. Most commonly, this will be longer newsletters or long back-and-forth email threads, as Gmail will include the entire thread in the body that Zapier receives. Because Gmail processes their email threads in reverse chronological order, this truncation will keep the most recent emails in the thread. 

Next, click Test Action to ensure everything is working properly. Next, we’ll set up our prompt to send to OpenAI.

Step 3: Set up your OpenAI email summary prompt

If you haven’t set up your Zapier connection to OpenAI, you’ll have to do that now. To start, head back over to platform.openai.com to log into your account. At the top right of the page, click on your profile icon and click View API Keys:

The Settings menu in OpenAI with the View API Keys tab selected.

From that page, click on the + Create new secret key button to generate a new API key. You’ll need this key to connect to your OpenAI account within Zapier. Copy this key and store it somewhere safe! 

A list of API keys in OpenAI.

Head back over to Zapier and add a new action step at the bottom of your Zap. Search for the OpenAI app and choose the Send Prompt event:

An action step in the Zap editor with OpenAI selected for the action app and Send Prompt for the action event.

Click on Choose account, and set up a new account by providing the API key you just generated in OpenAI. If you already have set up your account connection, simply select your existing account.

Head to the Set up action section to set up the prompt we’ll be sending over to OpenAI. In the Prompt field, copy and paste the following: 

Summarize the following email into 3 sentences max. Make it concise: 

"""

<Output from Formatter by Zapier>

"""

Replace the bracketed content with the Output variable from your Formatter by Zapier step by selecting Output from the Insert Data dropdown.

An OpenAI action step in the Zap editor with a prompt added to the Prompt field.

The triple quotes help GPT-3 to understand where the email starts and stops. 

If you want, you can give more specific instructions for the summary depending on your use case. For example, if you’re using this for your work email, you might provide information about your role at your company and the type of information that is or isn’t important to you. You might also consider providing additional context about the services or products your company offers so that GPT-3 can incorporate some of those details into the summary. For now, we’ll keep it simple with the prompt I show above.

You can leave all of the other fields for this step set to their default values. 

Click Test Action to send the email over to OpenAI. Review the summary and make sure everything looks okay. 

If you want to get a notification in Slack for each email you receive, continue to the next step.

If you want to get a daily digest of all of your emailsskip ahead.

Get notifications for each email step 4: Set up your Slack message

Next, we’ll set up the action step that will send the email summary back to you in a Slack message. This could also be set up to send as an email or SMS if you prefer, but we’ll be using Slack for this example.

Add a fourth action step and search for the Slackapp. Select the Send Channel Message event. 

A Slack action step in the Zap editor with Send Channel Message selected for the action event.

Connect your Slack account if you haven’t already connected it to Zapier.

Next, we’ll set up the action step. Select the Slack channel you want these messages to be sent to. I created a new channel called email-summaries for this purpose. 

In the Message Text field, copy and paste the following, replacing the bracketed content with data from your previous Zap steps, which you can select from the Insert Data dropdown:

*New email summary*

From {Gmail From Name}, {Gmail From Email}

Received {Gmail Date}

Summary: {OpenAI Choices Text}

<{Gmail Message URL}|Go To Email>

Your Message Text field should look like the following image when complete:

The Message Text field of a Slack step in the Zap editor.

This will create a message in Slack that includes the sender name and email address, the date and time the email was received, the summary generated by OpenAI, and a link to open the email directly in Gmail for easy responding.

Switch the Include a link to this Zap? field to No and leave the remaining fields as is. 

Next, click Test Action to send the summary message to your Slack channel and make sure everything is working properly. If everything looks good, you’re now ready to use your Zap.

Get a daily digest step 4: Set up your digest entries

If the idea of receiving instant notifications for every email you receive sounds too distracting, the daily digest is an ideal solution for you. Instead of setting up a Slack notification for the fourth step, we can use a built-in Zapier tool called Digest by Zapier to store up the email summaries throughout the day and then release them to us all at once at a designated time. 

Add a new action step to the bottom of your Zap. Select Digest by Zapier for your action app and Append Entry and Schedule Digest for your action event. 

A Digest by Zapier step in the Zap editor with Append Entry and Schedule Digest selected for the action event.

Navigate to the Action section and give your digest a descriptive title like Daily Email Summaries

For the Entry field, simply copy and paste the copy below. Then replace the bracketed content with the variables from the prior steps by selecting them from the Insert Data dropdown.

From {Gmail From Name}, {Gmail From Email}

Received {Gmail Date}

Summary: {OpenAI Choices Text}

<{Gmail Message URL}|Go To Email>

For the Frequency field, select Daily, and for the Time of Day field, choose when you’d like to receive the digest. Your completed action step should look like this:

A digest step in the Zap editor with a list of emails summarized in the Body field.

Click Test Action to add an entry to your digest and make sure your action step is set up correctly.

Get a daily digest step 5: Set up the Slack action to release your daily digest

Finally, we’ll set up the action step that will release your daily digest and send all of the email summaries to you in a Slack message. This digest message will automatically send at the Time of Day you specified in the prior action step. 

Add an action step and search for the Slackapp. Select the Send Channel Message event. 

A Slack step in the Zap editor with Send Channel Message selected for the action event.

Click on the Actionsection. As before, select the channel you want these messages to be sent to. I created a new channel called email-summaries for this purpose. 

In the Message Text field, copy and paste the following, replacing the bracketed content with the data received from your previous digest step by selecting them from the insert Data dropdown:

*You received {Digest Count} emails today*

{Current Digest}

Your Message Text field should look like the following image when complete:

A Slack message text field with a daily digest of 4 emails.

This will create a message in Slack that includes the total number of emails received and the digest with all of the email summaries that were created throughout the day, formatted as we specified in the prior step. 

Switch the Include a link to this Zap? field to No and leave the remaining fields as is. 

Next, click Test Action to send the summary digest to your Slack Channel and make sure everything is working properly. If everything looks right, you’re now ready to use your Zap! 

Putting it all together

Whether you’re a busy professional or simply looking to optimize your email management process, setting up either of these workflows can help streamline your day and keep you on top of your inbox. Give it a try and see the difference it can make!

Related reading:


Source :
https://zapier.com/blog/generate-email-summaries-with-ai/

GPO – Copy files to remote computers

Would you like to learn how to configure a group policy to copy files to remote computers? In this tutorial, we will show you how to copy files using a GPO.

• Windows 2012 R2
• Windows 2016
• Windows 2019
• Windows 10
• Windows 7

Equipment list

The following section presents the list of equipment used to create this tutorial.

As an Amazon Associate, I earn from qualifying purchases.

Windows Related Tutorial:

On this page, we offer quick access to a list of tutorials related to Windows.

Tutorial GPO – Copy files

Create a shared folder and place a copy of the files.

This will be the distribution point of the files to the network.

GPO - Copy file

In our example, a shared folder named SOFTWARE was created.

All the domain users and all the domain computers were given read permission over this folder.

GPO - Copy file from share

In our example, this is the path to access the network share.

Copy to Clipboard

\\tech-dc01\SOFTWARE

On the domain controller, open the group policy management tool.

Windows 2012 - Group Policy Management

Create a new group policy.

Windows 2012 - Group Policy Objects

Enter a name for the new group policy.

Windows - Add GPO

In our example, the new GPO was named: MY-GPO.

On the Group Policy Management screen, expand the folder named Group Policy Objects.

Right-click your new Group Policy Object and select the Edit option.

Windows - Edit GPO

On the group policy editor screen, expand the Computer configuration folder and locate the following item.

Copy to Clipboard

Computer Configuration > Preferences > Windows Settings > Folders

Create a new folder.

GPO - Create a folder

On the General tab, perform the following configuration.

• Action – Update.
• Path – Enter the path to the folder.
• Attributes –  Select the attributes to the new folder.

Click on the OK button.

GPO - Creating new folder

In our example, we are going to create a local folder named TEST on the root of drive C of all computers in the domain.

On the group policy editor screen, expand the Computer configuration folder and locate the following item.

Copy to Clipboard

Computer Configuration > Preferences > Windows Settings > Files

Create a new file.

GPO - Copying files

On the General tab, perform the following configuration.

• Action – Update.
• Source – Enter the network path to the file.
• Destination – Enter the local path to save the file.

Click on the OK button.

GPO - Copy file to remote computers

In our example, we are going to copy a file from the network share named SOFTWARE to the local folder named TEST.

To save the group policy configuration, you need to close the Group Policy editor.

Congratulations! You have finished the GPO creation.

Tutorial – Applying the GPO to copy files

On the Group policy management screen, you need to right-click the Organizational Unit desired and select the option to link an existent GPO.

Windows-2012-Applocker application

In our example, we are going to link the group policy named MY-GPO to the root of the domain.

GPO- tutorial linking

After applying the GPO you need to wait for 10 or 20 minutes.

During this time the GPO will be replicated to other domain controllers.

On a remote computer, verify if the GPO copied the file.

Group policy object - Copy files

In our example, we copied a file to all domain computers using a GPO.

Source :
https://techexpert.tips/windows/gpo-copy-files/

7 Reasons Why Security Awareness Is Critical for Employees

by hse | Apr 14, 2023 | Security information

There was a time when security awareness training was informal, short, and focused on simple things like using complex passwords. Well, it transpires that keeping these on a post-it note under your keyword or in a text file is in fact not a safe practice.

This was when cyber threats from hackers were the work of people with expert skills, and at worst resulted in your computer getting infected with a virus, causing a brief interruption to your working day. Fast forward to the modern reality of the dark web where you can literally shop around and choose the method in which you want to carry out a targeted attack.

Added to that are the near-constant cyber-attacks, where we can see an increase in phishing in the below graph from the Cyber Security Report 2023.

cyber security report - attack techniques - security awareness training

Attackers are not slowing down and always finding new, harmful ways to compromise businesses. The efforts therefore to stay ahead and protect organizations must continue, and one of those is to introduce security awareness training. There is significant evidence that security awareness training is more than just essential. A recent Remote Management Survey by Hornetsecurity showed in fact that 1 in 3 organizations do not provide any kind of cybersecurity awareness training to remote employees.

A reliance solely on an organization’s security function for detection and prevention is no longer sufficient. Employees must be armed with security awareness training to become foot soldiers in this war, and I’ll explain the reasons why.

1. Protects Sensitive Data

Security awareness training helps employees understand the importance of protecting sensitive information and the consequences of a data breach. Protecting sensitive data helps to ensure cyber security and maintain the confidentiality, integrity, and availability of your information systems.

Using security awareness services, users are educated to understand how and why sensitive data needs to be protected and can help prevent unauthorized access and data breaches. This security awareness software in turn protects the organization’s reputation and financial well-being, as well as protects the personal information of customers and employees.

Sensitive data is essentially confidential information such as financial records and personally identifiable information (PII) and, depending on the nature of the organization, could also include trade secrets or proprietary information considered commercially sensitive.

Theft and subsequent compromise of sensitive data is very common and a highly prized target during security or data breaches. In IBM’s “Cost of a data breach report 2022” we can see the year-on-year cost of a data breach is going in the wrong direction!

Through a cyber security training program, users become aware of the legal and ethical obligations they have to safeguard it from unauthorized access, disclosure, or misuse. Arming your users with security awareness training provides the knowledge and skills necessary how to handle sensitive information and significantly reduces the risk of a data or security breach.

2. Fosters a Sustainable Security Culture

Creating and fostering a culture of security within the organization is a fundamental step in raising awareness of security threats and practices for mitigating them.

Regular security awareness training promotes a security culture within an organization, making security a priority for all employees. You might have heard the catchphrase “security is everyone’s responsibility.” There’s a lot of truth to that.

Through a security awareness training program, employees benefit by learning and becoming aware of the roles and responsibilities and shifting their mindset from “that’s someone else’s problem” to “that’s my problem.”

Providing security awareness training empowers them to take responsibility and notice and report anything out of the ordinary. This can extend from information security things like phishing scams and emails to physical security and being able to identify or report someone suspicious lurking in the office or tailgating when entering the premises!

A security-conscious workforce brings about a culture where users are more likely to take proactive steps to protect their sensitive data and report suspicious activity.

3. Detects and Prevents Insider Threats

Security awareness training can help identify and prevent potential insider threats, such as employees who may be intentionally or unintentionally compromising the security of an organization, and here is why cybersecurity awareness training is important.

Insider threats refer to security breaches that are caused by a person who has authorized access to an organization’s systems, network, and data. Although only employees are commonly considered, it includes anyone who has access to the organization’s systems like vendors or contractors.

Theft of sensitive information, sabotage of systems, using security credentials, and unauthorized access to confidential data are also examples of insider threats. These threats can significantly impact the organization like financial loss, reputational damage, and even legal liabilities.

4. Increases Employee Engagement

By educating employees on the importance of security threats within and towards it, organizations can increase employee engagement and buy-in to security initiatives.

Engaged employees are more likely to feel like they have a vested interest in the success of their organization, thereby creating a sense of loyalty and responsibility towards it. Ultimately resulting in overall better security practices and reducing the risk of security breaches.

Increased employee engagement through security awareness training can result in employee retention, an often overlooked benefit. When employees leave an organization, they often take away with them potentially institutional sensitive information especially if an employee has a role within the security function of that organization, as their departure could create a security gap and therefore a security risk.

Although most organizations have a defined security policy, in reality, the only time an employee reads this is when they initially join and are required to read this part of their onboarding as a compliance exercise. By being and feeling more engaged, you’re likely to see better compliance with and understanding of security policies and procedures.

Understanding why these policies are necessary and how they contribute to the organization’s overall security reduces the risk of accidental or intentional security breaches.

security employee engagement

5. Education on Security Threats and How to Mitigate Them

Educating employees on security threats and how to mitigate them is crucial to maintaining a strong cybersecurity posture within an organization.

Employees who don’t work in a security-related role are often unaware of the plethora of security threats their organization faces every day. Incorporating education of security threats in a security awareness training program is an effective method to “enlist” employees as “soldiers” in this perpetual war.

Time is often of the essence when it comes to recognizing an IT security threat. For example, if a user who has not undergone a security awareness training program opens a malicious link, then realizes this, they are less likely to understand the significance of how quickly they must act on this information and report this.

Employees who understand the impact posed by security threats are more likely to make better decisions armed with this education.

6. Reduces Human Error

Employees are less likely to make costly security mistakes if they have received training on identifying and responding to security threats. Human error is a common cause of security incidents and one of the most common methods attackers use to infiltrate a network.

As you will have been, whenever there is a data breach, along with significant reputational damage, the financial cost is often significant. Assessing the cost and worth of implementing these security measures and awareness training is easily outweighed by the savings in not.

7. Supports Incident Response

Security awareness training equips employees with the knowledge and skills to respond effectively to security incidents, reducing the impact and recovery time of such incidents.

In an organization’s cyber security incident response plan, it will include and detail the roles and responsibilities for everyone in the organization. In the event of a security incident, it is important for all members of the organization to understand their roles and responsibilities in responding to the incident.

A security awareness program will help to educate people who are involved in being able to respond in the face of a security incident adequately and more quickly. Educated users are also more likely to recognize the signs of a security incident and report is prompt, which can help the incident response team take action more quickly.

The ability of an organization to respond in such a manner that minimizes the impact can be the difference between “getting owned” and mitigating a potential disaster.

We at Hornetsecurity work hard perpetually to give our customers confidence in their Security Awareness ServiceSpam & Malware ProtectionAdvanced Threat ProtectionEmail EncryptionEmail Archiving, and VM backup strategies.

To keep up to date with the latest security best practices, become a member of the Hornetsecurity blog now (it’s free).

Summary

The importance and benefits of security awareness training programs should not be underestimated for how organizations combat cybersecurity threats. Organizations can no longer think of cyber security awareness training as a maybe when they plan and strategize on how to improve cyber security posture, it’s essential.

In this digital age, many options and methods exist in which a cyber security awareness training program can be delivered, both online and in person. Hornetsecurity is one such place that offers a cyber security awareness training service.

FAQs

What is security awareness training?

Security awareness training is a kind of training that helps people learn about different security risks and how to keep themselves safe from them. Hornetsecurity provides security awareness training to help people become more aware and knowledgeable about security risks and how to protect themselves. By implementing proper security awareness training in your company, your employees will be able to recognize and avoid potential dangers.

Why is security awareness important?

Security awareness training is important to ensure the safety of sensitive data, and protecting against cyber threats is critical in today’s digital age. We at Hornetsecurity provide one-of-a-kind security awareness training that mainly focuses on creating a user-centric experience for employees better to understand the importance of security measures and procedures. With our training, you can rest assured that your systems and confidential information are secure.

What are the types of security awareness?

Our security expertise distinguishes 4 main types of security awareness training:

  1. Classroom training (lecture-based training)
  2. Video training
  3. Cloud training
  4. Simulation training

How often should security awareness training be conducted?

At Hornetsecurity, the Awareness Engine is the technological heart of our Security Awareness Service. It offers the following:

  • Everyone to have the right amount of training;
  • Each user receives as much training as necessary and as little as possible;
  • Demand-driven roll out of relevant e-training content;
  • Booster option for users who need more intensive e-training;
  • Fully automated steering of the e-training.

Source :
https://www.hornetsecurity.com/en/security-information/security-awareness-training/

Using Wireshark to Analyze and Troubleshoot Hyper-V Networking

Analyze traffic and uncover Hyper-V networking problems has never been easier

Networking problems frequently challenge administrators. Introducing a virtualized switch to the mix adds another layer of complexity and multiple failure points. We can use the popular Wireshark tool to analyze traffic and uncover problems.

Requirements for Success with Wireshark

First, you need the software. You can download Wireshark from Wireshark.org. The site includes substantial information and links to more. Due to the extensive depth of the tool, the value that you get from Wireshark depends directly on how well you’ve learned it. Ideally, you’d go through a guided course and practice on training captures. I understand that you might have more immediate needs. This article illustrates enough to get you started but expect to invest time in training and practice.

Second, you need a working knowledge of Ethernet frame structure. You do not need anything near expert level, but you won’t get far if you can’t make sense of what Wireshark reveals. We have an article series on basic networking that can get you started.

Remote Captures in Wireshark

Wireshark can capture information on remote systems. However, it includes more hints than details. I could not find any directions that I felt comfortable sharing. Fortunately, you have alternatives.

Wireshark will run on Windows Server. Because it relies on the Qt library for its graphical interface, you can run the entire program on a Core mode installation by manually starting “C:\Program Files\Wireshark\Wireshark.exe”. I have no objection to running Wireshark on a server. However, I do not like RDP or similar remote connections to servers. These technologies present a significant attack surface for malware and intruders. Use at your own risk.

During the Wireshark install, you can also select the TShark program, which gives you command-line access to captures. TShark works inside a PowerShell Remote session. That means that you can install TShark on a system that you want to capture “remotely”, output its capture to disk, and then import it into a management system. I will not spend much time on TShark in this article, but I will get you started.

TShark Fundamentals

First, install at least the TShark portion of Wireshark on the target server. That might require a remote desktop connection as Wireshark has no official support for remote or scripted installation. However, running “Wireshark-Win64-<VER>.exe /s” at a command prompt, (or via a script, or possibly even a remote session), should install the software with default options.

Second, open a remote PowerShell session to the server using credentials with administrative privileges on the target:

Connect-PSSession -ComputerName <SERVERNAME>

Alternatively, you can supply credentials at the point of entry:

Connect-PSSession -ComputerName <SERVERNAME> -Credential (Get-Credential)

Once you have your remote session, run Get-NetAdapter to retrieve a list of adapters on the remote server:

TShark Fundamentals

Locate the adapter(s) that host the Hyper-V virtual switch on the server and note the value(s) for ifIndex. In my case, I want interfaces 4 and 10. With that knowledge, initiate TShark. Tell it which interfaces to include in the capture and where to write an output file with the -i and -w switches, respectively. That looks something like this:

& ‘C:\Program Files\Wireshark\tshark.exe’ -i 4 -i 10 -w C:\Users\esadmin\Documents\cap.pcapng

You do need the leading ampersand. If you use tab completion for assistance in entering the path to TShark, PowerShell will insert it automatically.

Upon pressing [Enter], the capture starts and writes to the file. Most importantly, you need to know that pressing [CTRL]+[C] stops the capture. Because we did not specify a capture limit, it will run until we either cancel it or the remote system runs out of disk space. Less importantly, the TShark program does not generate all its console output in a way that PowerShell remote sessions can process. You will see some things that look like error messages and other things will not appear at all. Just remember how to start and stop the capture and you will get the expected capture file.

TShark allows you to restrict captures with limits and filters.

TShark allows you to restrict captures with limits and filters. I will leave learning about that to you. Start with tshark.exe –help. The instructions above will generate a capture file that, at worst, has more data than you want. Once you have that file, you can transfer it to your management workstation and use Wireshark to operate on it.

A Warning about Wireshark and Resources

Wireshark will write to capture files, but it defaults to keeping captured packets in memory unless told otherwise. When possible, only run captures for the time needed to gather the data relevant to the problem you want to solve. Take care to set limits on long-running captures to ensure that you do not consume all host memory or disk space. Remember that a full disk will cause any VMs on that disk to pause. Also, remember that Hyper-V prioritizes processes in the management operating system, so it will squeeze virtual machines as needed to provide CPU and memory resources to Wireshark.

Set capture limits from Wireshark’s main interface by clicking the Capture menu item on the menu bar and then clicking Options.

Wireshark will write to capture files

The Input tab allows you to select the adapters to watch and to define capture filters. The Output tab gives you options for writing to files. You can set finite capture limits on the Options tab that apply whether writing to memory or disk, along with some handy quality-of-life settings.

While we frequently want to capture all data so that we don’t miss environmental problems, you can greatly reduce capture size with capture filters. Unlike display filters, capture filters tell Wireshark to discard information without storing it. Use these cautiously; if you inadvertently throw out interesting frames, you’ll have to perform additional captures.

Finally, remember that 10GB and faster interfaces can already generate heavy CPU loads. Using Wireshark to capture and decipher frames costs that much more. Few systems drive their networking capabilities anywhere near their maximums but remain mindful.

Traffic Must Pass a Physical Adapter for Wireshark to Capture It

With the current way that the Hyper-V virtual switch projects into the management operating system, Wireshark cannot bind directly to it. Instead, we attach it to one or more physical adapters. This means that, at the management operating system level, Wireshark cannot intercept any traffic that never leaves the VMBus.

The VMBus limitation primarily impacts internal and private virtual switches. Without a physical adapter, you have few options. If you have an unused physical adapter, you could temporarily bind the virtual switch to it with Set-VMSwitch. If your host uses the older LBFO technology, you can add a team NIC in another VLAN and bind your virtual switch to that. Even with these alternatives, you will still miss anything that does not cross the bound adapter.

However, this should only present a problem in edge cases. Wireshark and TShark can operate just as well inside a virtual machine as they can in the management operating system. Wireshark does not distinguish between virtual and physical adapters. Set it to watch the virtual adapters involved in your communications chain, and you’ll see the traffic. If you can’t install either product inside a given virtual machine, you still have Hyper-V’s port mirroring feature.

Capturing All Virtual Switch Traffic

When you don’t know exactly what you’re looking for, which applies well when you don’t have much experience with network captures, just get everything. When you first open Wireshark, it will present all network adapters that it can operate with. Find the physical adapters that host your virtual switch and highlight them:

Capturing All Virtual Switch Traffic

Remember that choosing anything that says “vEthernet” in its name binds to that virtual adapter, not the virtual switch. For switch monitoring, you must choose the physical adapter(s).

You can either right-click your selection and click Start Capture or you can click the blue shark icon at the left of Wireshark’s icon menu. If you made a mistake in adapter selection or just want to change it after the capture has started, select Options from the Capture menu:

click Start Capture

Once the capture starts. you should see a rapidly scrolling screen like the one below. If you’re working on a problem, reproduce it while the trace runs.

Once the capture starts. you should see a rapidly scrolling screen

Once the trace has captured enough information, click the red square button on the toolbar to end it. Regardless of your intentions, I recommend saving the file. It’s better to have a capture file that you don’t need than the opposite.

You can scan through the capture to look for anything that seems out of place or just to acclimate yourself to a network capture. If you’ve never used Wireshark before, the topmost pane shows a list of captured frames with some basic information about each. The middle pane tries to break the selected frame down into its individual components. Click on the triangle icon to the left of any item to drill down further. Wireshark uses “dissectors” to interpret frame components. Anything that it doesn’t recognize goes into the generic “Data” portion. The third pane shows a binary dump of the frame. If you click any part of that, the dissector pane will shift focus to that location.

Listings such as this allow you to peruse the activity crossing your virtual switch. You can investigate whatever interests you.

Exercise 1: Capturing Virtual Switch Traffic by Port

Tracing traffic by port can help you locate breaks in communication. It helps you to discover if messages that you expect to arrive on a virtual machine ever make it to the virtual switch at all. You can ensure that servers on virtual machines respond to clients as expected. You can watch for traffic coming from unexpected (potentially malicious) sources.

In my example exercise, I want to verify that my “primary” domain controller properly receives and responds to authentication traffic. For the most basic trace, I can set a display filter on a previously captured file or on an active trace with this format: tcp.port == 389:

Capturing Virtual Switch Traffic by Port

For thoroughness, I want to look at all traffic that a domain controller would utilize for authentication traffic. I can filter to multiple ports like this: tcp.port == 88 or tcp.port == 389 or tcp.port == 636 or tcp.port == 3268 or tcp.port == 3269

domain controller would utilize for authentication traffic

Pressing [Enter] or the white arrow with the blue background at the end of the filter field will update the display to show only frames that match the filter:

blue background at the end of the filter field

Scanning the filtered view, I see frames that it clearly identifies as LDAP and others that it marks only as TCP. When Wireshark cannot identify a frame, look to the Info column. In the third row of the screenshot, we see that it has marked the frame as [ACK]. That tells us that the frame contains an acknowledgement of a previously received frame.

If I want to find out what the frame acknowledged, I can right-click on the line item, hover over Conversation Filter, and choose one of the offered items. In this case, I don’t want to miss anything, so I choose Ethernet as the least specific filter:

Conversation Filter

In response, Wireshark pares down the display to only the items that belong to that particular “conversation”. Also, notice that it updated the display filter:

display filter

I know that 192.168.5.1 belongs to the domain controller of interest. I also know that 192.168.5.2 belongs to my “secondary” domain controller. Therefore, before I even performed any of these tasks, I could have guessed that these frames carry requests or updates that keep domain information synchronized. To confirm, I select the first frame in the conversation in the top pane. In the second pane, I find the Lightweight Directory Access Protocol section that indicates a dissector has come into play. In the bottom frame, I locate the highlighted information (remember that this matches whatever I selected in the middle frame):

Lightweight Directory Access Protocol

The frame appears to have something to do with DNS settings. I look at the same portion of the second frame:

The frame appears to have something to do with DNS settings

We already know that the third and final frame in the conversation is an ACK. So, we can surmise that 192.168.5.2 asked 192.168.5.1 about SVDC02 as a DNS server, got a NO_OBJECT result, and acknowledged receipt of the result. It appears that I may have some DNS troubleshooting to do.

However, I was interested in authentication traffic. We learned that the tracked conversation dealt with DNS servers. I can return to my previous filtered view by clicking the drop-down arrow at the end of the filter line and choosing the filter that I want to see again:

We learned that the tracked conversation dealt with DNS servers

Exercise 2: Including or Excluding Virtual Switch Traffic by IP Address

To continue with the scenario set up in exercise 1, I still want to see all the authentication traffic to my “primary” domain controller, but I want to exclude anything between it and my “secondary” domain controller. The simplest display filter looks like this: ip.addr != 192.168.5.2. If I wanted to only see traffic on that IP, then I could use double equals (==) or eq instead of!=.

Of course, I don’t want non-authentication traffic. So, let’s modify the filter to ip.addr != 192.168.5.2 and (tcp.port == 88 or tcp.port == 389 or tcp.port == 636 or tcp.port == 3268 or tcp.port == 3269). Pay attention to the usage of parentheses. This grouping tells Wireshark that we want traffic where no frame includes IP address 192.168.5.2 but does contain any of the TCP ports inside the parentheses:

Including or Excluding Virtual Switch Traffic by IP Address

The remaining list tells us multiple things:

  • No non-domain controller except 192.168.10.1 talked to the domain controller during the capture (were we expecting traffic from someone else?)
  • We see the beginning of a conversation between the domain controller and 192.168.10.1 (indicated by the SYN packets)
  • 192.168.10.1 performed a bind and SASL operation
  • All traffic was on port 389
  • We see the end of a conversation (indicated by the RST, ACK packet followed by a FIN, ACK packet)

While not captured in the screenshot, the Info contents provide enough preview information for me to understand what the SASL conversation was about. However, I can click on the individual frames and use the other two panes to get a deeper look at the traffic.

Exercise 3: Determine the Physical Adapter(s) Used by a Virtual Machine

The Hyper-V virtual switch makes its own decisions when placing traffic on the members of a switch-embedded team. If you use the Hyper-V Port load balancing algorithm, it will affinitize each virtual adapter’s incoming traffic to a physical adapter. While it can dynamically change affinities in response to events, each virtual adapter will always receive on exactly one physical adapter. If you use the Dynamic load balancing algorithm instead, then Hyper-V can exploit Ethernet and TCP/IP characteristics to distribute physical adapter use down at the conversation level.

If you want to view its decisions in action, Wireshark can help. Get a capture of traffic on your switch’s physical adapters. Select any frame in the top pane. In the middle pane, expand the Frame group at the top, then the Interface item. Look at the Interface description field:

Determine the Physical Adapter

Skip around in a generic capture and look at the ways that it uses physical adapters. Notice how it freely distributes multicast and broadcast traffic as it sees fit. Notice how it picks an adapter for any given individual unicast conversation and keeps it there.

Frame

We will expand on this subject in the next two exercises.

Exercise 4: Determine the MAC Addresses Used by a Virtual Machine

This exercise may seem pointless because you can use PowerShell or the various graphical tools to find the MAC assigned to a Hyper-V virtual network adapter. Bear with me though, as you may see things that you don’t expect.

This exercise begins similarly to exercise 3. Pick a frame from the top pane and look in the center pane. The second section, after Frame, is Ethernet. It shows the MAC addresses involved in the frame, which probably aligns with what you see in your tools:

Determine the MAC Addresses Used by a Virtual Machine

Then again, it might not:

Ethernet

In fact, even though it includes the IP address of a virtual machine (192.168.127.3, visible in the third row), neither the source nor destination MAC belong to a Microsoft virtual adapter. For this reason, I counsel against filtering Hyper-V virtual switch traffic by any MAC owned by a virtual adapter unless you’re doing something like validating MAC address spoofing.

How did this happen? Short answer: Hyper-V silently utilizes the MAC addresses of physical adapters when load balancing traffic from a single virtual adapter. If that seems strange, understand that physical switches do the same thing. Knowing the MAC address that Hyper-V assigned to a virtual adapter does not guarantee that the virtual switch will only use that MAC in conversations involving that adapter. The only Ethernet segment that absolutely must have the correct MAC for an adapter is its direct switch connection. In Hyper-V’s case, that connection only exists on VMBus which, as we discussed earlier, cannot be seen in Wireshark. If you want a longer explanation, I wrote an article that talks about how this very thing can cause problems when using a dynamic-mode Hyper-V virtual switch in conjunction with load balancers.

You can see the MAC-to-adapter matching by comparing the MAC to the interface ID or description (as shown in exercise 3). You can use this information to filter a virtual machine’s traffic by adapter as shown in the next exercise.

Exercise 5: Find Traffic for a Virtual Machine that Uses a Specific Virtual Adapter

We’ll combine what we learned in the previous two exercises to answer a specific question: how do I filter the traffic from a specific virtual adapter that crosses a specific physical adapter? In case you skipped the previous sections, this question only makes sense when your Hyper-V virtual switch involves a physical adapter team.

The part of the virtual machine that does not change is its IP address, so I will filter by that first. Next, I will have Wireshark look at the frame object. As you type the filter, it will make suggestions. I begin my filter with ip.addr == 192.168.127.3 and frame.. Note that this is an incomplete query, and it includes a period at the end of frame:

Find Traffic for a Virtual Machine

You can see that Wireshark makes suggestions to help us out. The subcomponent of frame that interests us is the interface, so start typing that to shorten the suggestion list:

The subcomponent of frame that interests us is the interface

If you recall the Wireshark-assigned interface ID from previous exercises, then you can select the interface_id subcomponent and that number. I like repeatable, memorable things, so I will use the interface_description with the name that I gave the adapter in Windows: ip.addr == 192.168.127.3 and frame.interface_description == PTL. You do not need quotes around the name:

interface_id

My display now contains traffic for that virtual machine that uses the designated physical adapter, even though none of it includes the virtual machine’s “correct” MAC address:

My display now contains traffic for that virtual machine

Expect to see many frames marked “TCP Spurious Retransmission” on the physical adapter(s) that substitute their own MAC in place of the virtual adapter’s. Network load balancing does not come free.

Expand on these Lessons

This article only scratched the surface of Wireshark’s capabilities. Most importantly, it empowers you to see below the layer 3 and higher pieces that the virtual adapters deliver into the guest operating systems. You can now see the data that enters and leaves your virtual switch and use that knowledge to find the truth behind those vague “it must be something wrong with the network” excuses.

Source :
https://www.altaro.com/hyper-v/wireshark-hyper-v-networking/

Exit mobile version