There are a few simple principles that can help achieve optimal wireless client connectivity:
Ensure all firmware and software is up to date. You can refer to UniFi Updates for more information on automatic update management. Please refer to community.ui.com/releases for our latest release notes.
Use a full stack of Ubiquiti equipment, including a gateway (including DHCP server), APs, and switches for maximum compatibility.
Use the default settings when creating a new WiFi SSID. These settings have been selected to achieve maximum compatibility, as supported by continuous quality testing.
Maintain sufficient signal strength on all of your client devices. We recommend at least -65dBm. You may need to increase AP TX Power, move client devices closer to an AP, or install more APs to increase your coverage area.
If you are experiencing client disconnections, please note that connectivity can be affected by your settings, client specifications, and any interference related to utilization or RF environment congestion.
Consider the suggestions below:
Disable Protected Management Frames (PMF) for Improved Compatibility We recommend disabling PMF to maximize compatibility. Many devices, especially legacy ones, are incompatible with PMF and experience resulting connectivity issues..
Use a Basic WPA2 Security Mode WPA3 requires PMF which, as mentioned, may create client connectivity issues.
Furthermore, we recommend testing with a non-enterprise security mode. Enterprise modes use RADIUS servers to authenticate clients. This adds an additional layer of complexity in order to verify clear communication between clients and their server, as well as whether or not the server is properly configured.
Reduce the Minimum Data Rate to Improve Legacy Device Compatibility The default minimum data rate for the 2.4 GHz channel is set at 1 Mbps to maximize compatibility. This is because some clients, particularly legacy devices (802.11b), require a low data rate in order to connect. If you have changed this value and noticed issues specific to legacy clients, we recommend setting it back to 1 Mbps.
Properly Configure the DTIM Period The DTIM Period is a WiFi SSID setting that tells clients when to “wake”. Having a period that is too high may result in the device disconnections. We recommend:
2.4GHz = 1
5GHz = 3
Select Non-Overlapping and Low-Interference Channels We recommend enabling Nightly Channel Optimization to ensure you are on the least-crowded, non-overlapping channels. Your network will continue to work during nightly scans.
Wireless clients use a shared airspace for communication. This is true for all devices in a given area, even if they are not connected to your network (e.g., your neighbor has a lot of IoT devices). This is why having high-density deployments may contribute to speed or connectivity issues.
If you prefer to manually assign channels, here are a couple of rules to keep in mind:
If you must use 2.4 GHz, you should only ever use Channel 1, 6, or 11. These will optimize connectivity since they are the only non-overlapping channels.
Nearby APs should use different channels. If you have three APs, you can set one each to Channel 1, 6, and 11 on the 2.4 GHz band. This concept applies to 5 GHz as well.
You can perform an RF Scan in the UniFi Network Application to identify channels with the lowest interference. Unlike Nightly Channel Optimization, this scan may interrupt client connectivity while in progress..
Decrease Channel Width UniFi Network supports the following channel widths:
Although larger channel widths enable faster speeds, they result in more interference and decreased range. If you have a high-density deployment or high utilization, we recommend reducing your channel widths.
Use Band Steering to Move Compatible Clients to 5 GHz The 2.4 GHz band is generally much more congested than 5 GHz. This congestion can result in dropped packets and device disconnections. We recommend enabling Band Steering in your WiFi SSID settings to prioritize the movement of all compatibility clients to the 5 GHz band.
Increase Your Minimum Data Rate to Reduce Network Congestion As mentioned, some clients require you to reduce the Minimum Data Rate to maximize their compatibility. However, there are instances where increasing it may be more beneficial for high-density deployments in a congested RF environment.
Increasing this rate will ensure more efficient airtime utilization, which may resolve client connectivity and packet dropping issues. Please exercise caution when modifying this rate as it can also negatively impact client connectivity if incorrectly tuned.
Enable Multicast and Broadcast Control to Reduce Network Congestion Multicast and broadcast traffic drastically increase utilization, which may create more interference in crowded environments. Multicast and Broadcast Control is a WiFi SSID setting that will block all multicast and broadcast traffic, thus drastically reducing congestion.
You should add exceptions for any devices that require multicast or broadcast traffic. For example, failing to add exceptions for your gateway and/or DHCP server will prevent clients from obtaining IP addresses, and thus being unable to connect to your network.
Reduce TX Power to Reduce Network Congestion We recommend keeping TX Power set to High or Auto to maximize signal strength for clients. However, if you can reduce the signal strength and still maintain full coverage, this may reduce interference.
Please use our Design Center or the Signal Mapper in the WiFiman mobile app (iOS / Android) to assess your deployment’s WiFi coverage needs.
Dynamic Frequency Selection (DFS) consists of 5 GHz channels that are normally reserved for things like radar, military, weather, or satellite communication. Although these channels offer increased availability and less interference, wireless clients will disconnect if radar events are detected. This is a compliance requirement that varies by country, often ranging from 1 minute to 10 minutes. These channels are only recommended in areas that do not encounter these external radar events.
Disable Minimum RSSI Minimum RSSI sets a signal strength threshold. All devices that fall below it are automatically disconnected from your network. The purpose of this setting is to facilitate roaming within deployments with tightly-packed APs. If it is set incorrectly, though, you may experience client instability.
Expedite Your Support Request
Prior to reaching out to support, we recommend gathering/verifying the following information. Including these details in your request will expedite your support experience.
Is the issue affecting all of your clients, or just specific ones? What is the make and model of the affected device(s)?
Is the issue affecting all of your APs, or just specific ones? What is the model and firmware version of the AP(s)? You can refer to community.ui.com/releases for the latest available versions.
Is your issue related to establishing connectivity or keeping it?
What is the maximum number of concurrent wireless clients connected at a given time?
Does rebooting your AP improve connectivity?
Did this issue start after an AP firmware or UniFi Network update?
Does this issue occur frequently, randomly, during specific times, in certain locations, or at particular proximities from your AP?
In addition to the information above, it is beneficial to share the appropriate support logs after the issue occurs. To obtain these:
1. Enable Syslog and Syslog & Netconsole in the System settings of your Network Application.
2. Once the issue occurs, download the appropriate support file. Users with a UniFi OS Console should obtain the logs from the UniFi OS settings (*.tgz extension), whereas users who downloaded a self-hosted copy of the Network Application can obtain their support file from the Network Application settings (*.supp extension). More details can be found here.
3. You should provide the MAC Address(es) of the client(s) experiencing the issue, along with the timestamp of when this issue occurred. This will help us identify the relevant information from the files you provide.
Check out our UniFi Expert’s Corner video for a quick overview of wireless speeds. Follow these guidelines, and those in Optimizing Wired Network Speeds, to maximize your total network throughput.
Introduction
Wireless throughput is affected by more than just how you configure your network and UniFi Access Points (APs). This article will explore the most common causes of slow speeds and provide suggestions for improving them.
Before you continue, please note that maximized speeds are not the ultimate benchmark of a high-performance network. For context, streaming Ultra HD content on Netflix only requires 25 Mbps of bandwidth. Achieving the highest rate possible isn’t required to ensure quality connectivity. As such, your most pressing concern should be achieving stable speed and bandwidth rates that reliably support all connected devices.
Setting Realistic Expectations
Unlike wired connections that support full-duplex communication, wireless communication is half-duplex. This means that a 1 Gbps wireless connection can only support a simultaneous upload/download speed of 500 Mbps.
Furthermore, wireless protocol overheads typically result in 25-40% speed reduction compared to the theoretical maximum. This applies to all vendors and wireless access points.
In general, it is safe to assume that you are in good shape if you are achieving ~50% of your theoretical maximum speeds.
Recommendations
Increase Your Channel Width
Larger channel widths allow for faster speeds. Doubling your channel width will nearly double your wireless speed. Increase widths cautiously, though, as this will decrease your WiFi range and could increase channel interference. High-density or crowded RF environments with a large channel width can decrease network performance and cause more device disconnections.
UniFi Network supports the following channel widths:
Larger channel widths result in more interference. If you have a high-density deployment or high utilization, we recommend reducing your channel widths.
Use Band Steering to Move Compatible Clients to 5 GHz
UniFi APs currently only support the 2.4 and 5 GHz bands. Soon, we will launch the U6-Enterprise which will support the upcoming 6 GHz standard and deliver the fastest possible WiFi speeds. Here’s a simple breakdown of the two currently supported bands:
2.4 GHz: Delivers slower speeds and more interference, but broadcasts further due to better signal penetration through solid surfaces.
5 GHz: Delivers faster speeds and offers less-crowded channels. However, some legacy clients are incompatible with the band.
Enable Band Steering to automatically move compatible clients to the 5 GHz band.
Improve Client Signal Strength
To maximize your speeds, we recommend maintaining signal strengths between -50dbm and-60dbm. Numbers closer to zero indicate higher signal strength and throughput.
You can improve your signal strength by:
Moving clients closer to your AP.
Adding more APs to your network.
Setting your TX power to Auto or High.
Note: Increasing the transmit power of your devices can negatively impact their performance, especially in a very high density environment.
Select Non-Overlapping and Low-Interference Channels
We recommend enabling Nightly Channel Optimization to ensure you are on the least-crowded, non-overlapping channels. Your network will continue to work during nightly scans.
Wireless clients use a shared airspace for communication. This is true for all devices in a given area, even if they are not connected to your network (e.g., your neighbor has a lot of IoT devices). This is why having high-density deployments may contribute to speed or connectivity issues.
If you prefer to manually assign channels, here are a couple of rules to keep in mind:
If you must use 2.4 GHz, you should only ever use Channel 1, 6, or 11. These will optimize connectivity since they are the only non-overlapping channels.
Nearby APs should use different channels. If you have three APs, you can set one each to Channel 1, 6, and 11 on the 2.4 GHz band. This concept applies to 5 GHz as well.
You can perform an RF Scan in the UniFi Network Application to identify channels with the lowest interference. Unlike Nightly Channel Optimization, this scan may interrupt client connectivity while in progress.
Use APs That Support the Latest WiFi Standards and Technology
Each AP has its own specifications (such as WiFi standard or supported MIMO streams) that affect its maximum speeds. For optimal performance, we recommend our WiFi 6 access points.
For more details about U6 APs, please visit the UI Store, or review their respective datasheets.
Ensure That Your Clients Support the Latest WiFi Technology
Client specifications are just as important as your AP’s. A legacy client connected to the 2.4 GHz band using the WiFi 1 (802.11b) standard with 1×1 MIMO support will never be able to experience the benefits of your U6 Pro (e.g., 5 GHz WiFi 6 connectivity, 4×4 MU-MIMO and OFDMA functionality, etc.).
Remove Upstream Bottlenecks from Your Network
It is important to identify any bottlenecks throttling your speeds. For example, a wireless client will never achieve a 25 Mbps Netflix stream if it is limited by a 10 Mbps Internet connection or switch port / Ethernet connection upstream.
Minimize Meshed Network Usage
It is always preferable to hardwire APs to your network. Wirelessly meshing APs typically results in a ~50% throughput reduction per hop. If you prefer a meshed network, we recommend no more than two hops between a downstream AP and its first hardwired uplink.
Expedite Your Support Request
Prior to reaching out to support, we recommend gathering/verifying the following information. Including these details in your request will expedite your support experience.
What are your expected speeds?
How widespread is your throughput issue? Does it affect wired clients, wireless ones, both, or just certain devices?
What is your channel width? You can find this in your Global AP Settings, or by opening the device details panel of a specific AP.
Also, please include the following information, which can be found by selecting the affected device(s) on the Client Device page in your Network application.
Make and model
Band utilization (2.4 or 5GHz)
MIMO support (e.g., 1×1, 2×2)
WiFi standard (e.g., WiFi 5, WiFi 6)
Signal strength while experiencing reduced throughput
A mesh network consists of APs that are wirelessly connected to each other, as opposed to everything being hardwired to your network. This enables you to minimize dead-zones and create a continuous wireless network when it is difficult to run a cable to certain locations.
Note: Wireless Meshing must be enabled in your Network Application settings.
Mesh networks should only be used to supplement a wired network.
It is always preferable to hardwire your equipment to your central router/gateway for optimal performance and stability. This is because meshed networks are heavily impacted by the RF environment. Too much noise may result in client disconnections, or even your AP becoming disconnected from its uplink.
Minimize the number of wireless “hops”.
Although you can uplink one wireless AP to another wireless AP, this is not recommended. Each “hop” will reduce stability, and will also result in nearly 50% performance decrease.
Make sure there is a strong signal between your wirelessly meshed APs.
We recommend having a signal strength of at least -60 dBm between your wireless AP and its wired uplink. Lesser signal strengths may result in both performance and stability issues.
We recommend most users to stick with our default settings.
UniFi will automatically pick the best AP to uplink to, as well as the channel on which the APs are wirelessly connected. Although you can set these parameters manually, we advise most users to remain on the default settings because an incorrect configuration has the potential to completely break your meshed network.
Note: Both APs must use the same channel or else you risk breaking your meshed connection.
A virtual private network (VPN) allows a client to join a network remotely via an encrypted connection. VPNs offer many benefits:
Securely share resources between multiple office branches, or grant access to network resources from a remote location.
Moderate activity and impose network-specific traffic and routing policies for remote connections.
Mask IP addresses when accessing the internet.
UniFi supports several types of VPNs. This article will outline their specific benefits and use cases.
Note: A UniFi gateway is required to use the VPNs profiled below.
VPN Types
Teleport
Teleport is a one-click VPN that allows clients to remotely connect to networks hosted by a UniFi gateway via the WiFiman mobile app (iOS / Android). With WiFiman, you can remotely access local network resources, like connected storage drives. Utilizing Wireguard VPN technology, Teleport delivers reliable, high-speed connectivity and requires zero configuration. We recommend Teleport for most users seeking to set up a VPN.
VPN Server
A VPN server also allows clients to remotely connect to a network hosted by a UniFi gateway. Unlike Teleport, you must configure your UniFi gateway and the clients that will be using the VPN. We only recommend setting up a VPN server if you need to connect remote clients that cannot use the WiFiman mobile app. Otherwise, Teleport is likely a more suitable option because of its streamlined configuration and reliably high performance.
Site-to-site VPNs connect multiple sites with an encrypted “VPN tunnel” to create a single secure connection between all ‘local’ networks. This is perfect for two-way resource sharing across multiple locations. As such, site-to-site VPNs are primarily used by larger organizations that span multiple locations. They are not recommended for most home users.
This VPN sends some, or all, of your network traffic through a third-party VPN server. This is useful for those that prefer to mask their public IP addresses while they access the internet.
VPN Client also allows devices that don’t natively support VPN usage to connect to one. For example, when configuring a UniFi VPN server, we mentioned that each connected client must be configured individually. This isn’t a problem for most smartphones, laptops, or PCs, but some clients, like IoT devices or smart TVs, are not designed to remotely connect to other networks. VPN Client circumvents this by allowing your UniFi gateway to send their traffic through the VPN, instead of the devices themselves.
VPN Comparison
Teleport
VPN Server
Site-to-Site
VPN Client
Purpose
Allow users to remotely connect to a local network and access network resources (e.g., a local storage drive).
Allow users to remotely connect to a local network and access network resources (e.g., a local storage drive).
Combine multiple sites to create a single, secure connection allowing two-way resource sharing.
Direct local network client traffic through a third-party VPN server to mask their IP addresses and/or locations.
Recommended Users
Users connecting to their home network from a different location.
Remote employees connecting to their company’s network from home.
Office employees connecting to other branch networks.
Network administrators sending specific network traffic through a third-party VPN server.
Setup Requirements
One-click VPN that requires zero-configuration.
Set up on a UniFi gateway. Each connected client must be individually configured.
A gateway at each connected site must be configured.
UniFi gateways must be loaded with a configuration file provided by the third-party VPN provider.
How Users Connect
Each client has its own connection with the UniFi gateway.
Each client has its own connection with the UniFi gateway.
Users share the same connection that tethers multiple sites.
The UniFi gateway establishes a single connection with the third-party VPN.
These statistics are based on detection verdicts of Kaspersky products and services received from users who consented to providing statistical data.
Quarterly figures
According to Kaspersky Security Network, in Q2 2022:
Kaspersky solutions blocked 1,164,544,060 attacks from online resources across the globe.
Web Anti-Virus recognized 273,033,368 unique URLs as malicious. Attempts to run malware for stealing money from online bank accounts were stopped on the computers of 100,829 unique users.
Ransomware attacks were defeated on the computers of 74,377 unique users.
Number of unique users attacked by financial malware, Q2 2022 (download)
Geography of financial malware attacks
To evaluate and compare the risk of being infected by banking Trojans and ATM/POS malware worldwide, for each country and territory we calculated the share of Kaspersky users who faced this threat during the reporting period as a percentage of all users of our products in that country or territory.
Geography of financial malware attacks, Q2 2022 (download)
TOP 10 countries and territories by share of attacked users
Country or territory*
%**
1
Turkmenistan
4.8
2
Afghanistan
4.3
3
Tajikistan
3.8
4
Paraguay
3.1
5
China
2.4
6
Yemen
2.4
7
Uzbekistan
2.2
8
Sudan
2.1
9
Egypt
2.0
10
Mauritania
1.9
* Excluded are countries and territories with relatively few Kaspersky product users (under 10,000). ** Unique users whose computers were targeted by financial malware as a percentage of all unique users of Kaspersky products in the country.
TOP 10 banking malware families
Name
Verdicts
%*
1
Ramnit/Nimnul
Trojan-Banker.Win32.Ramnit
35.5
2
Zbot/Zeus
Trojan-Banker.Win32.Zbot
15.8
3
CliptoShuffler
Trojan-Banker.Win32.CliptoShuffler
6.4
4
Trickster/Trickbot
Trojan-Banker.Win32.Trickster
6
5
RTM
Trojan-Banker.Win32.RTM
2.7
6
SpyEye
Trojan-Spy.Win32.SpyEye
2.3
7
IcedID
Trojan-Banker.Win32.IcedID
2.1
8
Danabot
Trojan-Banker.Win32.Danabot
1.9
9
BitStealer
Trojan-Banker.Win32.BitStealer
1.8
10
Gozi
Trojan-Banker.Win32.Gozi
1.3
* Unique users who encountered this malware family as a percentage of all users attacked by financial malware.
Ransomware programs
Quarterly trends and highlights
In the second quarter, the Lockbit group launched a bug bounty program. The cybercriminals are promising $1,000 to $1,000,000 for doxing of senior officials, reporting web service, Tox messenger or ransomware Trojan algorithm vulnerabilities, as well as for ideas on improving the Lockbit website and Trojan. This was the first-ever case of ransomware groups doing a (self-promotion?) campaign like that.
Another well-known group, Conti, said it was shutting down operations. The announcement followed a high-profile attack on Costa Rica’s information systems, which prompted the government to declare a state of emergency. The Conti infrastructure was shut down in late June, but some in the infosec community believe that Conti members are either just rebranding or have split up and joined other ransomware teams, including Hive, AvosLocker and BlackCat.
While some ransomware groups are drifting into oblivion, others seem to be making a comeback. REvil’s website went back online in April, and researchers discovered a newly built specimen of their Trojan. This might have been a test build, as the sample did not encrypt any files, but these events may herald the impending return of REvil.
Kaspersky researchers found a way to recover files encrypted by the Yanluowang ransomware and released a decryptor for all victims. Yanluowang has been spotted in targeted attacks against large businesses in the US, Brazil, Turkey, and other countries.
Number of new modifications
In Q2 2022, we detected 15 new ransomware families and 2355 new modifications of this malware type.
Geography of attacks by ransomware Trojans, Q2 2022 (download)
TOP 10 countries and territories attacked by ransomware Trojans
Country or territory*
%**
1
Bangladesh
1.81
2
Yemen
1.24
3
South Korea
1.11
4
Mozambique
0.82
5
Taiwan
0.70
6
China
0.46
7
Pakistan
0.40
8
Angola
0.37
9
Venezuela
0.33
10
Egypt
0.32
* Excluded are countries and territories with relatively few Kaspersky users (under 50,000). ** Unique users whose computers were attacked by Trojan encryptors as a percentage of all unique users of Kaspersky products in the country.
* Statistics are based on detection verdicts of Kaspersky products. The information was provided by Kaspersky product users who consented to provide statistical data. ** Unique Kaspersky users attacked by specific ransomware Trojan families as a percentage of all unique users attacked by ransomware Trojans.
Miners
Number of new miner modifications
In Q2 2022, Kaspersky solutions detected 40,788 new modifications of miners. A vast majority of these (more than 35,000) were detected in June. Thus, the spring depression — in March through May we found a total of no more than 10,000 new modifications — was followed by a record of sorts.
Number of new miner modifications, Q2 2022 (download)
Number of users attacked by miners
In Q2, we detected attacks using miners on the computers of 454,385 unique users of Kaspersky products and services worldwide. We are seeing a reverse trend here: miner attacks have gradually declined since the beginning of 2022.
TOP 10 countries and territories attacked by miners
Country or territory*
%**
1
Rwanda
2.94
2
Ethiopia
2.67
3
Tajikistan
2.35
4
Tanzania
1.98
5
Kyrgyzstan
1.94
6
Uzbekistan
1.88
7
Kazakhstan
1.84
8
Venezuela
1.80
9
Mozambique
1.68
10
Ukraine
1.56
* Excluded are countries and territories with relatively few users of Kaspersky products (under 50,000). ** Unique users attacked by miners as a percentage of all unique users of Kaspersky products in the country.
Vulnerable applications used by criminals during cyberattacks
Quarterly highlights
During Q2 2022, a number of major vulnerabilities were discovered in the Microsoft Windows. For instance, CVE-2022-26809 critical error allows an attacker to remotely execute arbitrary code in a system using a custom RPC request. The Network File System (NFS) driver was found to contain two RCE vulnerabilities: CVE-2022-24491 and CVE-2022-24497. By sending a custom network message via the NFS protocol, an attacker can remotely execute arbitrary code in the system as well. Both vulnerabilities affect server systems with the NFS role activated. The CVE-2022-24521 vulnerability targeting the Common Log File System (CLFS) driver was found in the wild. It allows elevation of local user privileges, although that requires the attacker to have gained a foothold in the system. CVE-2022-26925, also known as LSA Spoofing, was another vulnerability found during live operation of server systems. It allows an unauthenticated attacker to call an LSARPC interface method and get authenticated by Windows domain controller via the NTLM protocol. These vulnerabilities are an enduring testament to the importance of timely OS and software updates.
Most of the network threats detected in Q2 2022 had been mentioned in previous reports. Most of those were attacks that involved brute-forcing access to various web services. The most popular protocols and technologies susceptible to these attacks include MS SQL Server, RDP and SMB. Attacks that use the EternalBlue, EternalRomance and similar exploits are still popular. Exploitation of Log4j vulnerability (CVE-2021-44228) is also quite common, as the susceptible Java library is often used in web applications. Besides, the Spring MVC framework, used in many Java-based web applications, was found to contain a new vulnerability CVE-2022-22965 that exploits the data binding functionality and results in remote code execution. Finally, we have observed a rise in attacks that exploit insecure deserialization, which can also result in access to remote systems due to incorrect or missing validation of untrusted user data passed to various applications.
Vulnerability statistics
Exploits targeting Microsoft Office vulnerabilities grew in the second quarter to 82% of the total. Cybercriminals were spreading malicious documents that exploited CVE-2017-11882 and CVE-2018-0802, which are the best-known vulnerabilities in the Equation Editor component. Exploitation involves the component memory being damaged and a specially designed script, run on the target computer. Another vulnerability, CVE-2017-8570, allows downloading and running a malicious script when opening an infected document, to execute various operations in a vulnerable system. The emergence of CVE-2022-30190or Follina vulnerability also increased the number of exploits in this category. An attacker can use a custom malicious document with a link to an external OLE object, and a special URI scheme to have Windows run the MSDT diagnostics tool. This, in turn, combined with a special set of parameters passed to the victim’s computer, can cause an arbitrary command to be executed — even if macros are disabled and the document is opened in Protected Mode.
Distribution of exploits used by cybercriminals, by type of attacked application, Q2 2022 (download)
Attempts at exploiting vulnerabilities that affect various script engines and, specifically, browsers, dipped to 5%. In the second quarter, a number of critical RCE vulnerabilities were discovered in various Google Chrome based browsers: CVE-2022-0609, CVE-2022-1096, and CVE-2022-1364. The first one was found in the animation component; it exploits a Use-After-Free error, causing memory damage, which is followed by the attacker creating custom objects to execute arbitrary code. The second and third vulnerabilities are Type Confusion errors associated with the V8 script engine; they also can result in arbitrary code being executed on a vulnerable user system. Some of the vulnerabilities discovered were found to have been exploited in targeted attacks, in the wild. Mozilla Firefox was found to contain a high-risk Use-After-Free vulnerability, CVE-2022-1097, which appears when processing NSSToken-type objects from different streams. The browser was also found to contain CVE-2022-28281, a vulnerability that affects the WebAuthn extension. A compromised Firefox content process can write data out of bounds of the parent process memory, thus potentially enabling code execution with elevated privileges. Two further vulnerabilities, CVE-2022-1802 and CVE-2022-1529, were exploited in cybercriminal attacks. The exploitation method, dubbed “prototype pollution”, allows executing arbitrary JavaScript code in the context of a privileged parent browser process.
As in the previous quarter, Android exploits ranked third in our statistics with 4%, followed by exploits of Java applications, the Flash platform, and PDF documents, each with 3%.
Attacks on macOS
The second quarter brought with it a new batch of cross-platform discoveries. For instance, a new APT group Earth Berberoka (GamblingPuppet) that specializes in hacking online casinos, uses malware for Windows, Linux, and macOS. The TraderTraitor campaign targets cryptocurrency and blockchain organizations, attacking with malicious crypto applications for both Windows and macOS.
TOP 20 threats for macOS
Verdict
%*
1
AdWare.OSX.Amc.e
25.61
2
AdWare.OSX.Agent.ai
12.08
3
AdWare.OSX.Pirrit.j
7.84
4
AdWare.OSX.Pirrit.ac
7.58
5
AdWare.OSX.Pirrit.o
6.48
6
Monitor.OSX.HistGrabber.b
5.27
7
AdWare.OSX.Agent.u
4.27
8
AdWare.OSX.Bnodlero.at
3.99
9
Trojan-Downloader.OSX.Shlayer.a
3.87
10
Downloader.OSX.Agent.k
3.67
11
AdWare.OSX.Pirrit.aa
3.35
12
AdWare.OSX.Pirrit.ae
3.24
13
Backdoor.OSX.Twenbc.e
3.16
14
AdWare.OSX.Bnodlero.ax
3.06
15
AdWare.OSX.Agent.q
2.73
16
Trojan-Downloader.OSX.Agent.h
2.52
17
AdWare.OSX.Bnodlero.bg
2.42
18
AdWare.OSX.Cimpli.m
2.41
19
AdWare.OSX.Pirrit.gen
2.08
20
AdWare.OSX.Agent.gen
2.01
* Unique users who encountered this malware as a percentage of all users of Kaspersky security solutions for macOS who were attacked.
As usual, the TOP 20 ranking for threats detected by Kaspersky security solutions for macOS users is dominated by various adware. AdWare.OSX.Amc.e, also known as Advanced Mac Cleaner, is a newcomer and already a leader, found with a quarter of all attacked users. Members of this family display fake system problem messages, offering to buy the full version to fix those. It was followed by members of the AdWare.OSX.Agent and AdWare.OSX.Pirrit families.
Geography of threats for macOS, Q2 2022 (download)
TOP 10 countries and territories by share of attacked users
Country or territory*
%**
1
France
2.93
2
Canada
2.57
3
Spain
2.51
4
United States
2.45
5
India
2.24
6
Italy
2.21
7
Russian Federation
2.13
8
United Kingdom
1.97
9
Mexico
1.83
10
Australia
1.82
* Excluded from the rating are countries and territories with relatively few users of Kaspersky security solutions for macOS (under 10,000). ** Unique users attacked as a percentage of all users of Kaspersky security solutions for macOS in the country.
In Q2 2022, the country where the most users were attacked was again France (2.93%), followed by Canada (2.57%) and Spain (2.51%). AdWare.OSX.Amc.e was the most common adware encountered in these three countries.
IoT attacks
IoT threat statistics
In Q2 2022, most devices that attacked Kaspersky traps did so using the Telnet protocol, as before.
Telnet
82,93%
SSH
17,07%
Distribution of attacked services by number of unique IP addresses of attacking devices, Q2 2022
The statistics for working sessions with Kaspersky honeypots show similar Telnet dominance.
Telnet
93,75%
SSH
6,25%
Distribution of cybercriminal working sessions with Kaspersky traps, Q2 2022
TOP 10 threats delivered to IoT devices via Telnet
Verdict
%*
1
Backdoor.Linux.Mirai.b
36.28
2
Trojan-Downloader.Linux.NyaDrop.b
14.66
3
Backdoor.Linux.Mirai.ek
9.15
4
Backdoor.Linux.Mirai.ba
8.82
5
Trojan.Linux.Agent.gen
4.01
6
Trojan.Linux.Enemybot.a
2.96
7
Backdoor.Linux.Agent.bc
2.58
8
Trojan-Downloader.Shell.Agent.p
2.36
9
Trojan.Linux.Agent.mg
1.72
10
Backdoor.Linux.Mirai.cw
1.45
* Share of each threat delivered to infected devices as a result of a successful Telnet attack out of the total number of delivered threats.
The statistics in this section are based on Web Anti-Virus, which protects users when malicious objects are downloaded from malicious/infected web pages. Cybercriminals create these sites on purpose; they can infect hacked legitimate resources as well as web resources with user-created content, such as forums.
TOP 10 countries and territories that serve as sources of web-based attacks
The following statistics show the distribution by country or territory of the sources of Internet attacks blocked by Kaspersky products on user computers (web pages with redirects to exploits, sites hosting malicious programs, botnet C&C centers, etc.). Any unique host could be the source of one or more web-based attacks.
To determine the geographic source of web attacks, the GeoIP technique was used to match the domain name to the real IP address at which the domain is hosted.
In Q2 2022, Kaspersky solutions blocked 1,164,544,060 attacks launched from online resources across the globe. A total of 273,033,368 unique URLs were recognized as malicious by Web Anti-Virus components.
Distribution of web-attack sources by country and territory, Q2 2022 (download)
Countries and territories where users faced the greatest risk of online infection
To assess the risk of online infection faced by users around the world, for each country or territory we calculated the percentage of Kaspersky users on whose computers Web Anti-Virus was triggered during the quarter. The resulting data provides an indication of the aggressiveness of the environment in which computers operate in different countries and territories.
Note that these rankings only include attacks by malicious objects that fall under the Malware class; they do not include Web Anti-Virus detections of potentially dangerous or unwanted programs, such as RiskTool or adware.
Country or territory*
%**
1
Taiwan
26.07
2
Hong Kong
14.60
3
Algeria
14.40
4
Nepal
14.00
5
Tunisia
13.55
6
Serbia
12.88
7
Sri Lanka
12.41
8
Albania
12.21
9
Bangladesh
11.98
10
Greece
11.86
11
Palestine
11.82
12
Qatar
11.50
13
Moldova
11.47
14
Yemen
11.44
15
Libya
11.34
16
Zimbabwe
11.15
17
Morocco
11.03
18
Estonia
11.01
19
Turkey
10.75
20
Mongolia
10.50
* Excluded are countries and territories with relatively few Kaspersky users (under 10,000). ** Unique users targeted by Malware-class attacks as a percentage of all unique users of Kaspersky products in the country.
On average during the quarter, 8.31% of the Internet users’ computers worldwide were subjected to at least one Malware-class web attack.
Geography of web-based malware attacks, Q2 2022 (download)
Local threats
In this section, we analyze statistical data obtained from the OAS and ODS modules of Kaspersky products. It takes into account malicious programs that were found directly on users’ computers or removable media connected to them (flash drives, camera memory cards, phones, external hard drives), or which initially made their way onto the computer in non-open form (for example, programs in complex installers, encrypted files, etc.).
In Q2 2022, our File Anti-Virus detected 55,314,176 malicious and potentially unwanted objects.
Countries and territories where users faced the highest risk of local infection
For each country, we calculated the percentage of Kaspersky product users on whose computers File Anti-Virus was triggered during the reporting period. These statistics reflect the level of personal computer infection in different countries and territories.
Note that these rankings only include attacks by malicious programs that fall under the Malware class; they do not include File Anti-Virus triggerings in response to potentially dangerous or unwanted programs, such as RiskTool or adware.
Country or territory*
%**
1
Turkmenistan
47.54
2
Tajikistan
44.91
3
Afghanistan
43.19
4
Yemen
43.12
5
Cuba
42.71
6
Ethiopia
41.08
7
Uzbekistan
37.91
8
Bangladesh
37.90
9
Myanmar
36.97
10
South Sudan
36.60
11
Syria
35.60
12
Burundi
34.88
13
Rwanda
33.69
14
Algeria
33.61
15
Benin
33.60
16
Tanzania
32.88
17
Malawi
32.65
18
Venezuela
31.79
19
Cameroon
31.34
20
Chad
30.92
* Excluded are countries with relatively few Kaspersky users (under 10,000). ** Unique users on whose computers Malware-class local threats were blocked, as a percentage of all unique users of Kaspersky products in the country.
Earlier this year, we discovered a malicious campaign that employed a new technique for installing fileless malware on target machines by injecting a shellcode directly into Windows event logs. The attackers were using this to hide a last-stage Trojan in the file system.
The attack starts by driving targets to a legitimate website and tricking them into downloading a compressed RAR file that is booby-trapped with the network penetration testing tools Cobalt Strike and SilentBreak. The attackers use these tools to inject code into any process of their choosing. They inject the malware directly into the system memory, leaving no artifacts on the local drive that might alert traditional signature-based security and forensics tools. While fileless malware is nothing new, the way the encrypted shellcode containing the malicious payload is embedded into Windows event logs is.
The code is unique, with no similarities to known malware, so it is unclear who is behind the attack.
WinDealer’s man-on-the-side spyware
We recently published our analysis of WinDealer: malware developed by the LuoYu APT threat actor. One of the most interesting aspects of this campaign is the group’s use of a man-on-the-side attack to deliver malware and control compromised computers. A man-on-the-side attack implies that the attacker is able to control the communication channel, allowing them to read the traffic and inject arbitrary messages into normal data exchange. In the case of WinDealer, the attackers intercepted an update request from completely legitimate software and swapped the update file with a weaponized one.
The malware does not contain the exact address of the C2 (command-and-control) server, making it harder for security researchers to find it. Instead, it tries to access a random IP address from a predefined range. The attackers then intercept the request and respond to it. To do this, they need constant access to the routers of the entire subnet, or to some advanced tools at ISP level.
The vast majority of WinDealer’s targets are located in China: foreign diplomatic organizations, members of the academic community, or companies active in the defense, logistics or telecoms sectors. Sometimes, though, the LuoYu APT group will infect targets in other countries: Austria, the Czech Republic, Germany, India, Russia and the US. In recent months, they have also become more interested in businesses located in other East Asian countries and their China-based offices.
ToddyCat: previously unknown threat actor attacks high-profile organizations in Europe and Asia
In June, we published our analysis of ToddyCat, a relatively new APT threat actor that we have not been able to link to any other known actors. The first wave of attacks, against a limited number of servers in Taiwan and Vietnam, targeted Microsoft Exchange servers, which the threat actor compromised with Samurai, a sophisticated passive backdoor that typically works via ports 80 and 443. The malware allows arbitrary C# code execution and is used alongside multiple modules that let the attacker administer the remote system and move laterally within the targeted network. In certain cases, the attackers have used the Samurai backdoor to launch another sophisticated malicious program, which we dubbed Ninja. This is probably a component of an unknown post-exploitation toolkit exclusively used by ToddyCat.
The next wave saw a sudden surge in attacks, as the threat actor began abusing the ProxyLogon vulnerability to target organizations in multiple countries, including Iran, India, Malaysia, Slovakia, Russia and the UK.
Subsequently, we observed other variants and campaigns, which we attributed to the same group. In addition to affecting most of the previously mentioned countries, the threat actor targeted military and government organizations in Indonesia, Uzbekistan and Kyrgyzstan. The attack surface in the third wave was extended to desktop systems.
SessionManager IIS backdoor
In 2021, we observed a trend among certain threat actors for deploying a backdoor within IIS after exploiting one of the ProxyLogon-type vulnerabilities in Microsoft Exchange. Dropping an IIS module as a backdoor enables threat actors to maintain persistent, update-resistant and relatively stealthy access to the IT infrastructure of a target organization — to collect emails, update further malicious access or clandestinely manage compromised servers.
We published our analysis of one such IIS backdoor, called Owowa, last year. Early this year, we investigated another, SessionManager. Developed in C++, SessionManager is a malicious native-code IIS module. The attackers’ aim is for it to be loaded by some IIS applications, to process legitimate HTTP requests that are continuously sent to the server. This kind of malicious modules usually expects seemingly legitimate but specifically crafted HTTP requests from their operators, triggers actions based on the operators’ hidden instructions and then transparently passes the request to the server for it to be processed just as any other request.
As a result, these modules are not easily spotted through common monitoring practices.
SessionManager has been used to target NGOs and government organizations in Africa, South America, Asia, Europe and the Middle East.
We believe that this malicious IIS module may have been used by the GELSEMIUM threat actor, because of similar victim profiles and the use of a common OwlProxy variant.
Other malware
Spring4Shell
Late in March, researchers discovered a critical vulnerability (CVE-2022-22965) in Spring, an open-source framework for the Java platform. This is a Remote Code Execution (RCE) vulnerability, allowing an attacker to execute malicious code remotely on an unpatched computer. The vulnerability affects the Spring MVC and Spring WebFlux applications running under version 9 or later of the Java Development Kit. By analogy with the well-known Log4Shell vulnerability, this one was dubbed “Spring4Shell”.
By the time researchers had reported it to VMware, a proof-of-concept exploit had already appeared on GitHub. It was quickly removed, but it is unlikely that cybercriminals would have failed to notice such a potentially dangerous vulnerability.
You can find more details, including appropriate mitigation steps, in our blog post.
Actively exploited vulnerability in Windows
Among the vulnerabilities fixed in May’s “Patch Tuesday” update was one that has been actively exploited in the wild. The Windows LSA (Local Security Authority) Spoofing Vulnerability (CVE-2022-26925) is not considered critical per se. However, when the vulnerability is used in a New Technology LAN Manager (NTLM) relay attack, the combined CVSSv3 score for the attack-chain is 9.8. The vulnerability, which allows an unauthenticated attacker to force domain controllers to authenticate with an attacker’s server using NTLM, was already being exploited in the wild as a zero-day, making it a priority to patch it.
Follina vulnerability in MSDT
At the end of May, researchers with the nao_sec team reported a new zero-day vulnerability in MSDT (the Microsoft Support Diagnostic Tool) that can be exploited using a malicious Microsoft Office document. The vulnerability, which has been designated as CVE-2022-30190 and has also been dubbed “Follina”, affects all operating systems in the Windows family, both for desktops and servers.
MSDT is used to collect diagnostic information and send it to Microsoft when something goes wrong with Windows. It can be called up from other applications via the special MSDT URL protocol; and an attacker can run arbitrary code with the privileges of the application that called up the MSD: in this case, the permissions of the user who opened the malicious document.
Kaspersky has observed attempts to exploit this vulnerability in the wild; and we would expect to see more in the future, including ransomware attacks and data breaches.
BlackCat: a new ransomware gang
It was only a matter of time before another ransomware group filled the gap left by REvil and BlackMatter shutting down operations. Last December, advertisements for the services of the ALPHV group, also known as BlackCat, appeared on hacker forums, claiming that the group had learned from the errors of their predecessors and created an improved version of the malware.
The BlackCat creators use the ransomware-as-a-service (RaaS) model. They provide other attackers with access to their infrastructure and malicious code in exchange for a cut of the ransom. BlackCat gang members are probably also responsible for negotiating with victims. This is one reason why BlackCat has gained momentum so quickly: all that a “franchisee” has to do is obtain access to the target network.
The group’s arsenal comprises several elements. One is the cryptor. This is written in the Rust language, allowing the attackers to create a cross-platform tool with versions of the malware that work both in Windows and Linux environments. Another is the Fendr utility (also known as ExMatter), used to exfiltrate data from the infected infrastructure. The use of this tool suggests that BlackCat may simply be a re-branding of the BlackMatter faction, since that was the only known gang to use the tool. Other tools include the PsExec tool, used for lateral movement on the victim’s network; Mimikatz, the well-known hacker software; and the Nirsoft software, used to extract network passwords.
Yanluowang ransomware: how to recover encrypted files
The name Yanluowang is a reference to the Chinese deity Yanluo Wang, one of the Ten Kings of Hell. This ransomware is relatively recent. We do not know much about the victims, although data from the Kaspersky Security Network indicates that threat actor has carried out attacks in the US, Brazil, Turkey and a few other countries.
The low number of infections is due to the targeted nature of the ransomware: the threat actor prepares and implements attacks on specific companies only.
Our experts have discovered a vulnerability that allows files to be recovered without the attackers’ key — although only under certain conditions — with the help of a known-plaintext attack. This method overcomes the encryption algorithm if two versions of the same text are available: one clean and one encrypted. If the victim has clean copies of some of the encrypted files, our upgraded Rannoh Decryptor can analyze these and recover the rest of the information.
There is one snag: Yanluowang corrupts files slightly differently depending on their size. It encrypts small (less than 3 GB) files completely, and large ones, partially. So, the decryption requires clean files of different sizes. For files smaller than 3 GB, it is enough to have the original and an encrypted version of the file that are 1024 bytes or more. To recover files larger than 3 GB, however, you need original files of the appropriate size. However, if you find a clean file larger than 3 GB, it will generally be possible to recover both large and small files.
A description of how various groups share more than half of their components and TTPs, with the core attack stages executed identically across groups.
A cyber-kill chain diagram that combines the visible intersections and common elements of the selected ransomware groups and makes it possible to predict the threat actors’ next steps.
A detailed analysis of each technique with examples of how various groups use them, and a comprehensive list of mitigations.
SIGMA rules based on the described TTPs that can be applied to SIEM solutions.
Ransomware trends in 2022
Ahead of the Anti-Ransomware Day on May 12, we took the opportunity to outline the tendencies that have characterized ransomware in 2022. In our report, we highlight several trends that we have observed.
First, we are seeing more widespread development of cross-platform ransomware, as cybercriminals seek to penetrate complex environments running a variety of systems. By using cross-platform languages such as Rust and Golang, attackers are able to port their code, which allows them to encrypt data on more computers.
Second, ransomware gangs continue to industrialize and evolve into real businesses by adopting the techniques and processes used by legitimate software companies.
Third, the developers of ransomware are adopting a political stance, involving themselves in the conflict between Russia and Ukraine.
Finally, we offer best practices that organizations should adopt to help them defend against ransomware attacks:
Keep software updated on all your devices.
Focus your defense strategy on detecting lateral movements and data exfiltration.
Enable ransomware protection for all endpoints.
Install anti-APT and EDR solutions, enabling capabilities for advanced threat discovery and detection, investigation and timely remediation of incidents.
Provide your SOC team with access to the latest threat intelligence.
Emotet’s return
Emotet has been around for eight years. When it was first discovered in 2014, its main purpose was stealing banking credentials. Subsequently, the malware underwent numerous transformations to become one of the most powerful botnets ever. Emotet made headlines in January 2021, when its operations were disrupted through the joint efforts of law enforcement agencies in several countries. This kind of “takedowns” does not necessarily lead to the demise of a cybercriminal operation. It took the cybercriminals almost ten months to rebuild the infrastructure, but Emotet did return in November 2021. At that time, the Trickbot malware was used to deliver Emotet, but it is now spreading on its own through malicious spam campaigns.
Recent Emotet protocol analysis and C2 responses suggest that Emotet is now capable of downloading sixteen additional modules. We were able to retrieve ten of these, including two different copies of the spam module, used by Emotet for stealing credentials, passwords, accounts and emails, and to spread spam.
You can read our analysis of these modules, as well as statistics on recent Emotet attacks, here.
Emotet infects both corporate and private computers all around the world. Our telemetry indicates that in the first quarter of 2022, targeted: it mostly targeted users in Italy, Russia, Japan, Mexico, Brazil, Indonesia, India, Vietnam, China, Germany and Malaysia.
Moreover, we have seen a significant growth in the number of users attacked by Emotet.
Mobile subscription Trojans
Trojan subscribers are a well-established method of stealing money from people using Android devices. These Trojans masquerade as useful apps but, once installed, silently subscribe to paid services.
The developers of these Trojans make money through commissions: they get a cut of what the person “spends”. Funds are typically deducted from the cellphone account, although in some cases, these may be debited directly to a bank card. We looked at the most notable examples that we have seen in the last twelve months, belonging to the Jocker, MobOk, Vesub and GriftHorse families.
Normally, someone has to actively subscribe to a service; providers often ask subscribers to enter a one-time code sent via SMS, to counter automated subscription attempts. To sidestep this protection, malware can request permission to access text messages; where they do not obtain this, they can steal confirmation codes from pop-up notifications about incoming messages.
Some Trojans can both steal confirmation codes from texts or notifications, and work around CAPTCHA: another means of protection against automated subscriptions. To recognize the code in the picture, the Trojan sends it to a special CAPTCHA recognition service.
Some malware is distributed through dubious sources under the guise of apps that are banned from official stores, for example, masquerading as apps for downloading content from YouTube or other streaming services, or as an unofficial Android version of GTA5. In addition, they can appear in these same sources as free versions of popular, expensive apps, such as Minecraft.
Other mobile subscription Trojans are less sophisticated. When run for the first time, they ask the user to enter their phone number, seemingly for login purposes. The subscription is issued as soon as they enter their number and click the login button, and the amount is debited to their cellphone account.
Other Trojans employ subscriptions with recurring payments. While this requires consent, the person using the phone might not realize they are signing up for regular automatic payments. Moreover, the first payment is often insignificant, with later charges being noticeably higher.
You can read more about this type of mobile Trojan, along with tips on how to avoid falling victim to it, here.
The threat from stalkerware
Over the last four years, we have published annual reports on the stalkerware situation, in particular using data from the Kaspersky Security Network. This year, our report also included the results of a survey on digital abuse commissioned by Kaspersky and several public organizations.
Stalkerware provides the digital means for a person to secretly monitor someone else’s private life and is often used to facilitate psychological and physical violence against intimate partners. The software is commercially available and can access an array of personal data, including device location, browser history, text messages, social media chats, photos and more. It may be legal to market stalkerware, although its use to monitor someone without their consent is not. Developers of stalkerware benefit from a vague legal framework that still exists in many countries.
In 2021, our data indicated that around 33,000 people had been affected by stalkerware.
The numbers were lower than what we had seen for a few years prior to that. However, it is important to remember that the decrease of 2020 and 2021 occurred during successive COVID-19 lockdowns: that is, during conditions that meant abusers did not need digital tools to monitor and control their partners’ personal lives. It is also important to bear in mind that mobile apps represent only one method used by abusers to track someone — others include tracking devices such as AirTags, laptop applications, webcams, smart home systems and fitness trackers. KSN tracks only the use of mobile apps. Finally, KSN data is taken from mobile devices protected by Kaspersky products: many people do not protect their mobile devices. The Coalition Against Stalkerware, which brings together members of the IT industry and non-profit companies, believes that the overall number of people affected by this threat might be thirty times higher — that is around a million people!
Stalkerware continues to affect people across the world: in 2021, we observed detections in 185 countries or territories.
Just as in 2020, Russia, Brazil, the US and India were the top four countries with the largest numbers of affected individuals. Interestingly, Mexico had fallen from fifth to ninth place. Algeria, Turkey and Egypt entered the top ten, replacing Italy, the UK and Saudi Arabia, which were no longer in the top ten.
We would recommend the following to reduce your risk of being targeted:
Use a unique, complex password on your phone and do not share it with anyone.
Try not to leave your phone unattended; and if you have to, lock it.
Download apps only from official stores.
Protect your mobile device with trustworthy security software and make sure it is able to detect stalkerware.
Remember also that if you discover stalkerware on your phone, dealing with the problem is not as simple as just removing the stalkerware app. This will alert the abuser to the fact that you have become aware of their activities and may precipitate physical abuse. Instead, seek help: you can find a list or organizations that can provide help and support on the Coalition Against Stalkerware site.
In H1 2022, malicious objects were blocked at least once on 31.8% of ICS computers globally.Percentage of ICS computers on which malicious objects were blocked
For the first time in five years of observations, the lowest percentage in the first half of the year was observed in March. During the period from January to March, the percentage of attacked ICS computers decreased by 1.7 p.p.Percentage of ICS computers on which malicious objects were blocked, January – June 2020, 2021, and 2022
Among regions, the highest percentage of ICS computers on which malicious objects were blocked was observed in Africa (41.5%). The lowest percentage (12.8%) was recorded in Northern Europe.Percentage of ICS computers on which malicious objects were blocked, in global regions
Among countries, the highest percentage of ICS computers on which malicious objects were blocked was recorded in Ethiopia (54.8%) and the lowest (6.8%) in Luxembourg.15 countries and territories with the highest percentage of ICS computers on which malicious objects were blocked, H1 202210 countries and territories with the lowest percentage of ICS computers on which malicious objects were blocked, H1 2022
Threat sources
The main sources of threats to computers in the operational technology infrastructure of organizations are internet (16.5%), removable media (3.5%), and email (7.0%).Percentage of ICS computers on which malicious objects from different sources were blocked
Regions
Among global regions, Africa ranked highest based on the percentage of ICS computers on which malware was blocked when removable media was connected.Regions ranked by percentage of ICS computers on which malware was blocked when removable media was connected, H1 2022
Southern Europe leads the ranking of regions by percentage of ICS computers on which malicious email attachments and phishing links were blocked.Regions ranked by percentage of ICS computers on which malicious email attachments and phishing links were blocked, H1 2022
Industry specifics
In the Building Automation industry, the percentage of ICS computers on which malicious email attachments and phishing links were blocked (14.4%) was twice the average value for the entire world (7%).Percentage of ICS computers on which malicious email attachments and phishing links were blocked, in selected industries
In the Oil and Gas industry, the percentage of ICS computers on which threats were blocked when removable media was connected (10.4%) was 3 times the average percentage for the entire world (3.5%).Percentage of ICS computers on which threats were blocked when removable media was connected
In the Oil and Gas industry, the percentage of ICS computers on which malware was blocked in network folders (1.2%) was twice the world average (0.6%).Percentage of ICS computers on which threats were blocked in network folders
Diversity of malware
Malware of different types from 7,219 families was blocked on ICS computers in H1 2022.Percentage of ICS computers on which the activity of malicious objects from different categories was prevented
Ransomware
In H1 2022, ransomware was blocked on 0.65% of ICS computers. This is the highest percentage for any six-month reporting period since 2020.Percentage of ICS computers on which ransomware was blocked
The highest percentage of ICS computers on which ransomware was blocked was recorded in February (0.27%) and the lowest in March (0.11%). The percentage observed in February was the highest in 2.5 years of observations.Percentage of ICS computers on which ransomware was blocked, January – June 2022
East Asia (0.95%) and the Middle East (0.89%) lead the ransomware-based ranking of regions. In the Middle East, the percentage of ICS computers on which ransomware was blocked per six-month reporting period has increased by a factor of 2.5 since 2020.Regions ranked by percentage of ICS computers on which ransomware was blocked, H1 2022
Building Automation leads the ranking of industries based on the percentage of ICS computers attacked by ransomware (1%).Percentage of ICS computers on which ransomware was blocked, in selected regions, H1 2022
Malicious documents
Malicious documents (MSOffice+PDF) were blocked on 5.5% of ICS computers. This is 2.2 times the percentage recorded in H2 2021. Threat actors distribute malicious documents via phishing emails and actively use such emails as the vector of initial computer infections.Percentage of ICS computers on which malicious documents (MSOffice+PDF) were blocked
In the Building Automation industry, the percentage of ICS computers on which malicious office documents were blocked (10.5%) is almost twice the global average.Percentage of ICS computers on which malicious office documents (MSOffice+PDF) were blocked, in selected industries
Spyware
Spyware was blocked on 6% of ICS computers. This percentage has been growing since 2020.Percentage of ICS computers on which spyware was blocked
Building Automation leads the ranking of industries based on the percentage of ICS computers on which spyware was blocked (12.9%).Percentage of ICS computers on which spyware was blocked, in selected industries
Malware for covert cryptocurrency mining
The percentage of ICS computers on which malicious cryptocurrency miners were blocked continued to rise gradually.Percentage of ICS computers on which malicious cryptocurrency miners were blocked
Building Automation also leads the ranking of selected industries by percentage of ICS computers on which malicious cryptocurrency miners were blocked.Percentage of ICS computers on which malicious cryptocurrency miners were blocked, in selected industries
by Or Katz and Jim Black Data analysis by Gal Kochner and Moshe Cohen
Executive summary
Akamai researchers have analyzed malicious DNS traffic from millions of devices to determine how corporate and personal devices are interacting with malicious domains, including phishing attacks, malware, ransomware, and command and control (C2).
Akamai researchers saw that 12.3% of devices used by home and corporate users communicated at least once to domains associated with malware or ransomware.
63% of those users’ devices communicated with malware or ransomware domains, 32% communicated with phishing domains, and 5% communicated with C2 domains.
Digging further into phishing attacks, researchers found that users of financial services and high tech are the most frequent targets of phishing campaigns, with 47% and 36% of the victims, respectively.
Consumer accounts are the most affected by phishing, with 80.7% of the attack campaigns.
Tracking 290 different phishing toolkits being reused in the wild, and counting the number of distinct days each kit was reused over Q2 2022, shows that 1.9% of the tracked kits were reactivated on at least 72 days. In addition, 49.6% of the kits were reused for at least five days, demonstrating how many users are being revictimized multiple times. This shows how realistic-looking and dangerous these kits can be, even to knowledgeable users.
The most used phishing toolkit in Q2 2022 (Kr3pto, a phishing campaign that targeted banking customers in the United Kingdom, which evades multi-factor authentication [MFA]) was hosted on more than 500 distinct domains.
Introduction
“It’s always DNS.” Although that is a bit of a tongue-in-cheek phrase in our industry, DNS can give us a lot of information about the threat landscape that exists today. By analyzing information from Akamai’s massive infrastructure, we are able to gain some significant insights on how the internet behaves. In this blog, we will explore these insights into traffic patterns, and how they affect people on the other end of the internet connection.
Akamai traffic insights
Attacks by category
Based on Akamai’s range of visibility across different industries and geographies, we can see that 12.3% of protected devices attempted to reach out to domains that were associated with malware at least once during Q2 2022. This indicates that these devices might have been compromised. On the phishing and C2 front, we can see that 6.2% of devices accessed phishing domains and 0.8% of the devices accessed C2-associated domains. Although these numbers may seem insignificant, the scale here is in the millions of devices. When this is considered, along with the knowledge that C2 is the most malignant of threats, these numbers are not only significant, they’re cardinal.
Comparing 2022 Q2 results with 2022 Q1 results (Figure 1), we can see a minor increase in all categories in Q2. We attribute those increases to seasonal changes that are not associated with a significant change in the threat landscape.
Fig. 1: Devices exposed to threats — Q1 vs. Q2
In Figure 2, we can see that of the 12.3% potentially compromised devices, 63% were exposed to threats associated with malware activity, 32% with phishing, and 5% with C2. Access to malware-associated domains does not guarantee that these devices were actually compromised, but provides a strong indication of increased potential risk if the threat wasn’t properly mitigated. However, access to C2-associated domains indicates that the device is most likely compromised and is communicating with the C2 server. This can often explain why the incidence of C2 is lower when compared with malware numbers.
Fig. 2: Potentially compromised devices by category
Phishing attack campaigns
By looking into the brands that are being abused and mimicked by phishing scams in Q2 2022, categorized by brand industry and number of victims, we can see that high tech and financial brands led with 36% and 47%, respectively (Figure 3). These leading phishing industry categories are consistent with Q1 2022 results, in which high tech and financial brands were the leading categories, with 32% and 31%, respectively.
Fig. 3: Phishing victims and phishing campaigns by abused brands
When taking a different view on the phishing landscape–targeted industries by counting the number of attack campaigns being launched over Q2 2022, we can see that high tech and financial brands are still leading, with 36% and 41%, respectively (Figure 3). The correlation between leading targeted brands when it comes to number of attacks and number of victims is evidence that threat actors’ efforts and resources are, unfortunately, effectively working to achieve their desired outcome.
Akamai’s research does not have any visibility into the distribution channels used to deliver the monitored phishing attacks that led to victims clicking on a malicious link and ending up on the phishing landing page. Yet the strong correlation between different brand segments by number of attack campaigns and the number of victims seems to indicate that the volume of attacks is effective and leads to a similar trend in the number of victims. The correlation might also indicate that the distribution channels used have minimal effect on attack outcome, and it is all about the volume of attacks that lead to the desired success rates.
Taking a closer look at phishing attacks by categorization of attack campaigns — consumers vs. business targeted accounts— we can see that consumer attacks are the most dominant, with 80.7% of the attack campaigns (Figure 4). This domination is driven by the massive demand for consumers’ compromised accounts in dark markets that are then used to launch fraud-related second-phase attacks. However, even with only 19.3% of the attack campaigns, attacks against business accounts should not be considered marginal, as these kinds of attacks are usually more targeted and have greater potential for significant damage. Attacks that target business accounts may lead to a company’s network being compromised with malware or ransomware, or to confidential information being leaked. An attack that begins with an employee clicking a link in a phishing email can end up with the business suffering significant financial and reputational damages.
Fig. 4: Phishing targeted accounts — consumers vs. business
Phishing toolkits
Phishing attacks are an extremely common vector that have been used for many years. The potential impacts and risks involved are well-known to most internet users. However, phishing is still a highly relevant and dangerous attack vector that affects thousands of people and businesses daily. Research conducted by Akamai explains some of the reasons for this phenomenon, and focuses on the phishing toolkits and their role in making phishing attacks effective and relevant.
Phishing toolkits enable rapid and easy creation of fake websites that mimic known brands. Phishing toolkits enable even non–technically gifted scammers to run phishing scams, and in many cases are being used to create distributed and large-scale attack campaigns. The low cost and availability of these toolkits explains the increasing numbers of phishing attacks that have been seen in the past few years.
According to Akamai’s research that tracked 290 different phishing toolkits being used in the wild, 1.9% of the tracked kits were reused on at least 72 distinct days over Q2 2022 (Figure 5). Further, 49.6% of the kits were reused for at least five days, and when looking into all the tracked kits, we can see that all of them were reused no fewer than three distinct days over Q2 2022.
Fig. 5: Phishing toolkits by number of reused days Q2 2022
The numbers showing the heavy reuse phenomenon of the observed phishing kits shed some light on the phishing threat landscape and the scale involved, creating an overwhelming challenge to defenders. Behind the reuse of phishing kits are factories and economic forces that drive the phishing landscape. Those forces include developers who create phishing kits that mimic known brands, later to be sold or shared among threat actors to be reused over and over again with very minimal effort.
Further analysis on the most reused kits in Q2 2022, counting the number of different domains used to deliver each kit, shows that the Kr3pto toolkit was the one most frequently used and was associated with more than 500 domains (Figure 6). The tracked kits are labeled by the name of the brand being abused or by a generic name representing the kit developer signature or kit functionality.
In the case of Kr3pto, the actor behind the phishing kit is a developer who builds and sells unique kits that target financial institutions and other brands. In some cases, these kits target financial firms in the United Kingdom, and they bypass MFA. This evidence also shows that this phishing kit that was initially created more than three years ago is still highly active and effective and being used intensively in the wild.
Fig. 6: Top 10 reused phishing toolkits
The phishing economy is growing, kits are becoming easier to develop and deploy, and the web is full of abandoned, ready-to-be-abused websites and vulnerable servers and services. Criminals capitalize on these weaknesses to establish a foothold that enables them to victimize thousands of people and businesses daily.
The growing industrial nature of phishing kit development and sales (in which new kits are developed and released within hours) and the clear split between creators and users means this threat isn’t going anywhere anytime soon. The threat posed by phishing factories isn’t just focused on the victims who risk having valuable accounts compromised and their personal information sold to criminals — phishing is also a threat to brands and their stakeholders.
The life span of a typical phishing domain is measured in hours, not days. Yet new techniques and developments by the phishing kit creators are expanding these life spans little by little, and it’s enough to keep the victims coming and the phishing economy moving.
Summary
This type of research is necessary in the fight to keep our customers safer online. We will continue to monitor these threats and report on them to keep the industry informed.
The best way to stay up to date on this and other research pieces from the Akamai team is to follow Akamai Security Research on Twitter.
A critical remote code-execution vulnerability (CVE-2021-44228) has been publicly disclosed in Log4j, an open-source logging utility that’s used widely in applications, including many utilized by large enterprise organizations.
The vulnerability allows threat actors to exfiltrate information from, and execute malicious code on, systems running applications that utilize the library by manipulating log messages. There already are reports of servers performing internet-wide scans in attempts to locate vulnerable servers, and our threat intelligence teams are seeing attempts to exploit this vulnerability at alarming volumes. Log4j is incorporated into many popular frameworks and many Java applications, making the impact widespread.
Akamai Guardicore Segmentation is well positioned to address this vulnerability in different ways. It’s highly recommended that organizations update Log4j to its latest version- 2.16.0. Due to the rapidly escalating nature of this vulnerability, Akamai teams will continue to develop and deploy mitigation measures in order to support our customers.
As a follow up to Akamai’s recent post we wanted to provide more detail on how organizations can leverage Akamai Guardicore Segmentation features to help address log4j exposure.
Log4j vulnerability: scope and impact
Log4j is a Java-based open-source logging library. On December 9, 2021, a critical vulnerability involving unauthenticated remote code execution (CVE-2021-44228) in Log4j was reported, causing concern due to how commonly Log4j is used. In addition to being used directly in a large multitude of applications, Log4j is also incorporated into a host of popular frameworks, including Apache Struts2, Apache Solr, Apache Druid, and Apache Flink.
Although Akamai first observed exploit attempts on the Log4j vulnerability on December 9th, following the widespread publication of the incident, we are now seeing evidence suggesting it could have been around for months. Since widespread publication of the vulnerability, we have seen multiple variants seeking to exploit this vulnerability, at a sustained volume of attack traffic at around 2M exploit requests per hour. The speed at which the variants are evolving is unprecedented.
A compromised machine would allow a threat actor to remotely provide a set of commands which Log4j executes. An attacker would have the ability to run arbitrary commands inside a server. This can allow an attacker to compromise a vulnerable system – including those that might be secured deep inside of a network with no direct access to the internet.
Akamai’s security teams have been monitoring attackers attempting to use Log4j in recent days. Other than the increase in attempted exploitation, Akamai researchers are also seeing attackers using a multitude of tools and attack techniques to get vulnerable components to log malicious content, in order to get remote code execution. This is indicative of threat actors’ ability to exploit a new vulnerability, and the worse the vulnerability is, the quicker they will act.
Mitigating Log4j abuse using Akamai Guardicore Segmentation
Customers using Akamai Guardicore Segmentation can leverage its deep, process level visibility to identify vulnerable applications and potential security risks in the environment. They can then use it to enact precise control over network traffic in order to stop attempted attacks on vulnerable systems, without disruptions to normal business operations.
Guardicore Hunt customers have their environments monitored and investigated continuously by a dedicated team of security researchers. Alerts on security risks and suggested mitigation steps are immediately sent.
If you’d like to hear more about Akamai Guardicore Segmentation, read more or contact us.
What’s under threat: identify vulnerable Java processes and Log4j abuse
In order to protect against potential Log4j abuse, it is necessary to first identify potentially exploitable processes. This requires deep visibility into network traffic at the process level, which is provided by the Reveal and Insight features of Akamai Guardicore Segmentation. Precise visibility into internet connections and traffic at the process level allows us to see clearly what mitigation steps need to be taken, and visibility tools with historical data are pivotal in helping to prevent disruption to business operations.
Identify internet connected Java applications: using Reveal Explore Map, create a map for the previous week, and filter by java applications- such as tomcat, elastic, logstash- and by applications that have connections to/from the internet. Using this map, you can now see which assets are under potential threat. While this won’t yet identify Log4j applications, this can give you an idea of which machines to prioritize in your mitigation process.
Create a historical map to analyze normal communication patterns: using Reveal Explore Map, create a historical map of previous weeks (excluding the time since Log4j was reported) to view and learn normal communication patterns. Use this information to identify legitimate communications, and respond without disrupting the business. For example, a historical map might indicate what network connections exist under normal circumstances, those could be allowed, while other connections blocked or alerted on. Additionally, compare and contrast with a more recent map to identify anomalies.
Identify applications vulnerable to Log4j abuse: in the query section below, use Query 1 with Insight queries to identify assets that are running Java applications which have Log4j jar files in their directories. This query should return all Log4j packages in your environment, allowing you to assess and address any mitigation steps needed. To better prioritize exposed machines, cross reference the information with the Reveal Explore Map described previously.
Note that this query identifies Log4j packages that exist in the Java process current working directory or sub-directories.
Detect potential exploitation attempts in Linux logs: run an Insight query using YARA signature rule (Query 2, provided below in the query section) to search for known Log4j IoCs in the logs of linux machines. This can help you identify whether you’ve been attacked.
Note, a negative result does not necessarily mean that no attack exists, as this is only one of many indicators.
Stopping the attack: using Guardicore Segmentation to block malicious IoCs and attack vectors
It is imperative to be able to take action, once vulnerable applications have been identified. While patching is underway, Akamai Guardicore Segmentation offers a multitude of options for alerting on, stopping and preventing potential attacks. Critically, a solution with detailed and precise control over network communication and traffic is required to be able to surgically block or isolate attack vectors, with minimal to no disruption to normal business functions.
Automatically block IoC’s with Threat Intelligence Firewall (TIFW) and DNS Security: Akamai security teams are working around the clock to identify IPs and Domains used for Log4j exploitation. Customers who have these features turned on can expect a constantly updated list of IoCs to be blocked, preventing Log4j being used to download malicious payloads. Note that TIFW can be set to alert or block, please ensure it’s configured correctly. DNS Security is available from V41 onwards. The IoCs are also available on the Guardicore Threat Intel Repository and Guardicore Reputation Service.
Fully quarantine compromised servers: if compromised machines are identified during your investigation, use Akamai Guardicore Segmentation to isolate attacked/vulnerable servers from the rest of your network. Leverage built-in templates to easily enable deployment of segmentation policy to mitigate attacks.
Block inbound and outbound traffic to vulnerable assets: as a precautionary measure, you may also choose to block traffic to all machines identified with an unpatched version of Log4j, until patching is completed. Using a historical map of network traffic can help you limit the impact on business operations.
Create block rules for outgoing traffic from Java applications to the internet: if necessary, all internet-connected Java applications revealed in previous steps can be blocked from accessing the internet, as an additional precaution, until patching is complete.
Search queries
Query 1: To Identify assets that are running Java applications, which also have a Log4j jar file under their directories, run the following Insight query:
Query 2: To detect potential exploitation attempts, run an Insight query using YARA signature rules (our thanks to Florian Roth who published the original rule):
SELECT path, count FROM yara WHERE path LIKE '/var/log/%%' AND sigrule = "rule EXPL_Log4j_CallBackDomain_IOCs_Dec21_1 {
$sa1 = {22 2E 6C 6F 67 34 6A 2E 63 6F 72 65 2E 6E 65 74 2E 4A 6E 64 69 4D 61 6E 61 67 65 72 2E 6C 6F 6F 6B 75 70 28 4A 6E 64 69 4D 61 6E 61 67 65 72 22}
Or, more accurately, the cybercriminals responsible for July’s record-setting European DDoS attack may have never left. In the weeks following our coverage of the previous incident, the victim (a customer based in Eastern Europe) has been bombarded relentlessly with sophisticated distributed denial-of-service (DDoS) attacks, ultimately paving the way for a new European packets per second (pps) DDoS record.
On Monday, September 12, 2022, Akamai successfully detected and mitigated the now-largest DDoS attack ever launched against a European customer on the Prolexic platform, with attack traffic abruptly spiking to 704.8 Mpps in an aggressive attempt to cripple the organization’s business operations.
Attack breakdown
Adversaries are constantly evolving their techniques, tactics, and procedures to evade detection and maximize disruption, as demonstrated by this ongoing attack campaign. Let’s break down and compare the two record-setting events.
July Attack
September Attack
Peak pps
659.6 Mpps
704.8 Mpps
Cumulative Attacks
75
201
IPs Targeted
512
1813
Vector
UDP
UDP
Distribution
1 location
6 locations
Date of Attack
July 21, 2022
September 12, 2022
Top Scrubbing Locations
HKG, LON, TYO
HKG, TYO, LON
Prior to June 2022, this customer only saw attack traffic against its primary data center; however, they recognized the importance of a comprehensive defensive strategy early on, and onboarded their 12 remaining global data centers to the Prolexic platform for peace of mind. This proved highly fortuitous, as the attack campaign expanded unexpectedly, hitting six different global locations, from Europe to North America. These events reflect a growing trend in which adversaries are increasingly hitting deep-reconnaissance targets.
Attack mitigation
To thwart an attack of this magnitude and complexity, Akamai leveraged a balanced combination of automated and human mitigation: 99.8% of the assault was pre-mitigated thanks to the customer’s proactive defensive posture, a preemptive security measure implemented by the Akamai Security Operations Command Center (SOCC). Remaining attack traffic and follow-up attacks leveraging different vectors were swiftly mitigated by our frontline security responders. In the wake of increasingly sophisticated DDoS attacks worldwide, many businesses struggle with the staffing of internal security resources, and instead look to Akamai’s SOCC to augment and act as an extension of their incident response team.
The attackers’ command and control system had no delay in activating the multidestination attack, which escalated in 60 seconds from 100 to 1,813 IPs active per minute. Those IPs were spread across eight distinct subnets in six distinct locations. An attack this heavily distributed could drown an underprepared security team in alerts, making it difficult to assess the severity and scope of the intrusion, let alone fight the attack. Sean Lyons, Senior Vice President and General Manager of Infrastructure Security says, “Akamai Prolexic’s DDoS specialization culture, focus on customer infrastructure designs and history are rooted in defending the most complex, multifaceted attacks, and our platform is equipped with purpose-built tooling for rapid threat mitigation, even in the ‘fog of war.’ “
Akamai Prolexic’s DDoS specialization culture, focus on customer infrastructure designs and history are rooted in defending the most complex, multifaceted attacks, and our platform is equipped with purpose-built tooling for rapid threat mitigation, even in the ‘fog of war.
Sean Lyons, Senior Vice President and General Manager of Infrastructure Security
Conclusion
Having a proven DDoS mitigation strategy and platform in place is imperative for shielding your business from downtime and disruption. Learn more about Akamai’s industry-leading DDoS solutions and how our advanced attack-fighting capabilities keeps organizations safe from increasingly sophisticated threats.
Immediately review and implement Cybersecurity and Infrastructure Security Agency (CISA) recommendations.
Review critical subnets and IP spaces, and ensure that they have mitigation controls in place.
Deploy DDoS security controls in an always-on mitigation posture as a first layer of defense, to avoid an emergency integration scenario and to reduce the burden on incident responders. If you don’t have a trusted and proven cloud-based provider, get one now.
Proactively pull together a crisis response team and ensure runbooks and incident response plans are up-to-date. For example, do you have a runbook to deal with catastrophic events? Are the contacts within the playbooks updated? A playbook that references outdated tech assets or people who have long left the company isn’t going to help.
For additional information on the steps you can take to protect your organization, please visit the following CISA resources:
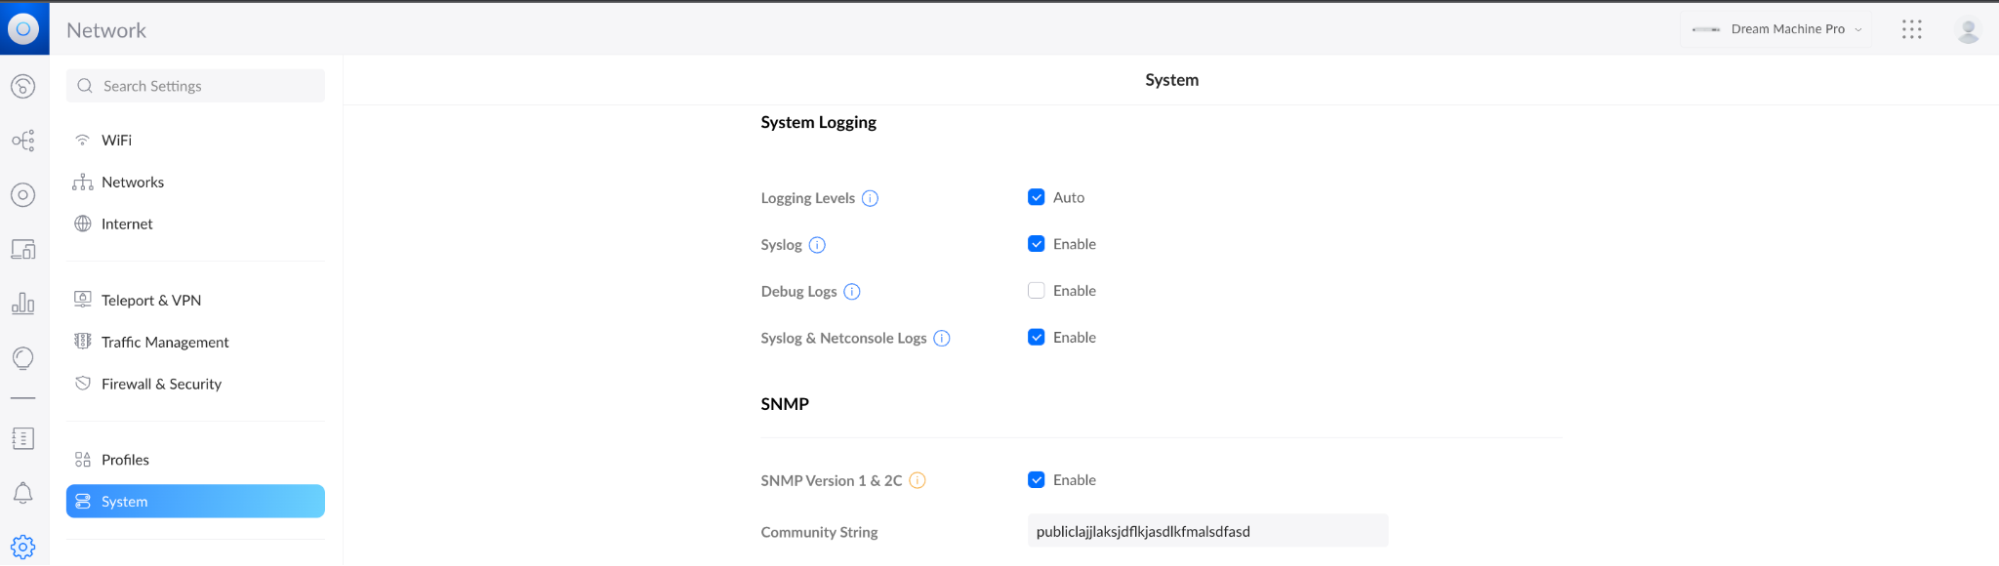


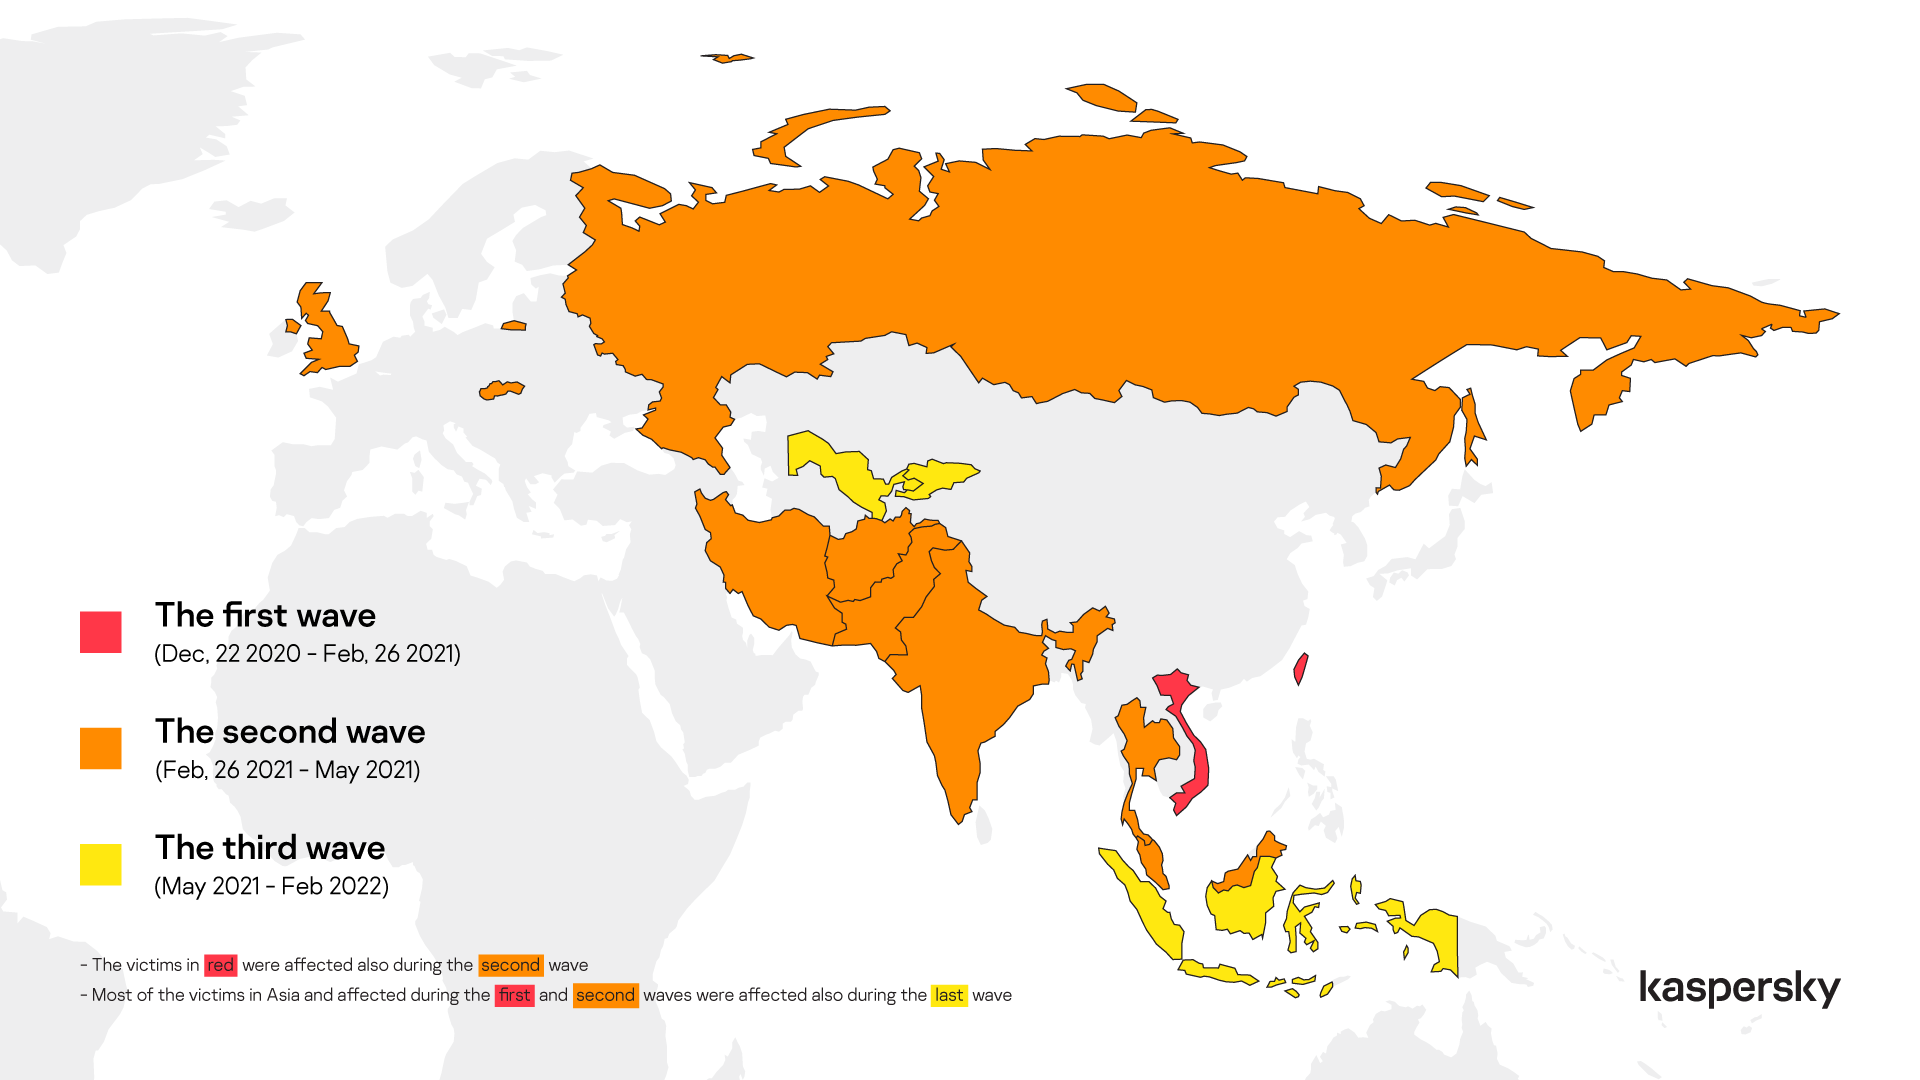
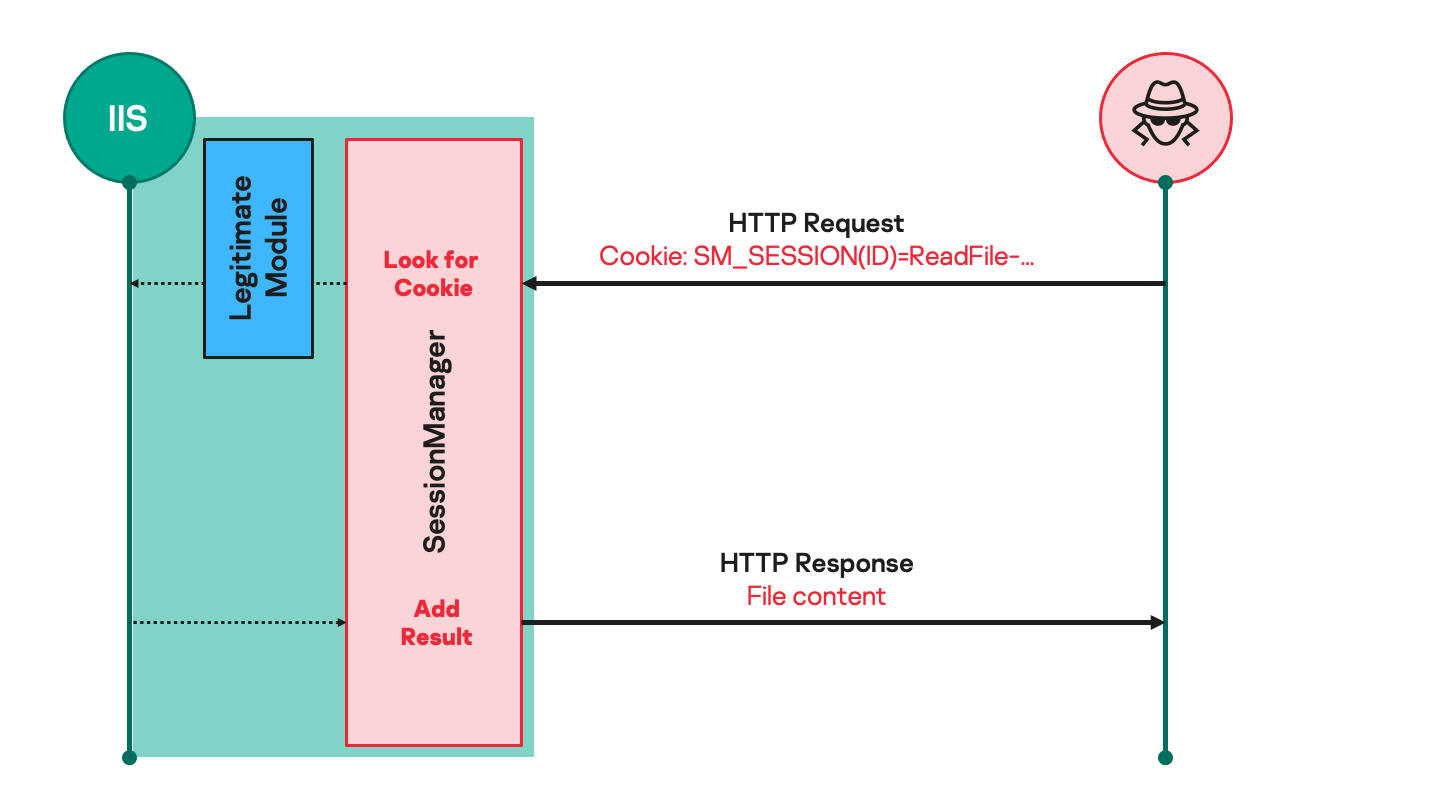

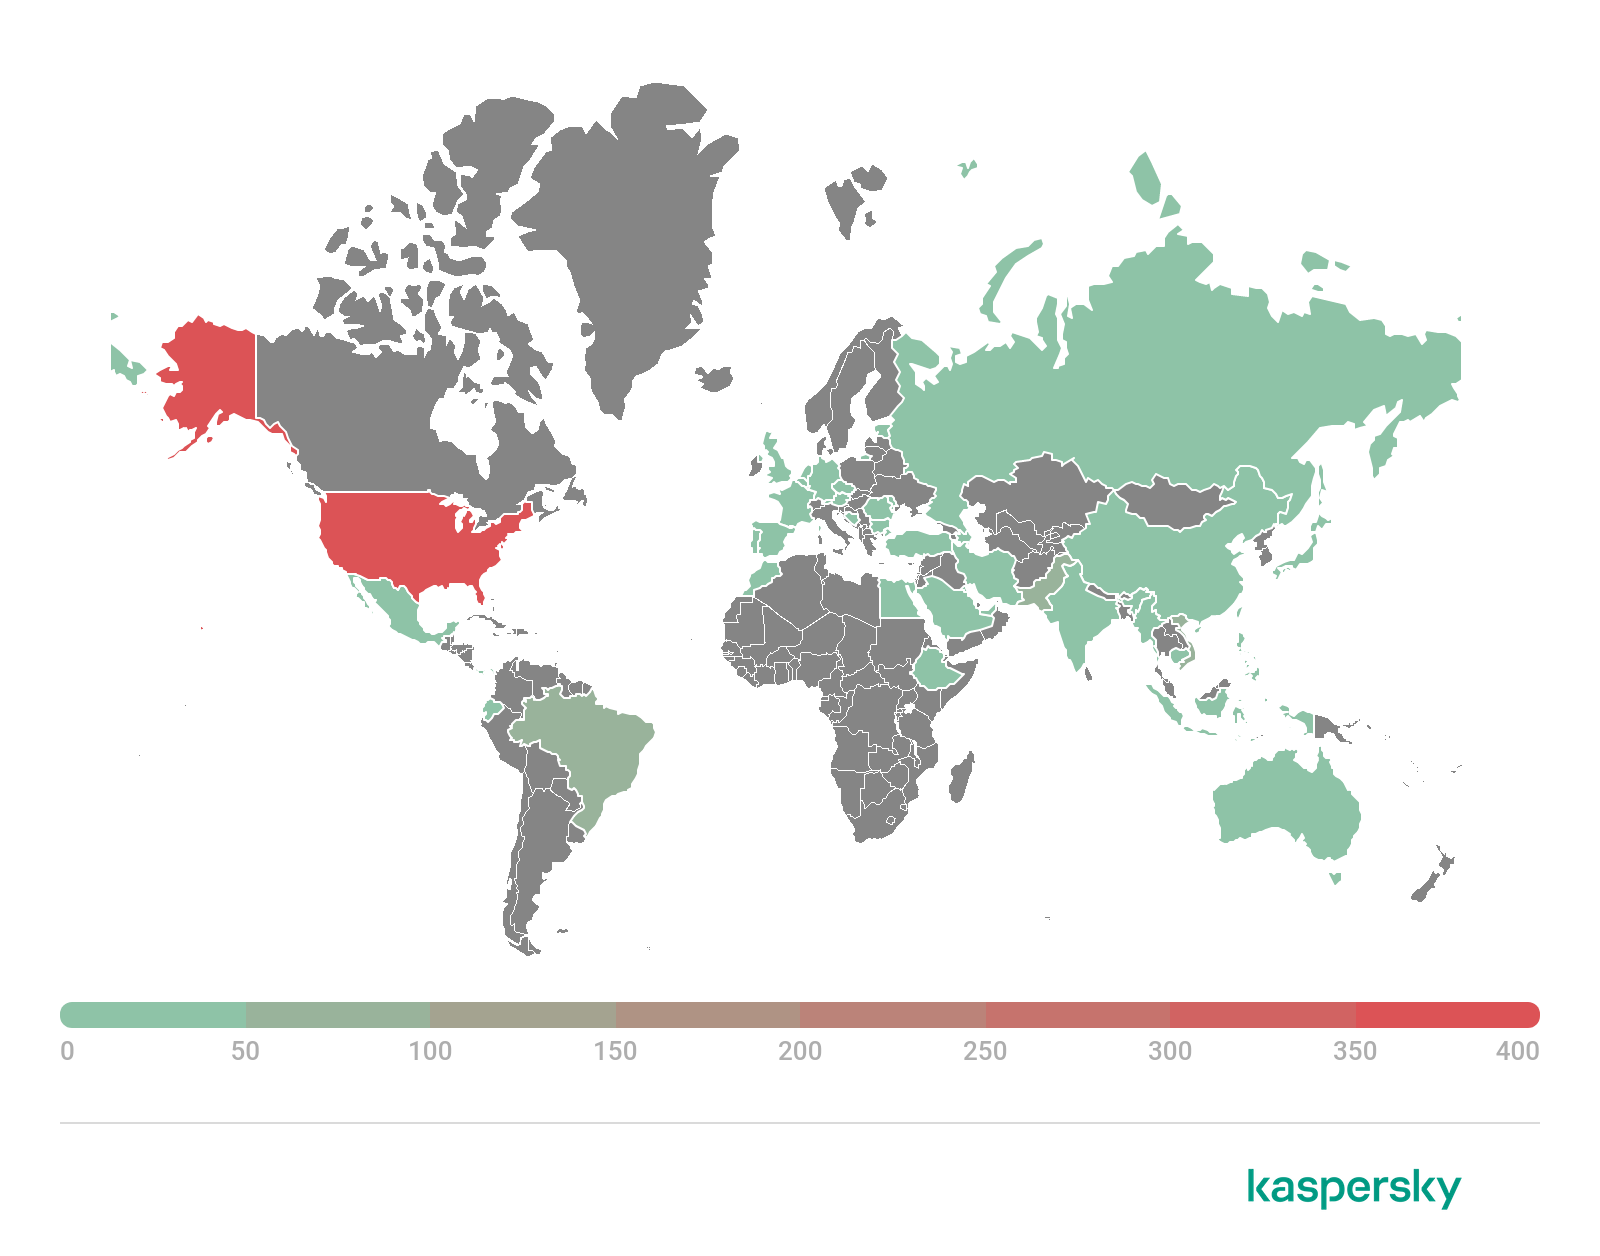

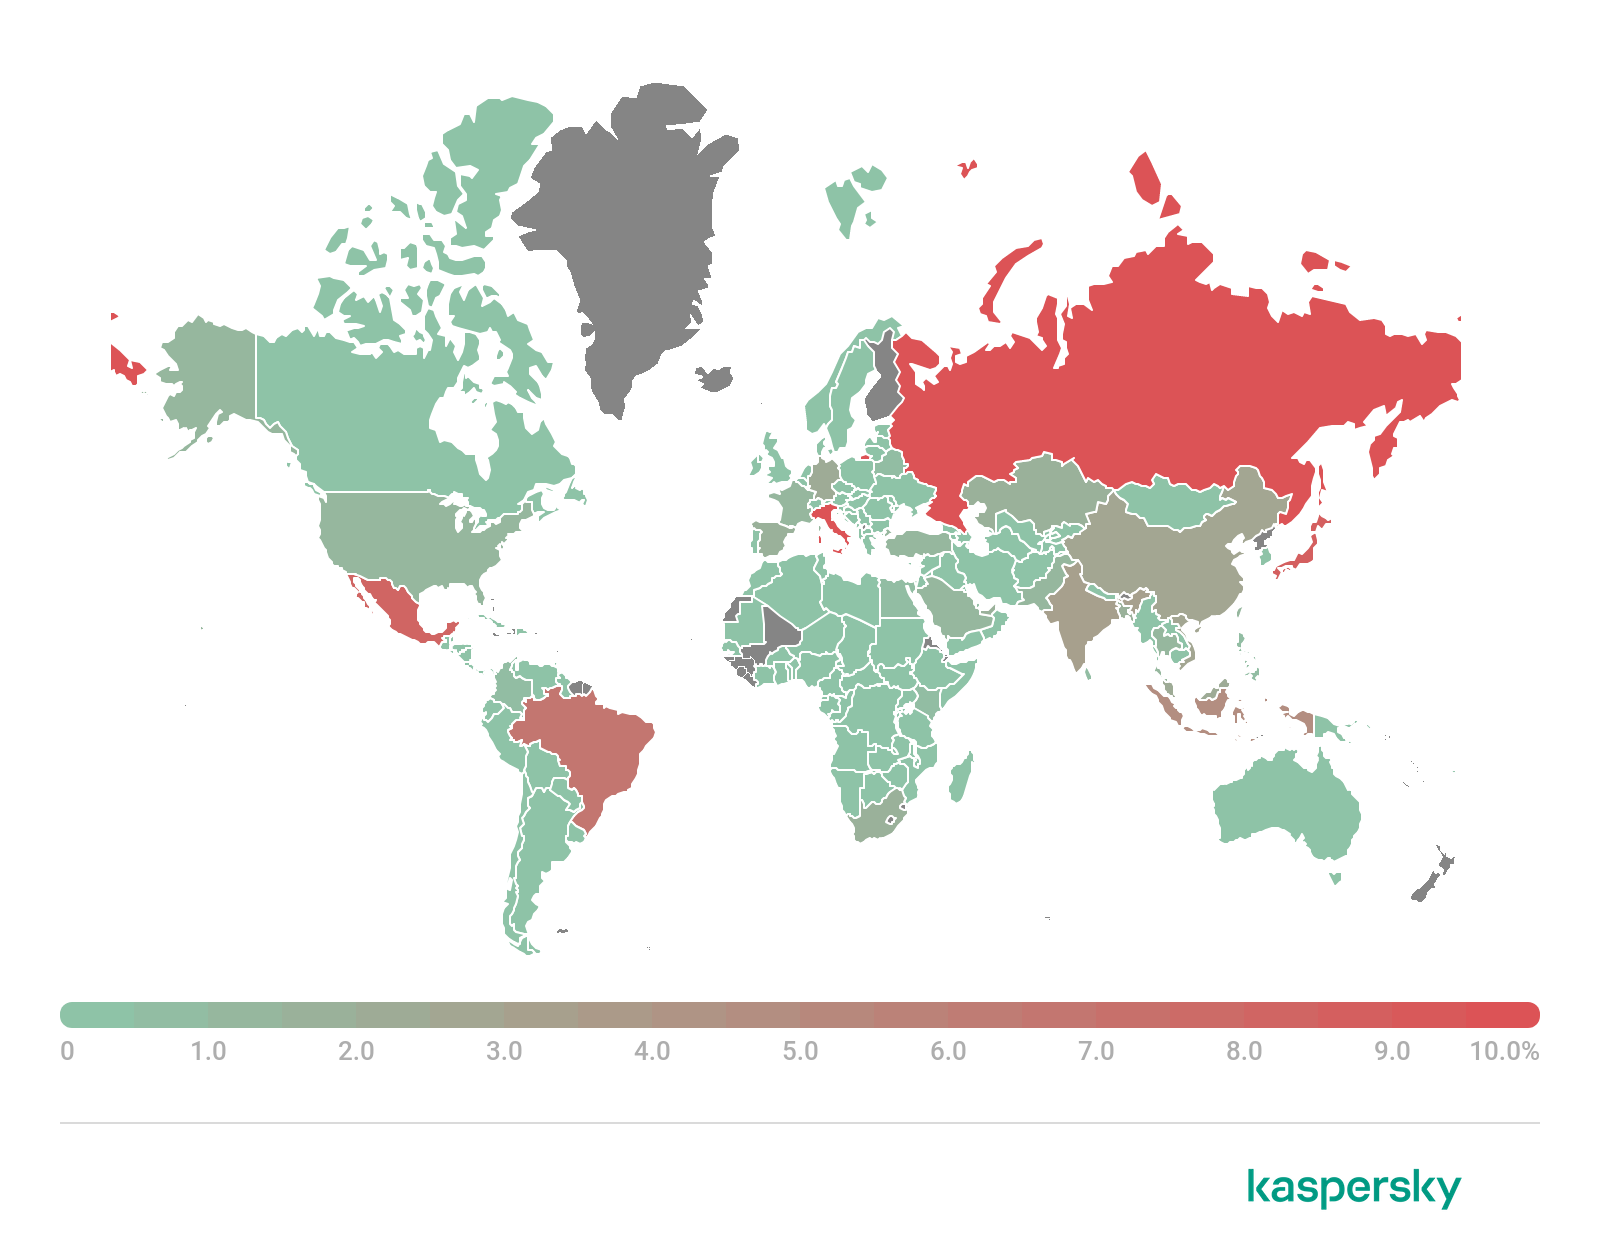
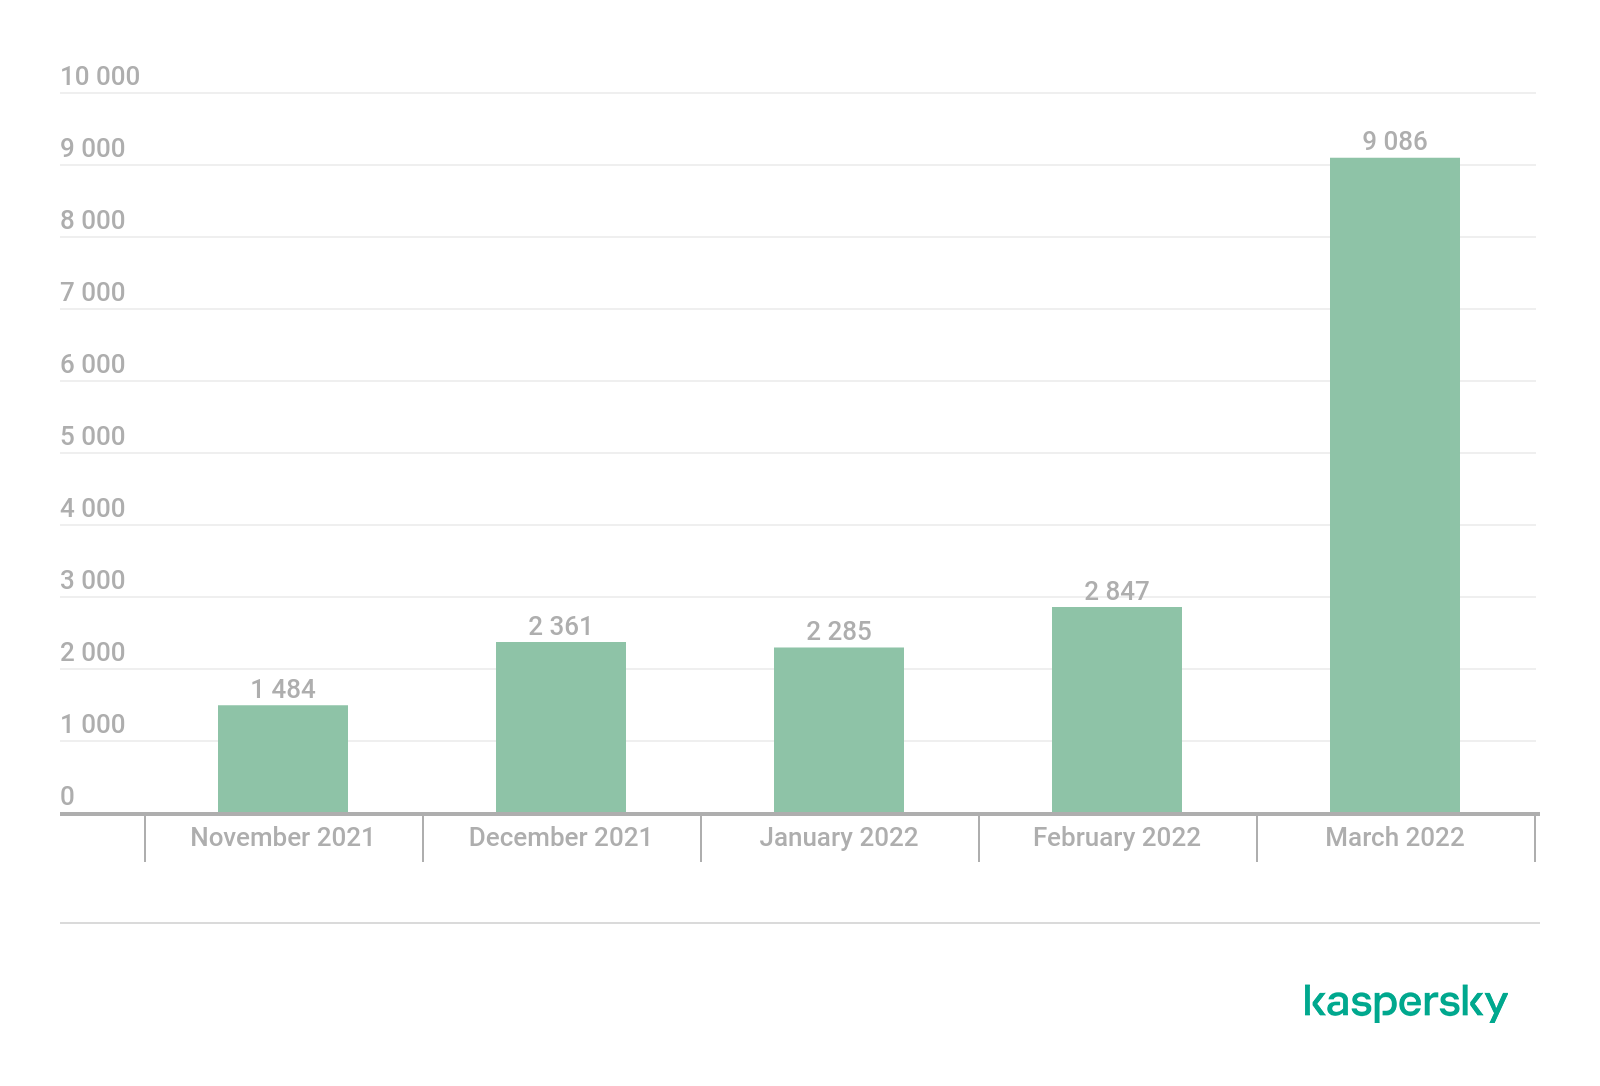


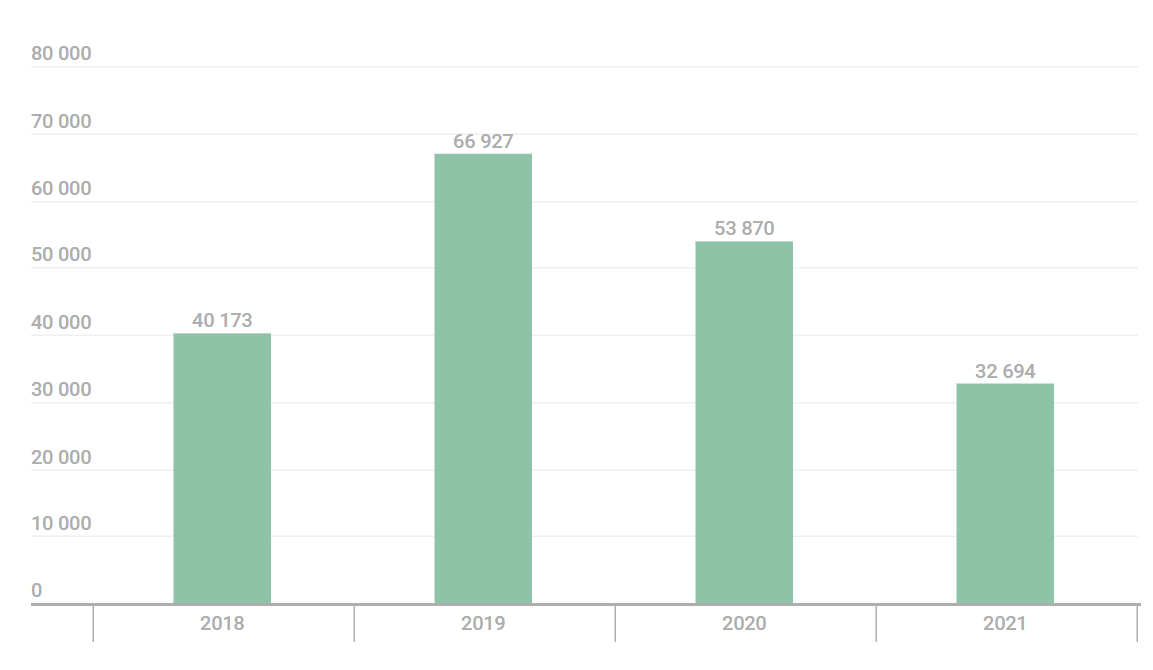

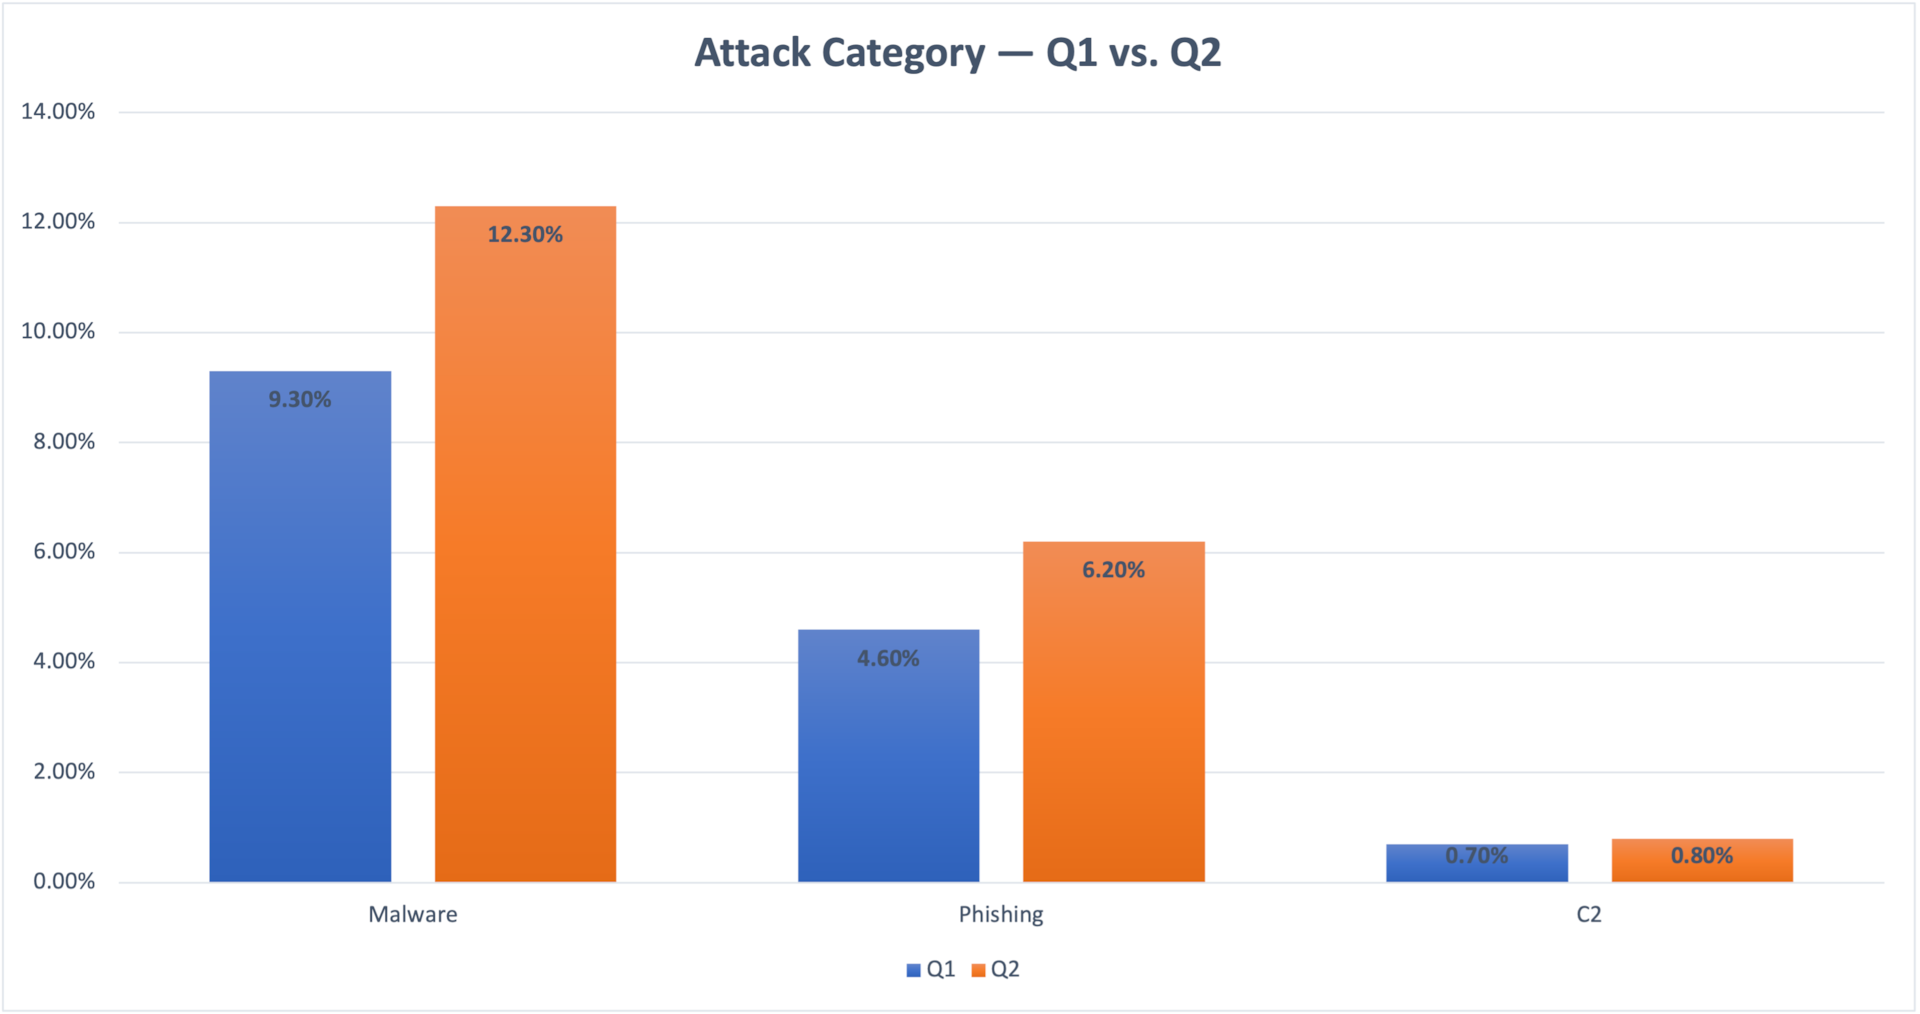 Fig. 1: Devices exposed to threats — Q1 vs. Q2
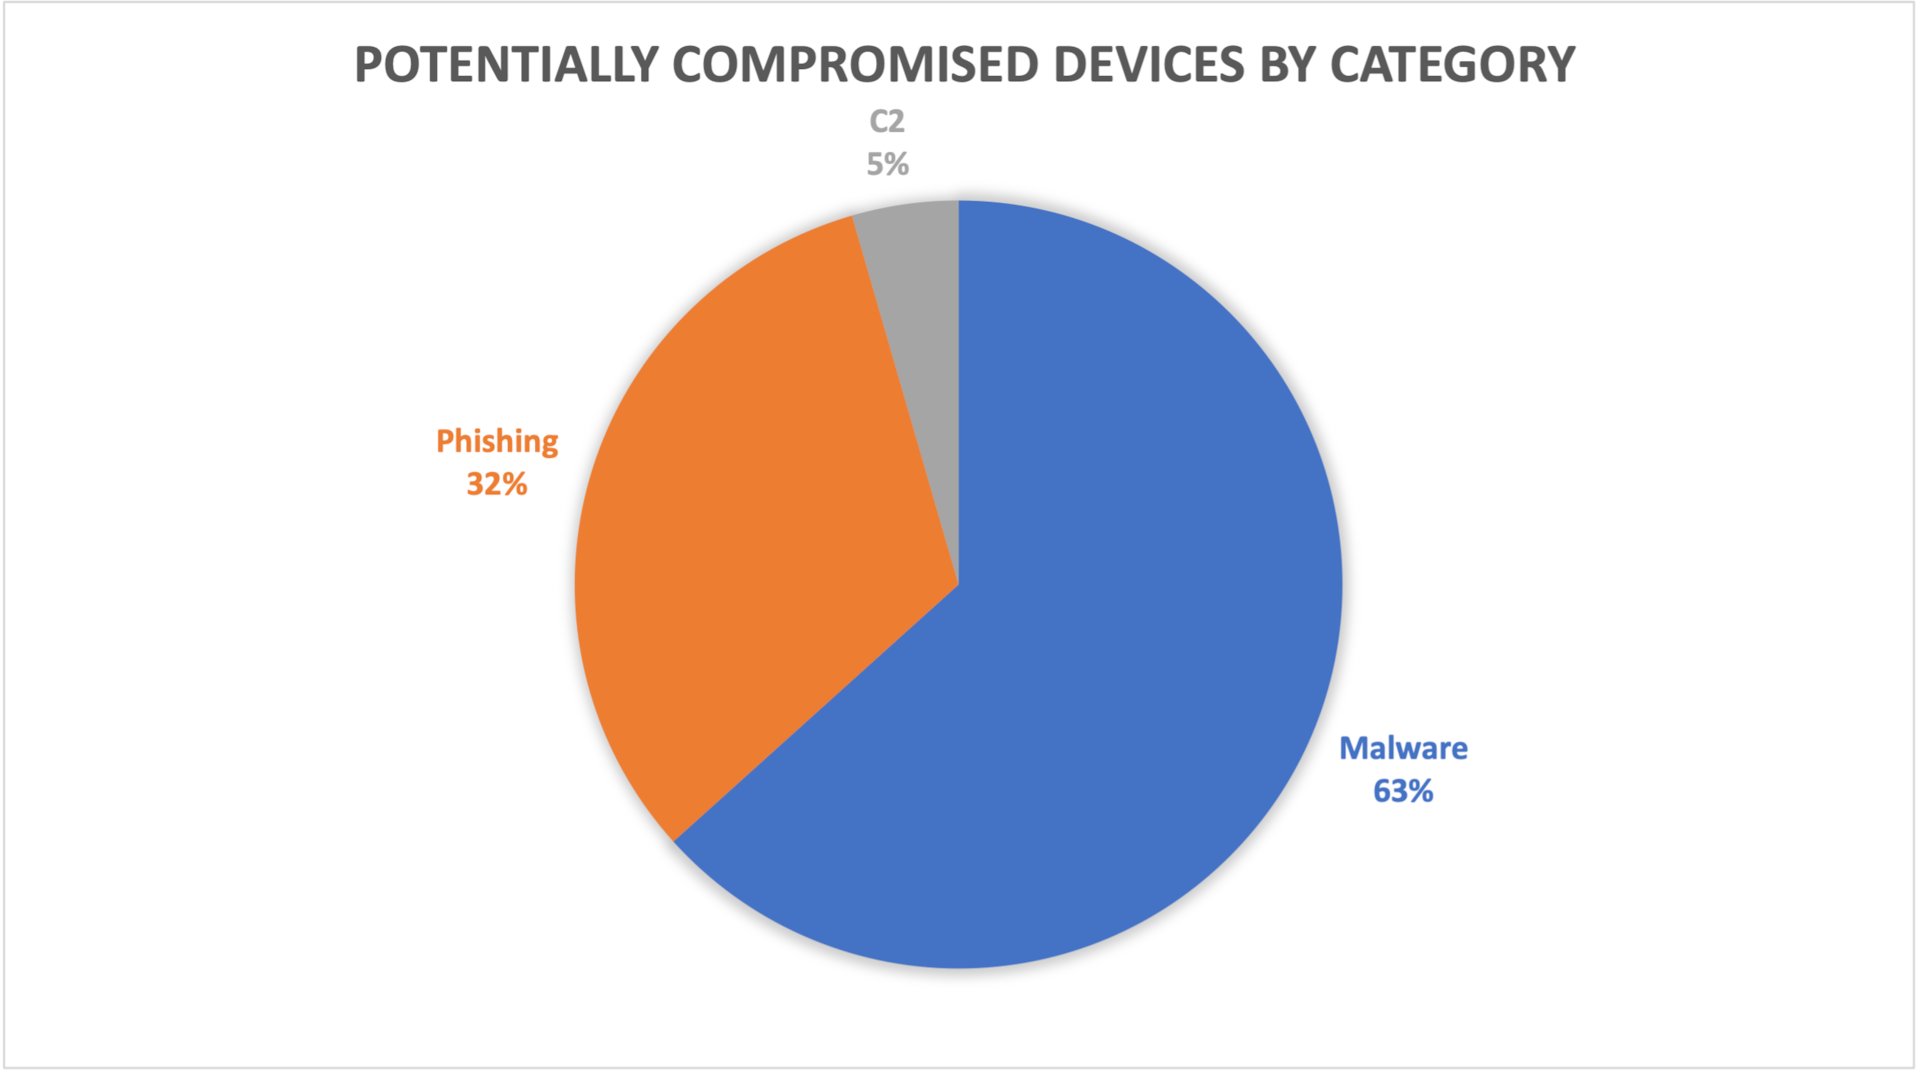 Fig. 2: Potentially compromised devices by category
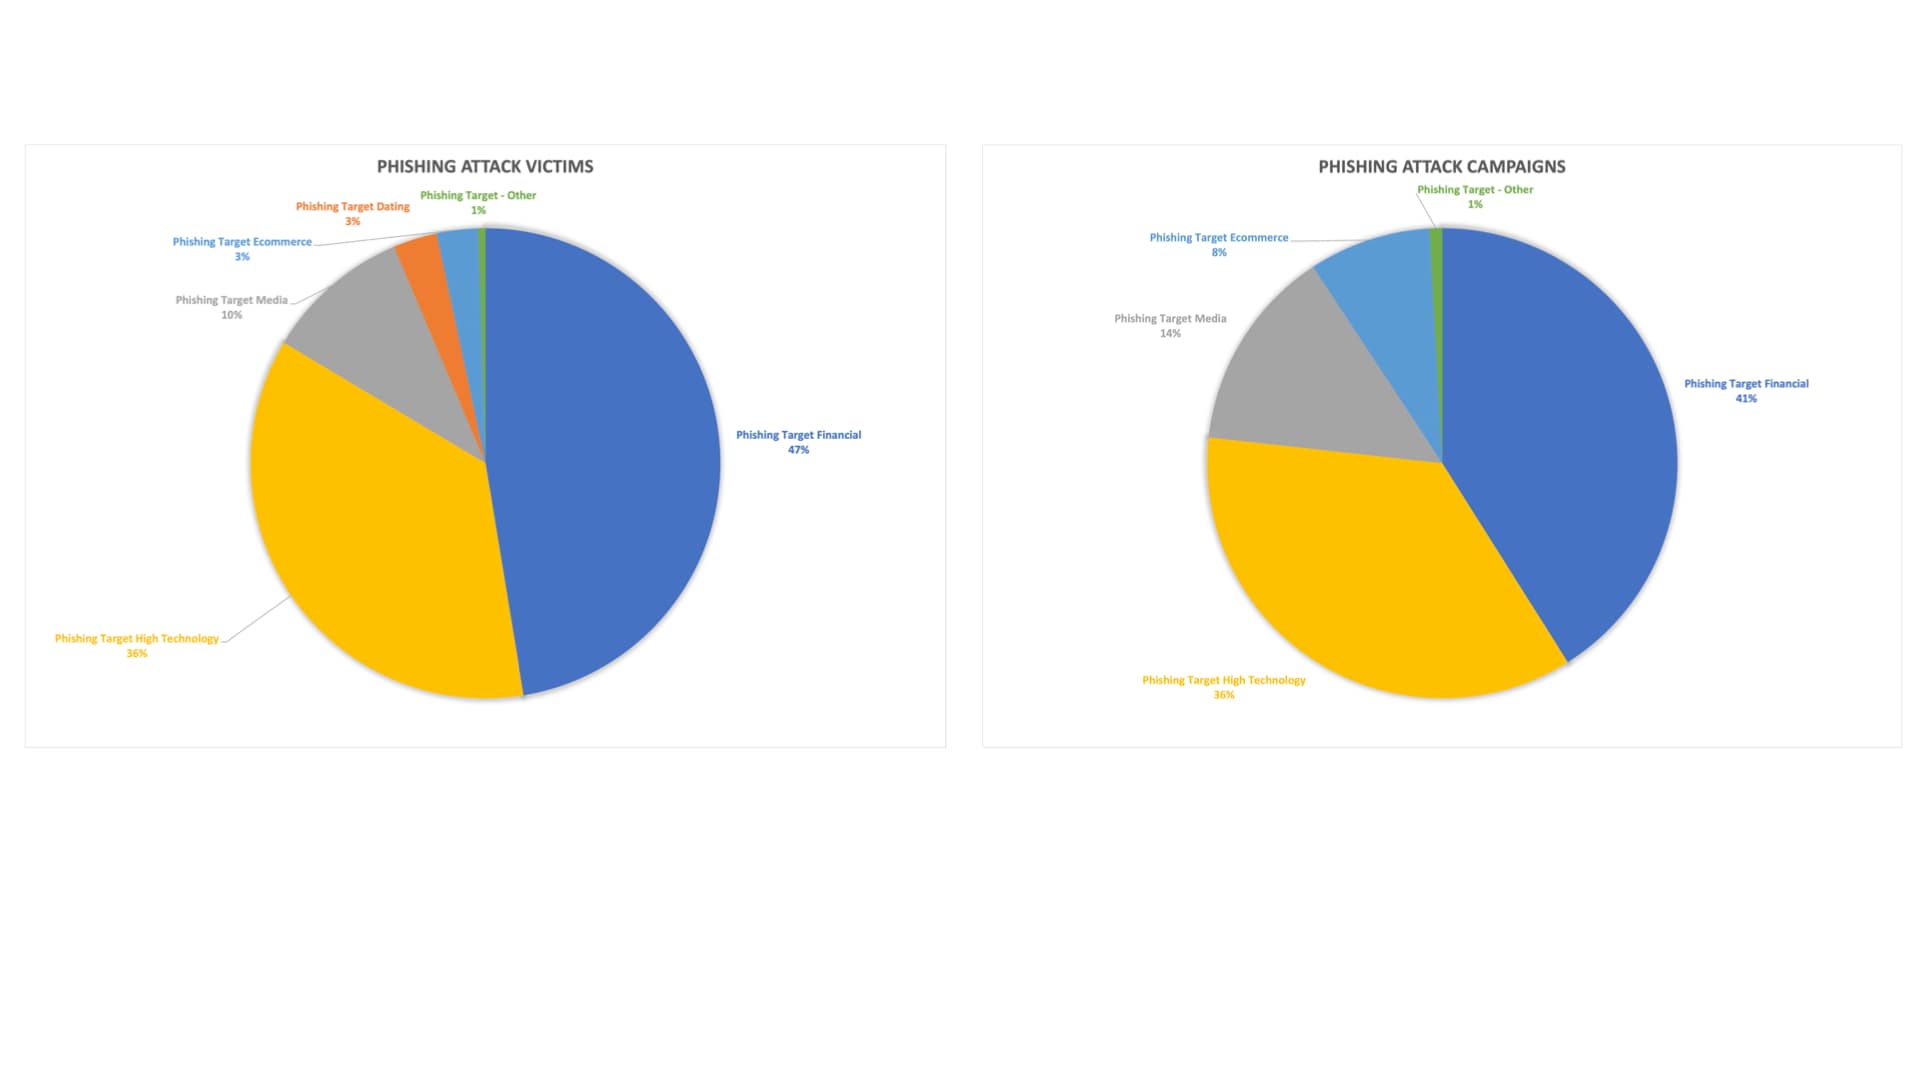 Fig. 3: Phishing victims and phishing campaigns by abused brands
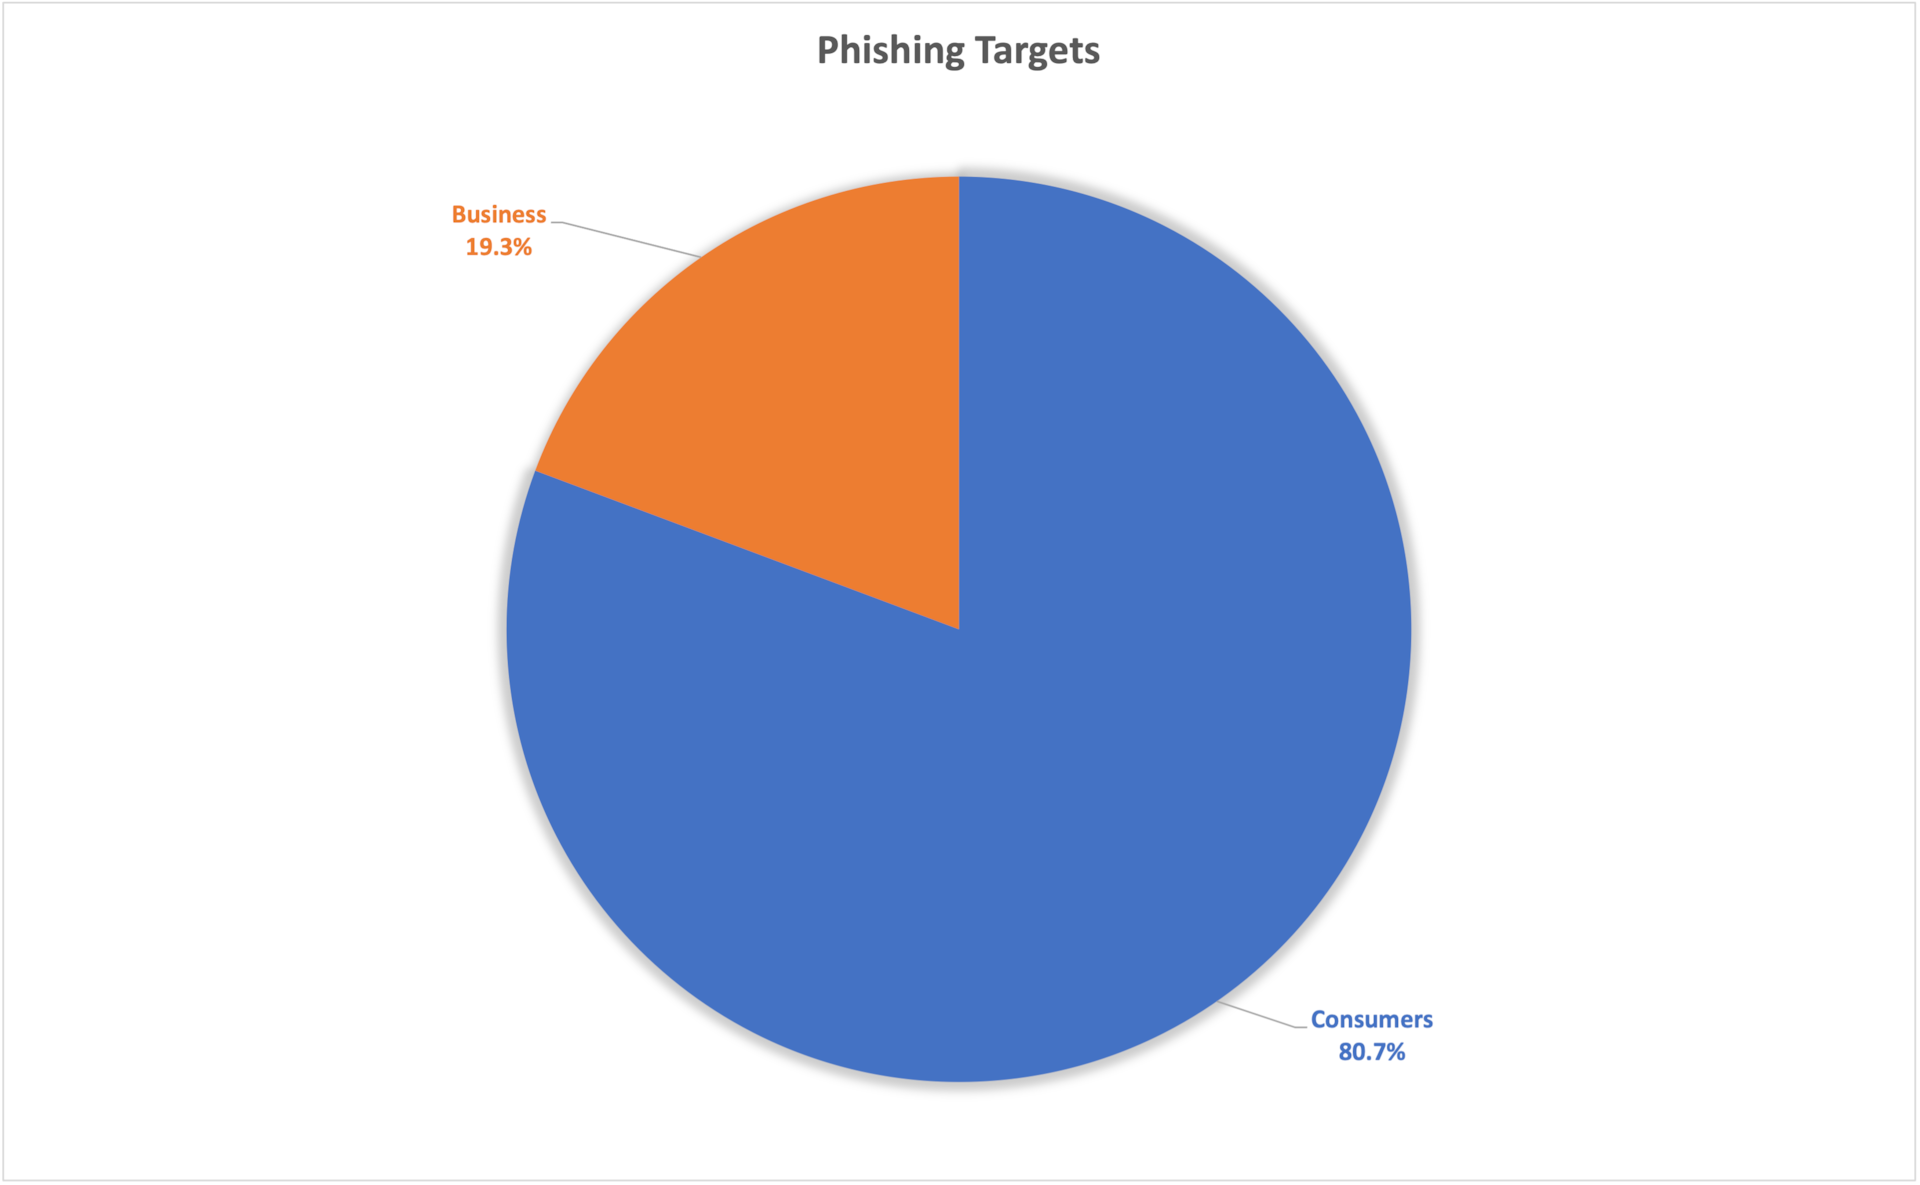 Fig. 4: Phishing targeted accounts — consumers vs. business
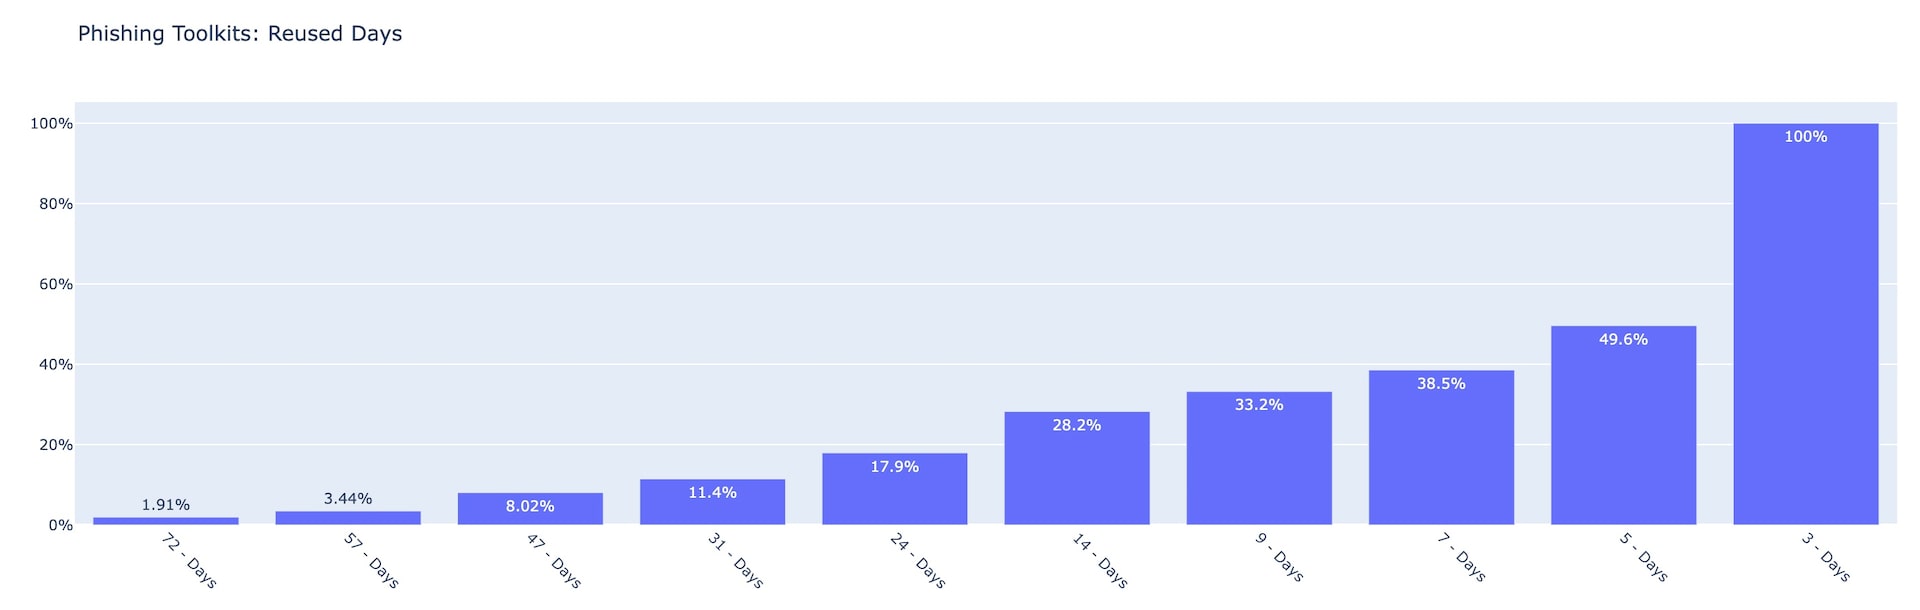 Fig. 5: Phishing toolkits by number of reused days Q2 2022
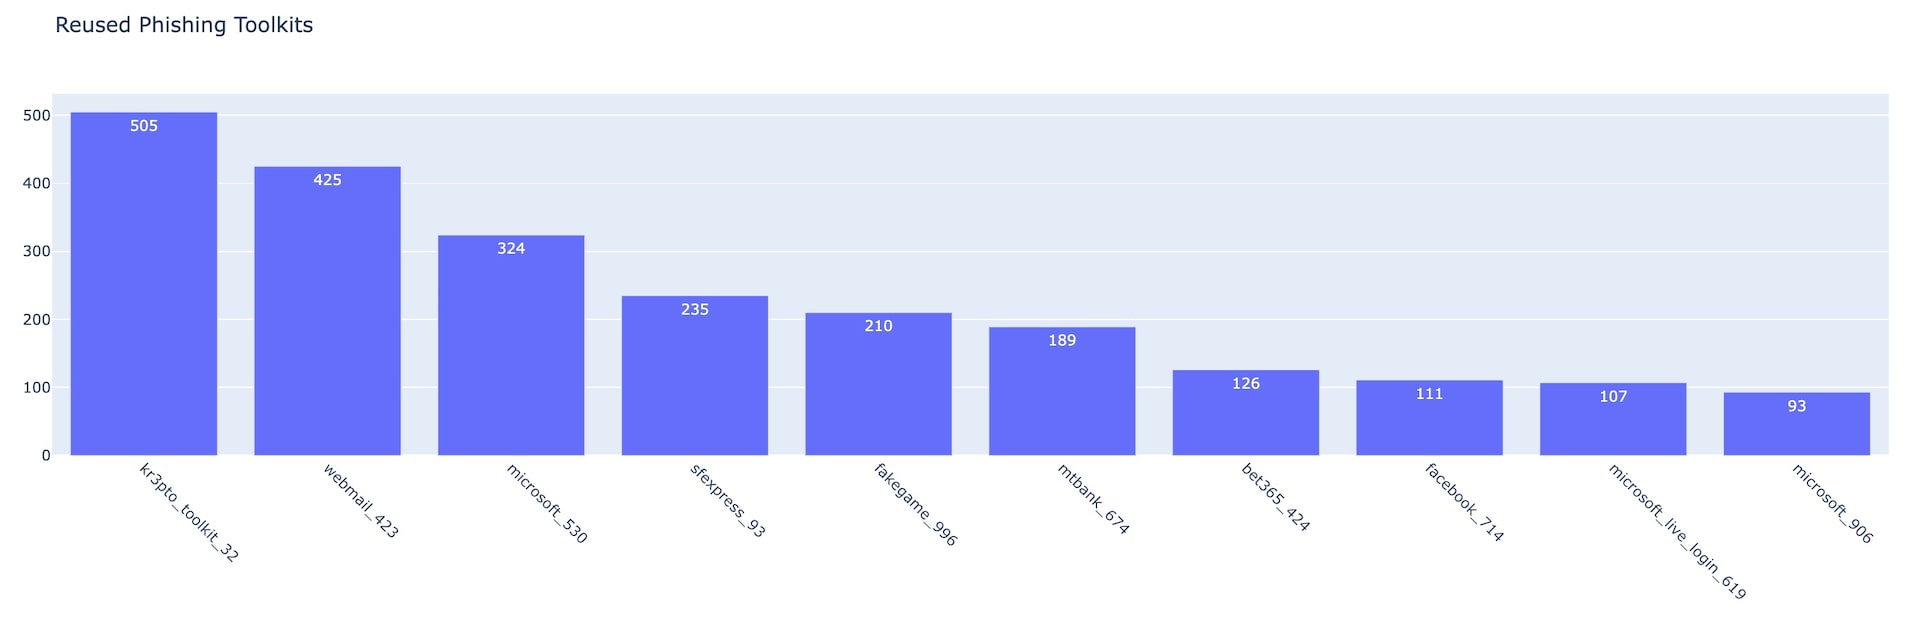 Fig. 6: Top 10 reused phishing toolkits
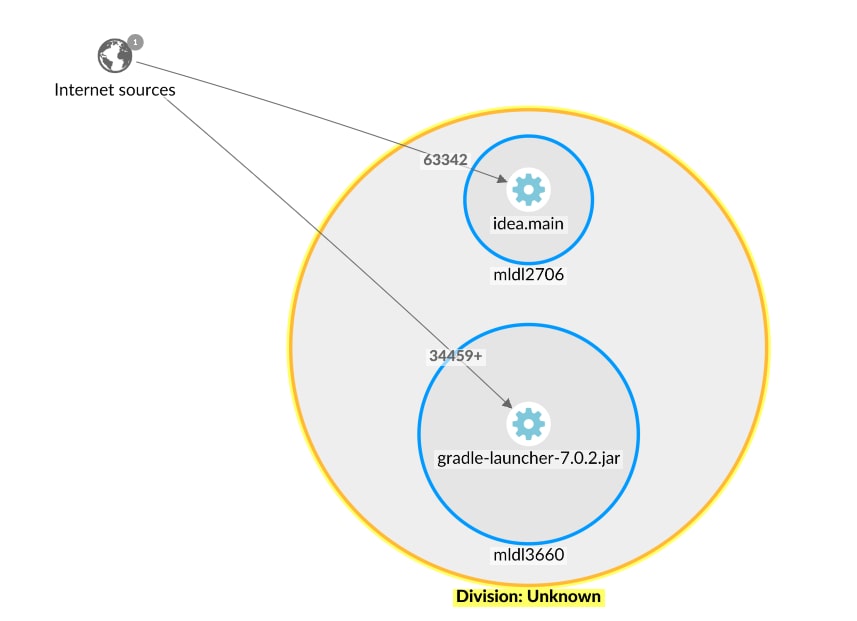
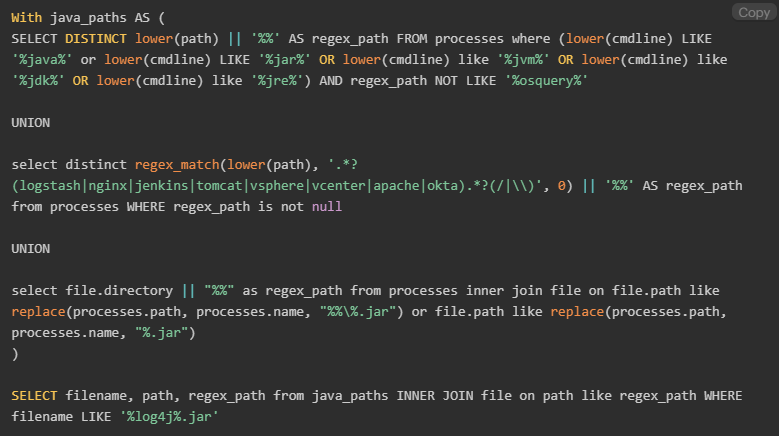
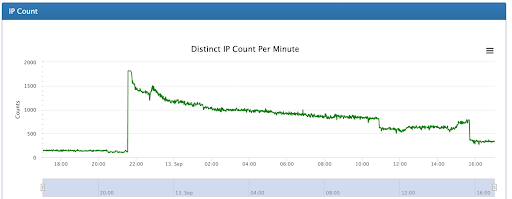
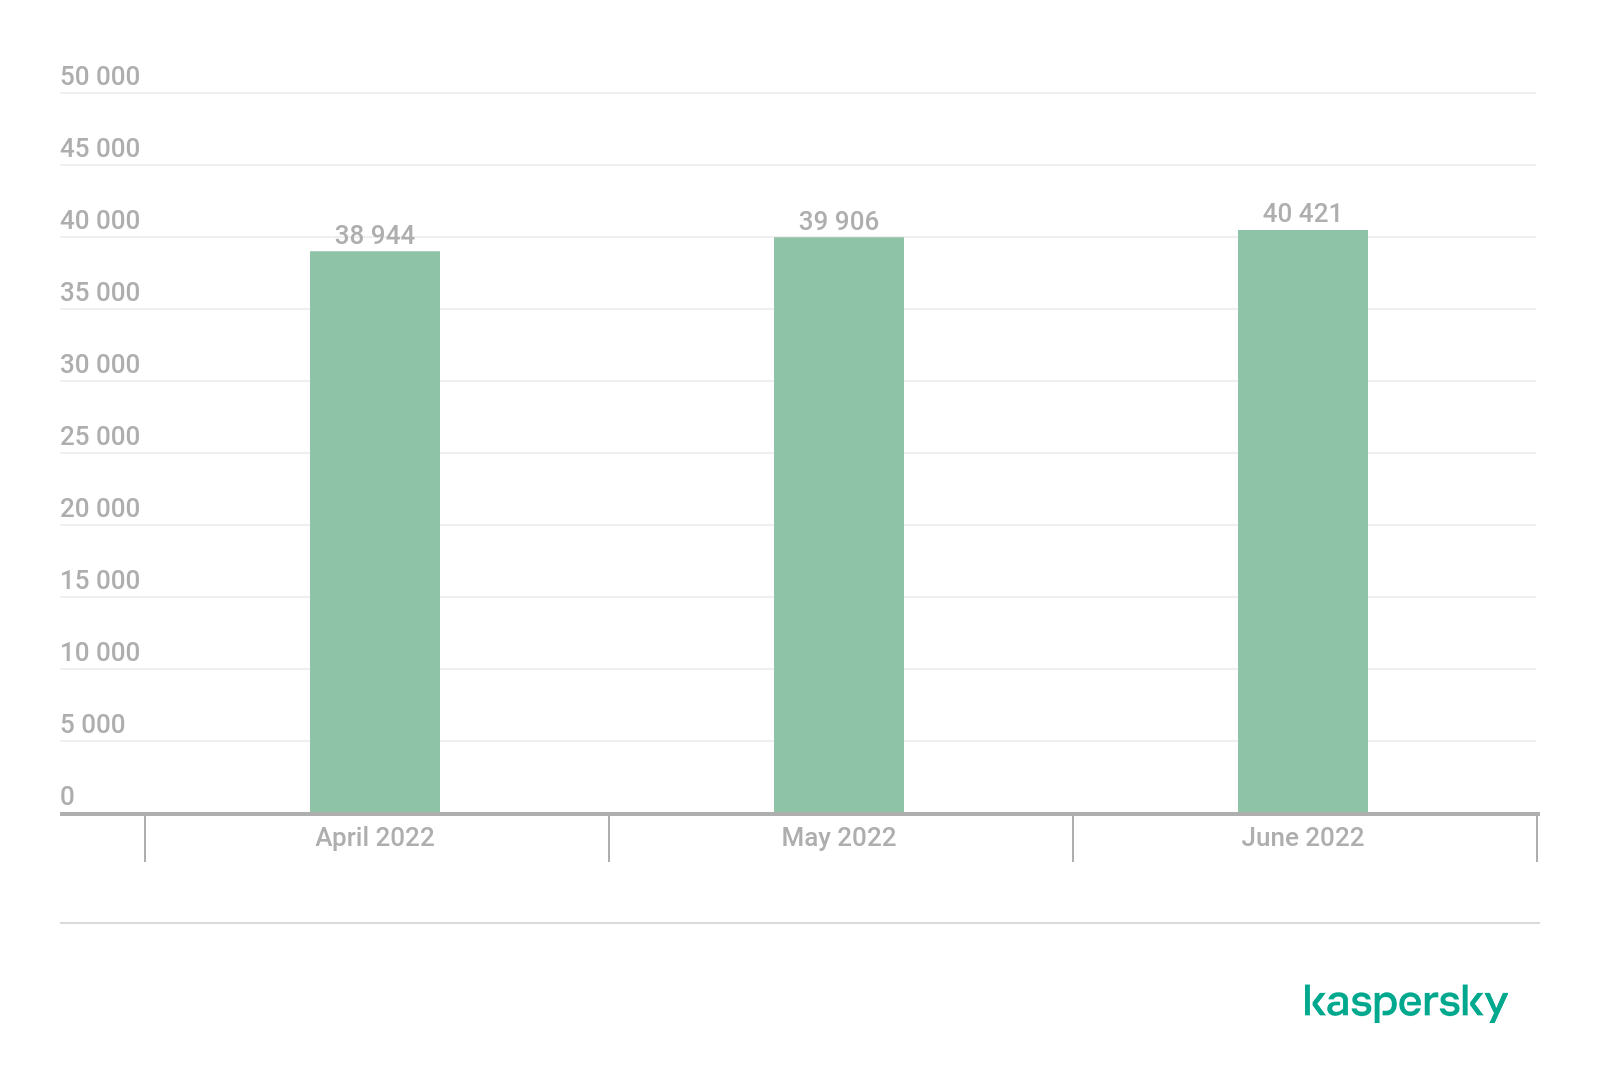
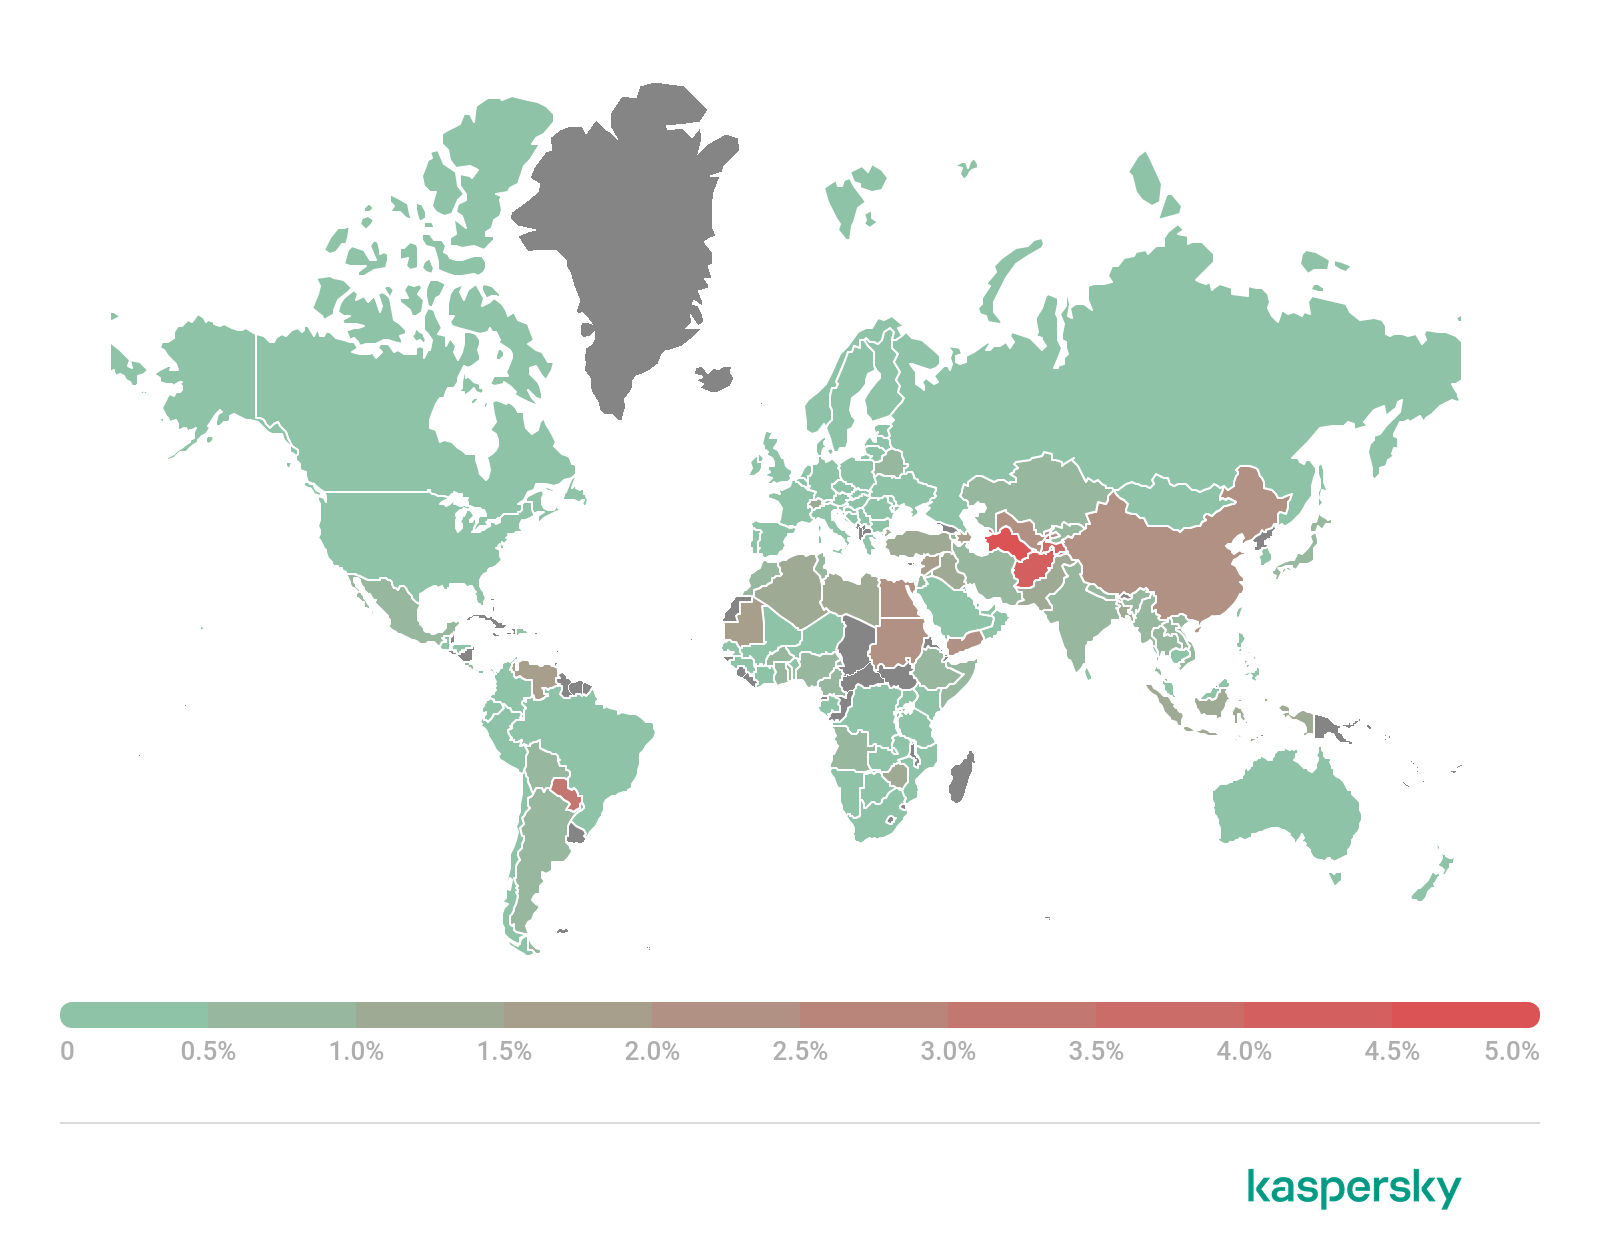
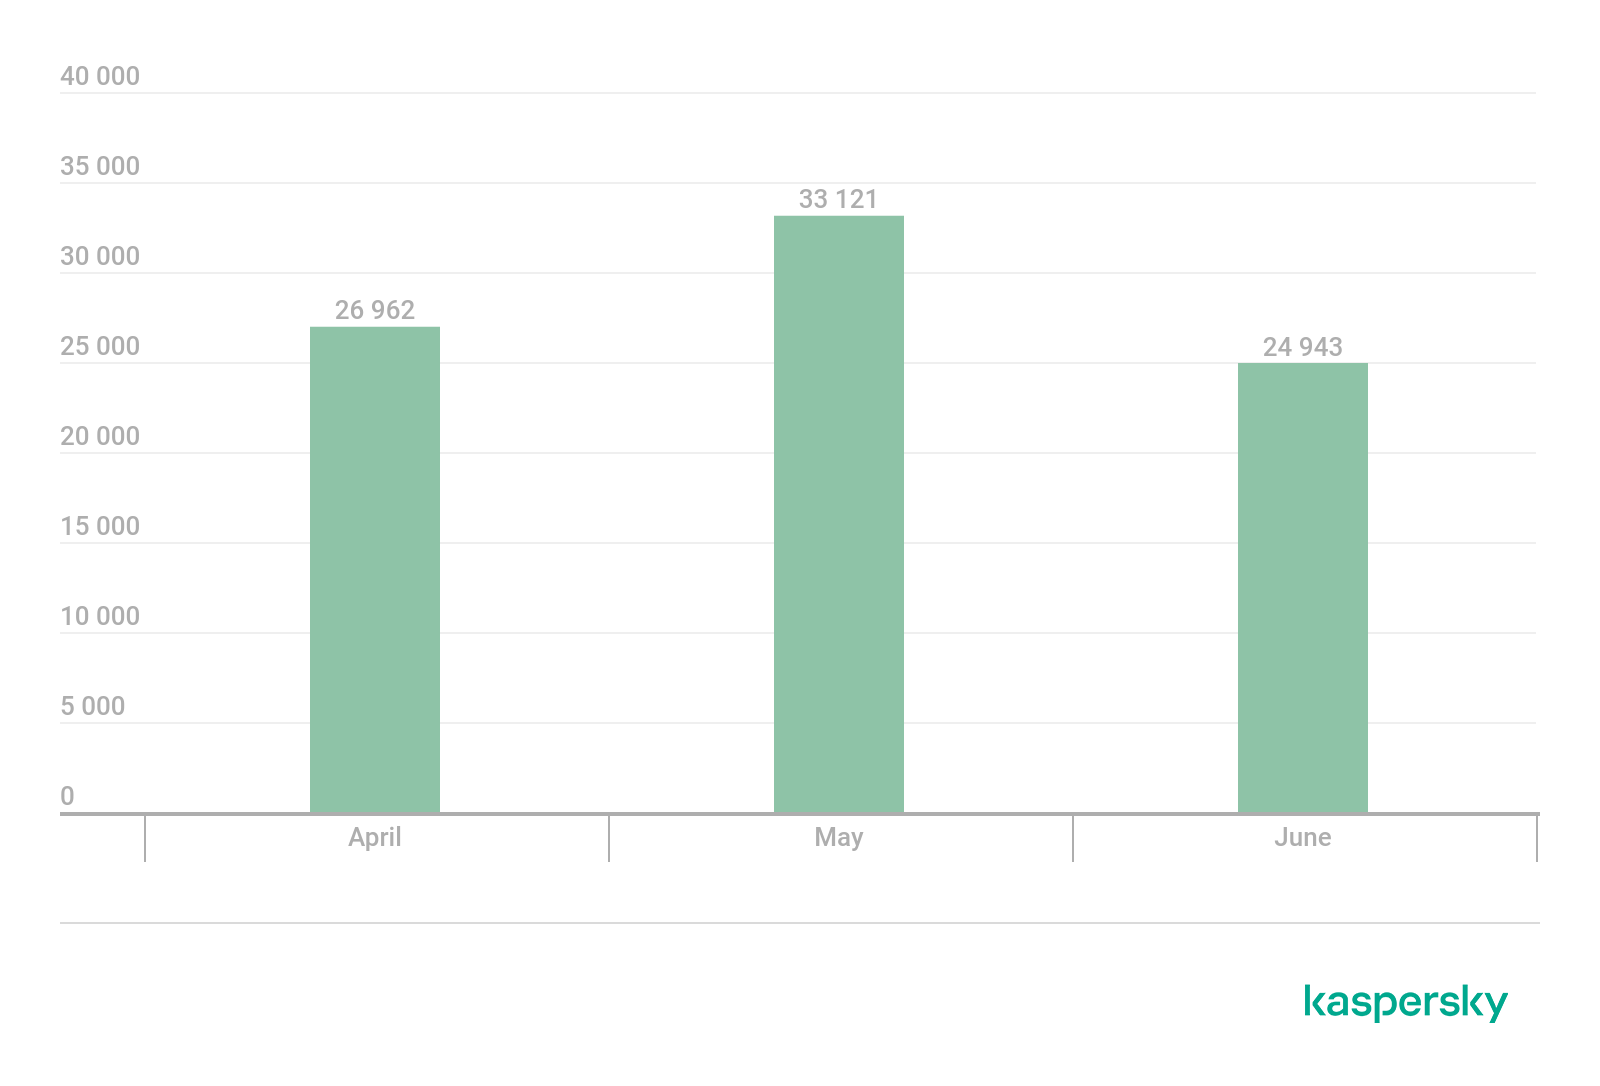
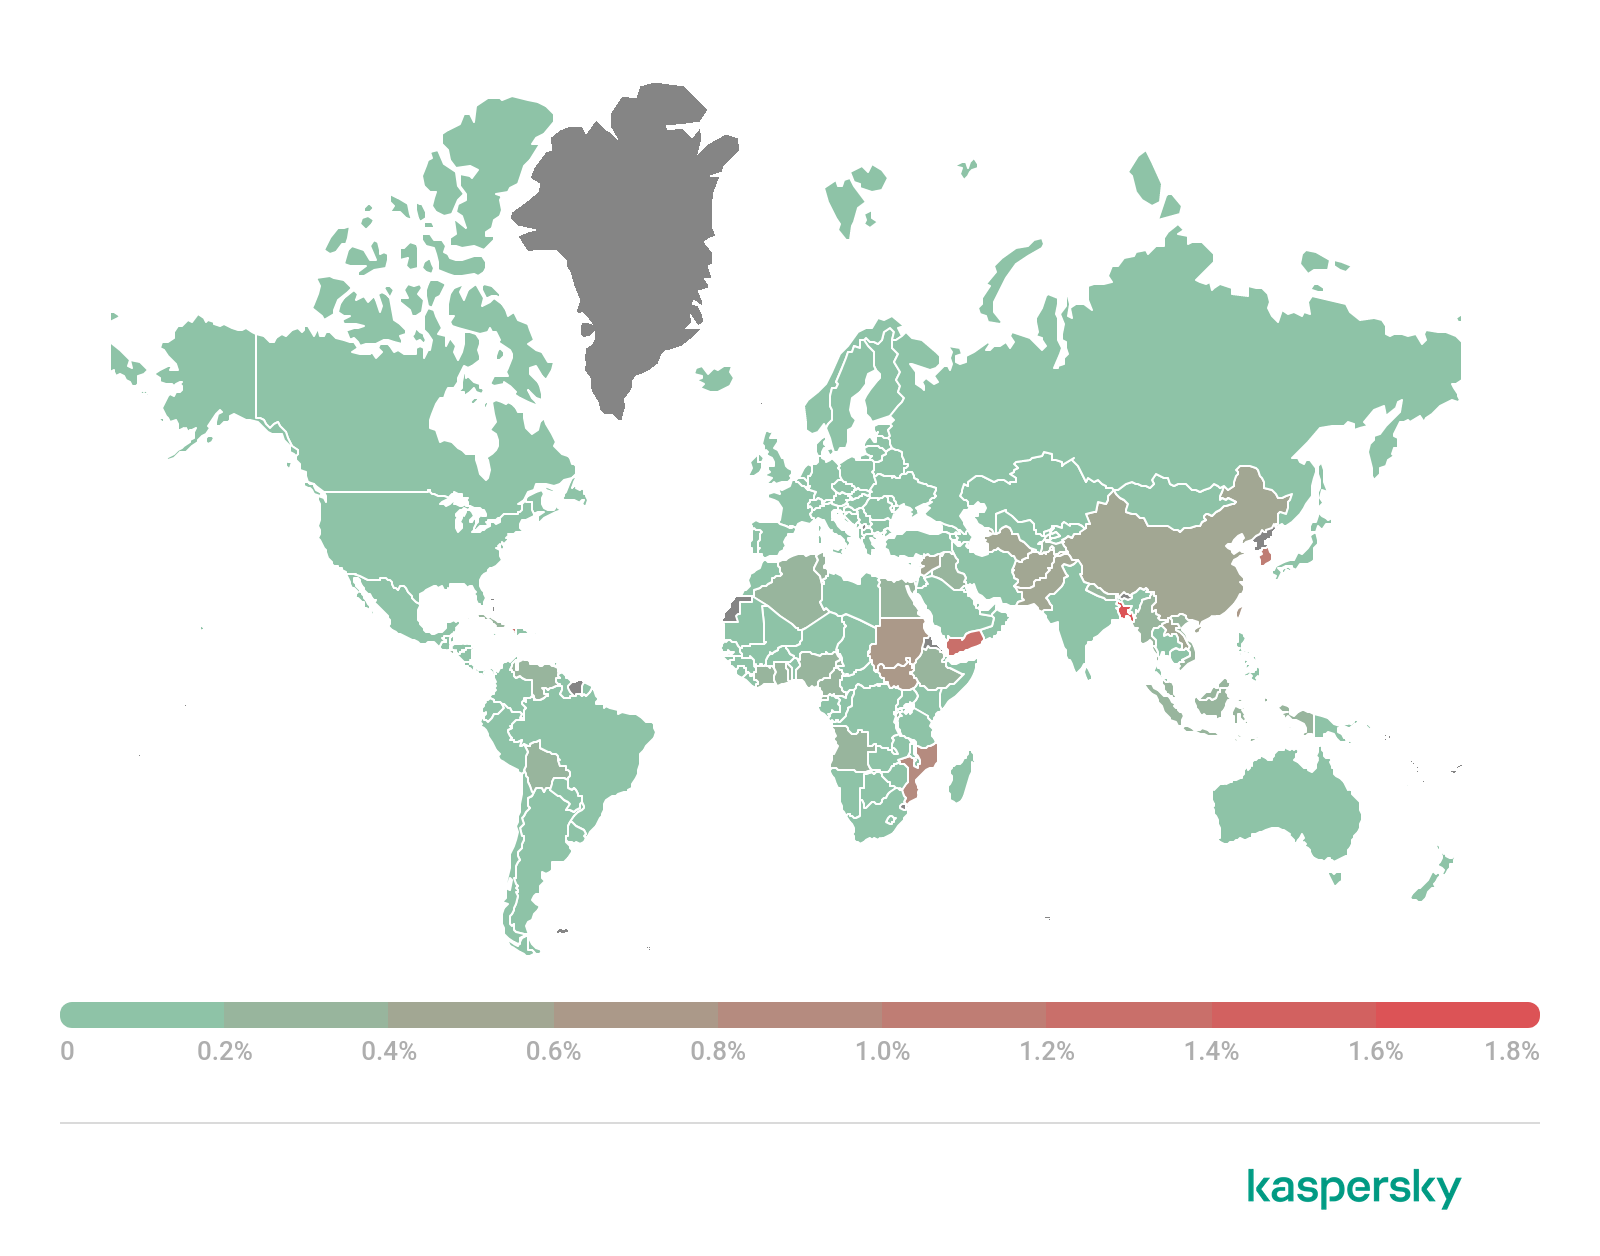
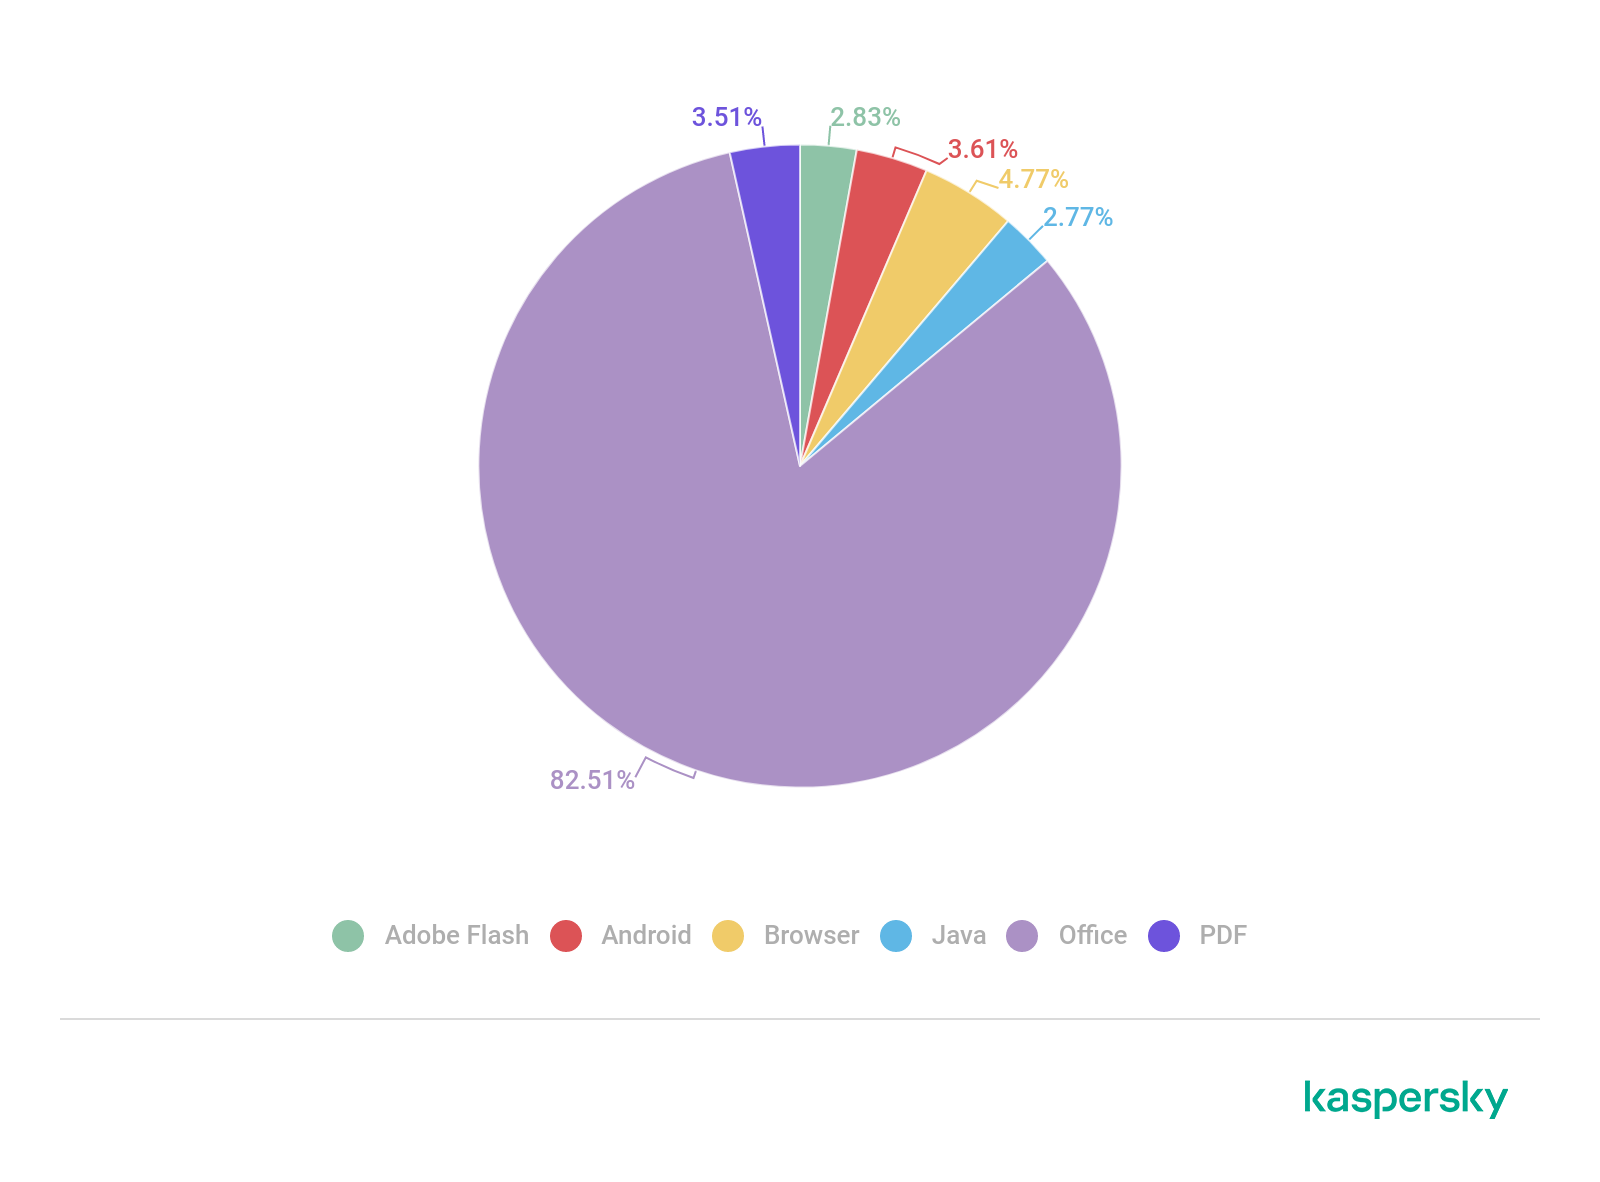
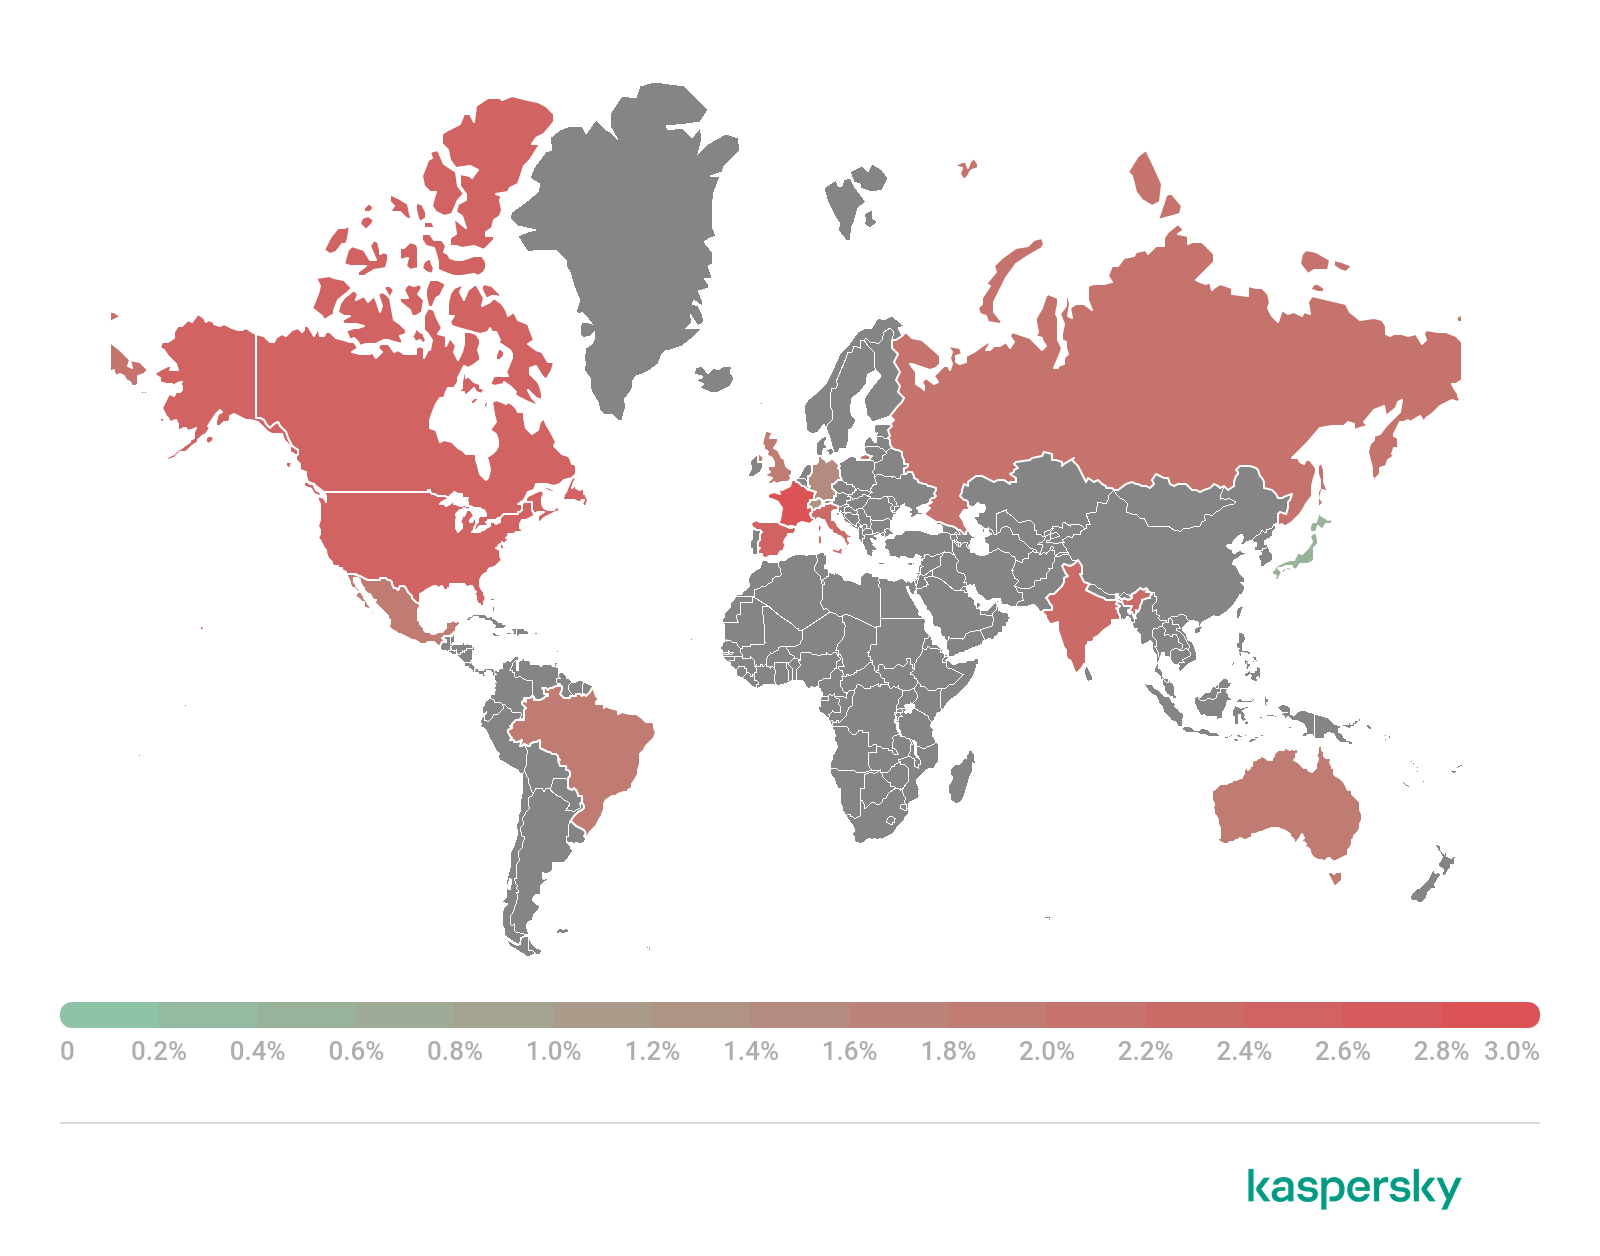
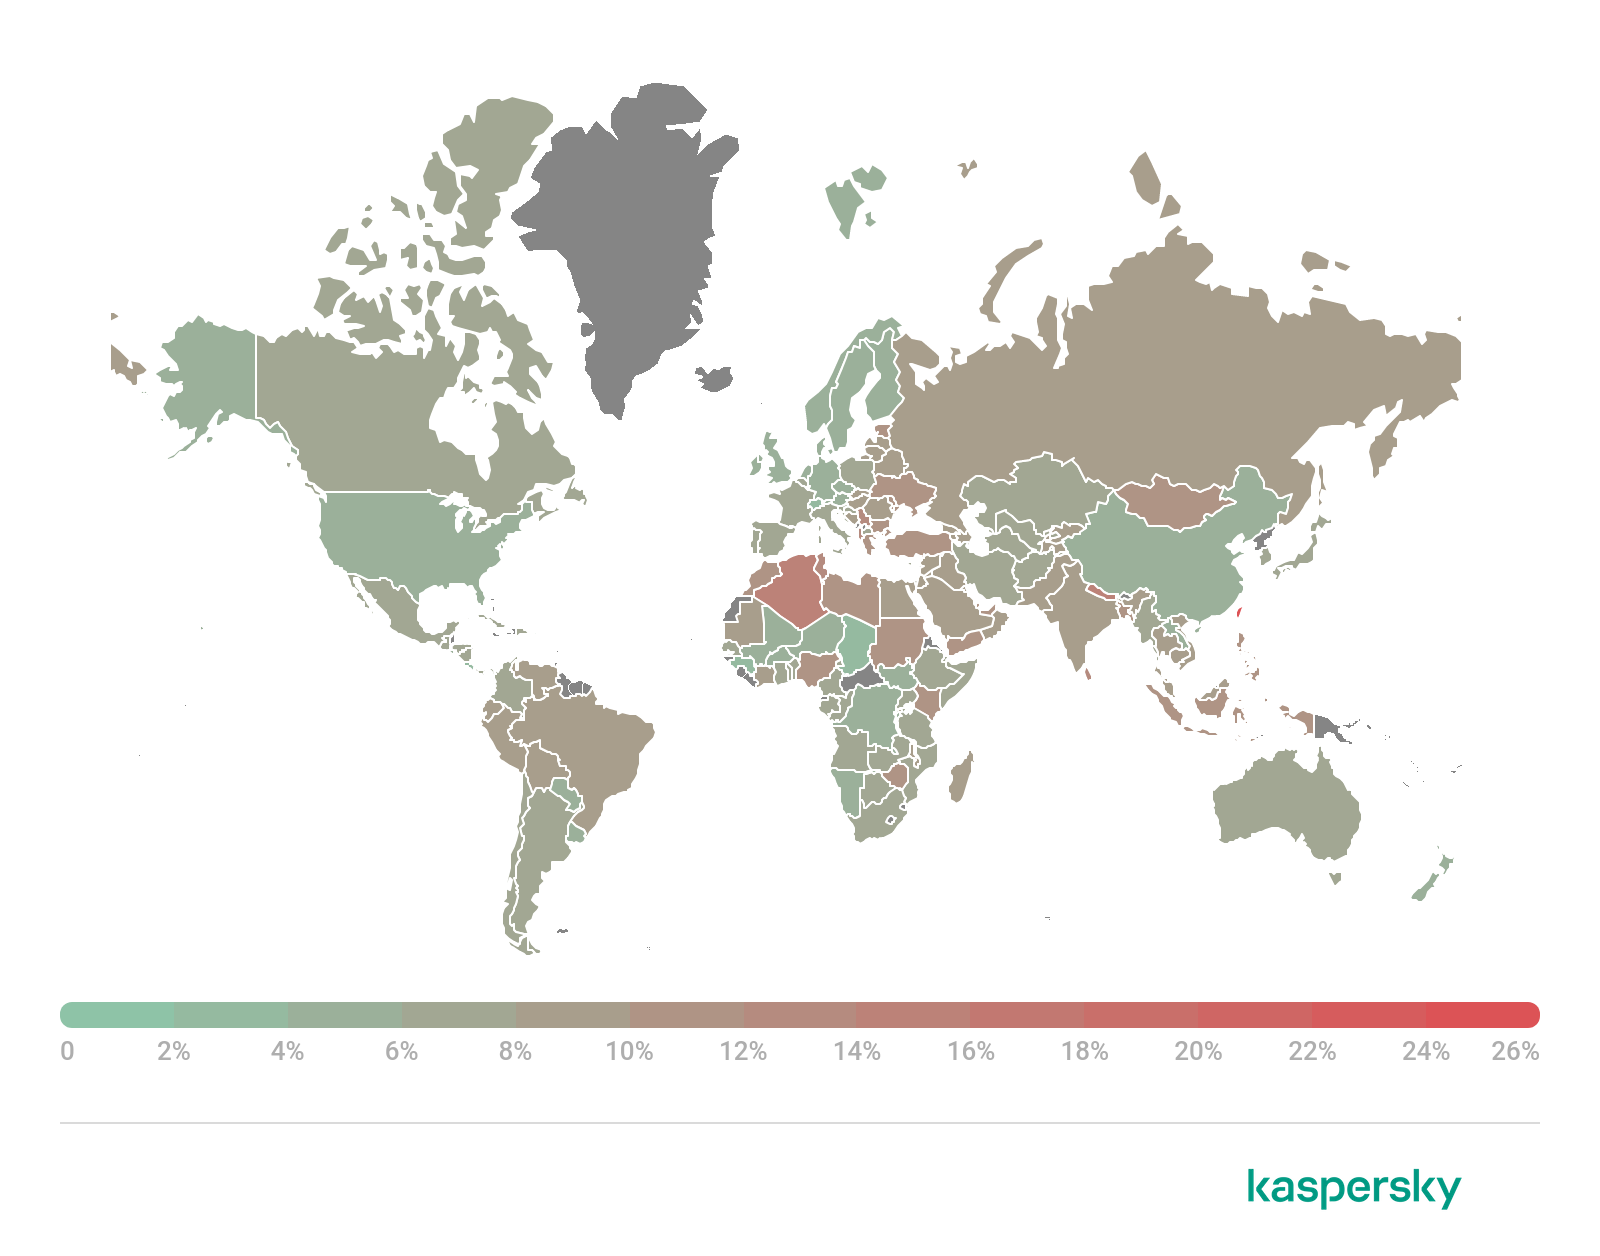
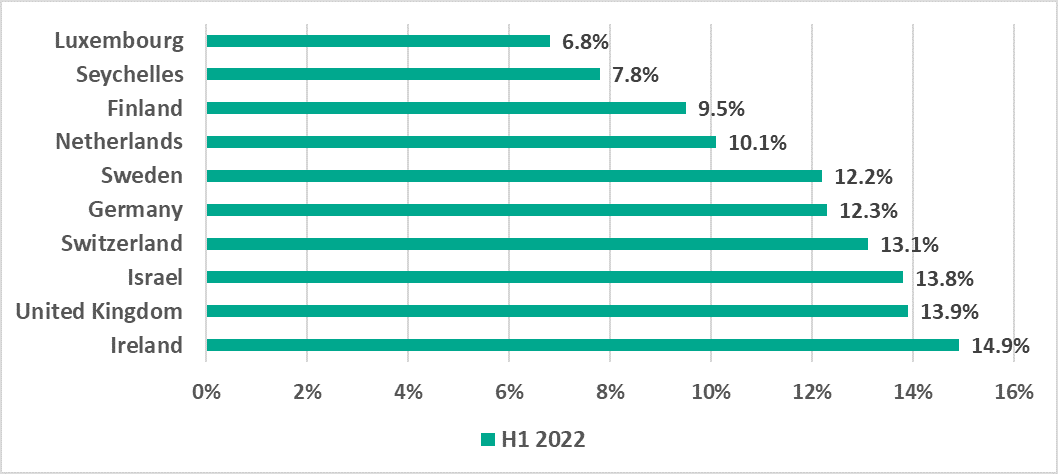
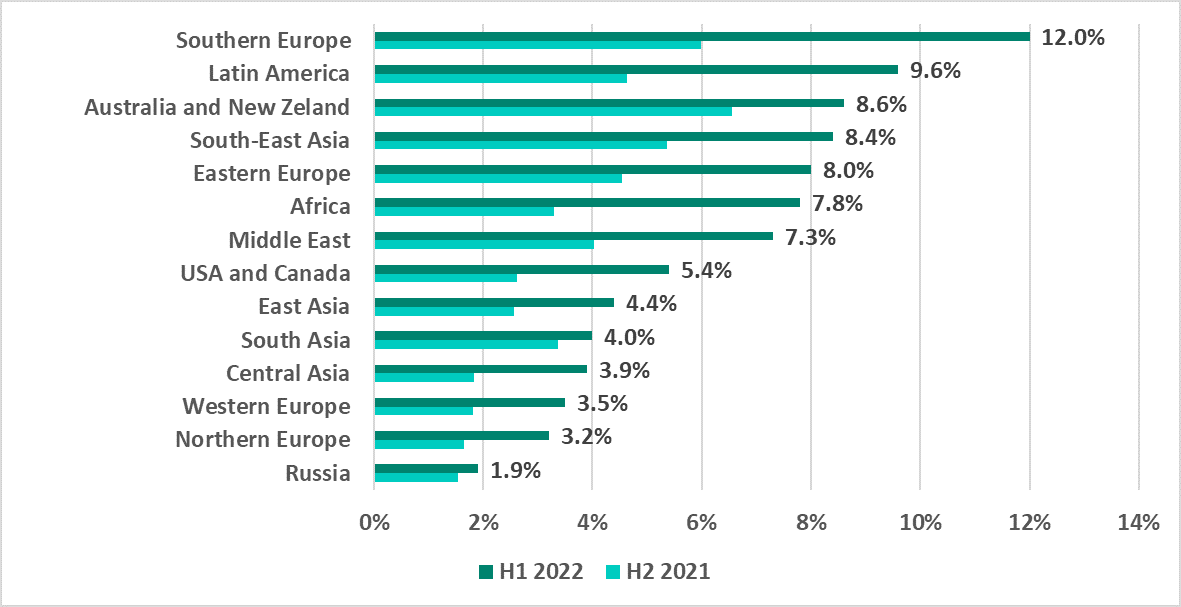
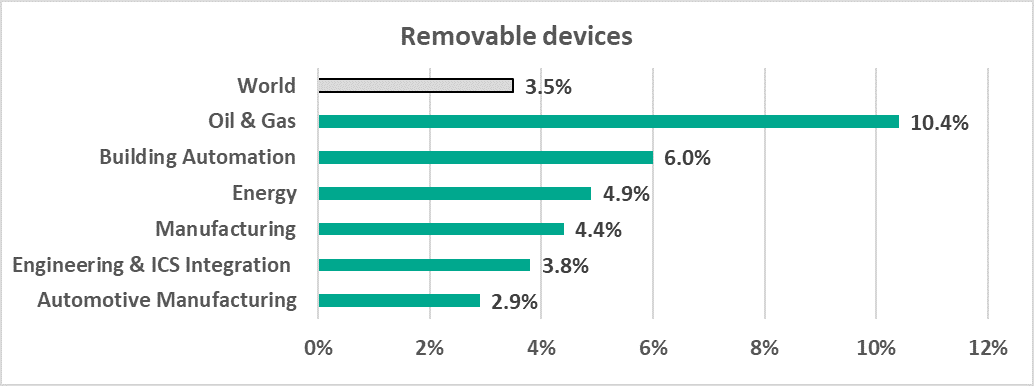
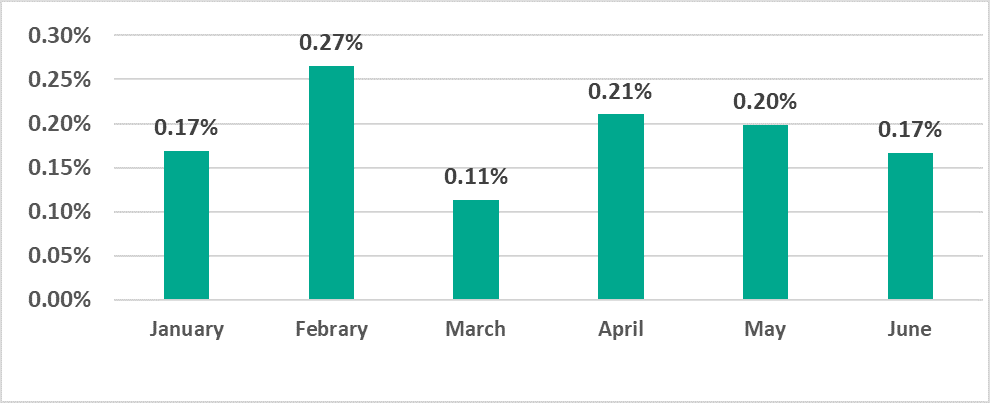
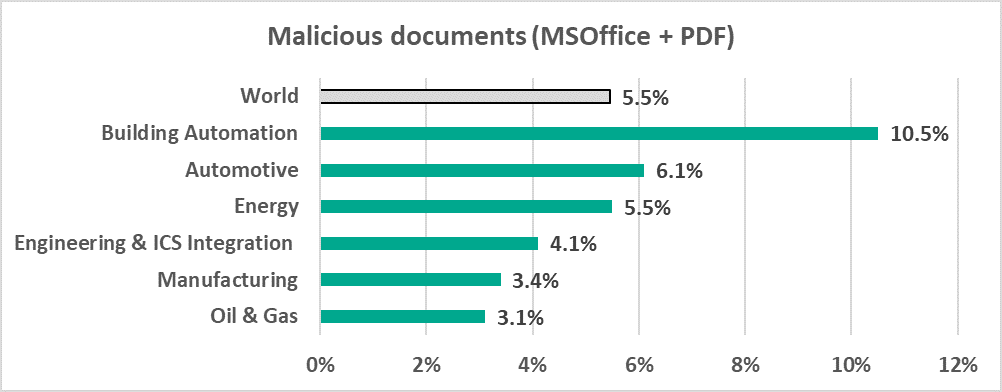
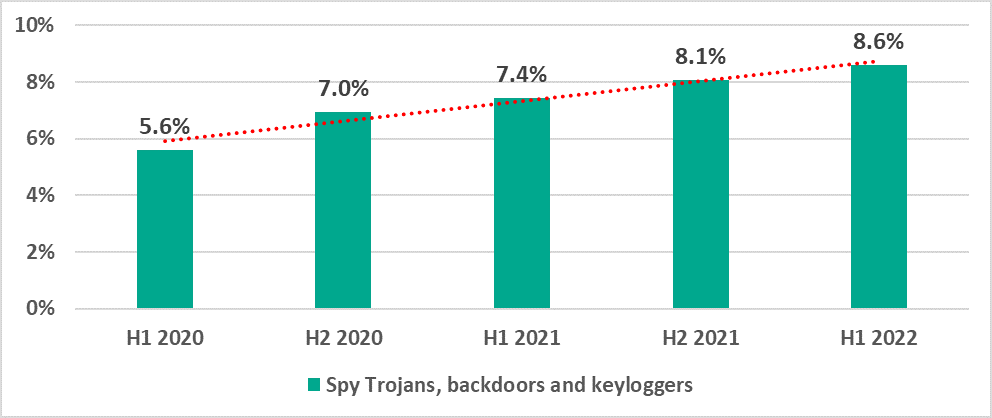
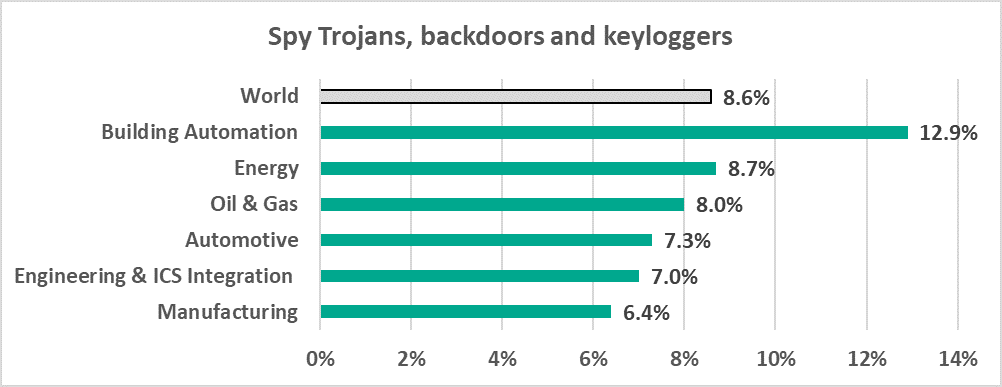
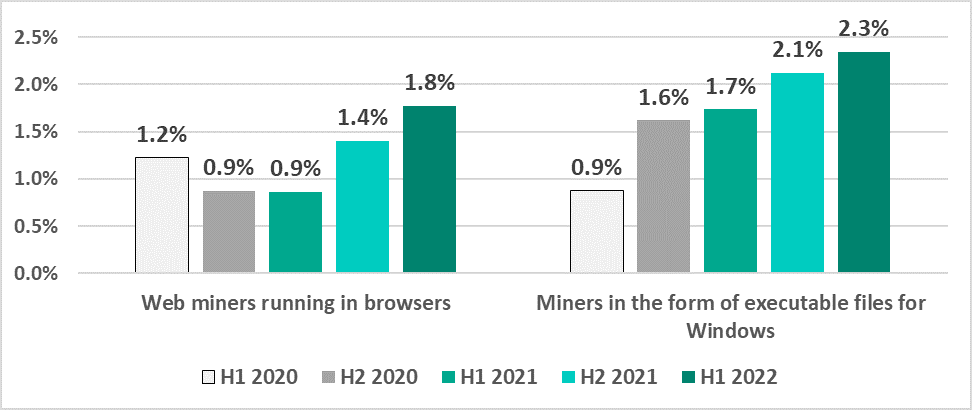
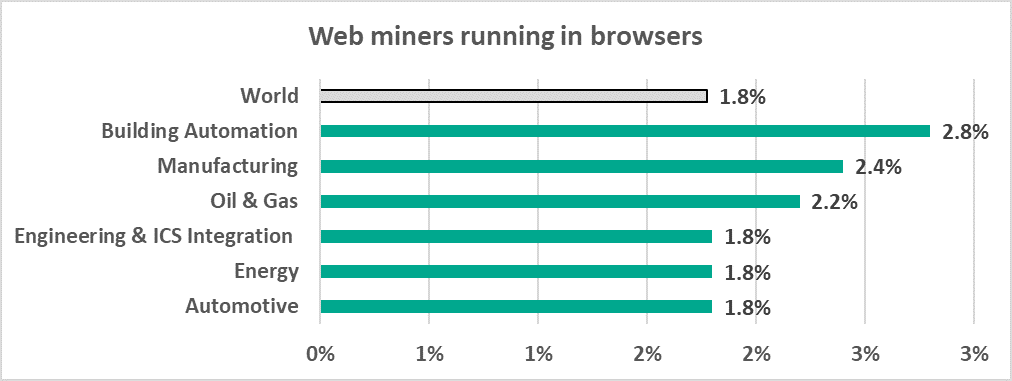