Or, more accurately, the cybercriminals responsible for July’s record-setting European DDoS attack may have never left. In the weeks following our coverage of the previous incident, the victim (a customer based in Eastern Europe) has been bombarded relentlessly with sophisticated distributed denial-of-service (DDoS) attacks, ultimately paving the way for a new European packets per second (pps) DDoS record.
On Monday, September 12, 2022, Akamai successfully detected and mitigated the now-largest DDoS attack ever launched against a European customer on the Prolexic platform, with attack traffic abruptly spiking to 704.8 Mpps in an aggressive attempt to cripple the organization’s business operations.
Attack breakdown
Adversaries are constantly evolving their techniques, tactics, and procedures to evade detection and maximize disruption, as demonstrated by this ongoing attack campaign. Let’s break down and compare the two record-setting events.
July Attack
September Attack
Peak pps
659.6 Mpps
704.8 Mpps
Cumulative Attacks
75
201
IPs Targeted
512
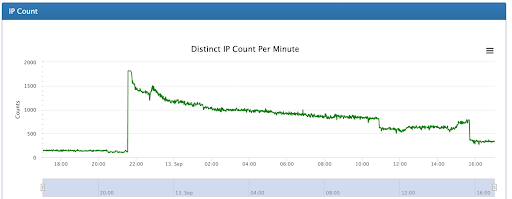
1813
Vector
UDP
UDP
Distribution
1 location
6 locations
Date of Attack
July 21, 2022
September 12, 2022
Top Scrubbing Locations
HKG, LON, TYO
HKG, TYO, LON
Prior to June 2022, this customer only saw attack traffic against its primary data center; however, they recognized the importance of a comprehensive defensive strategy early on, and onboarded their 12 remaining global data centers to the Prolexic platform for peace of mind. This proved highly fortuitous, as the attack campaign expanded unexpectedly, hitting six different global locations, from Europe to North America. These events reflect a growing trend in which adversaries are increasingly hitting deep-reconnaissance targets.
Attack mitigation
To thwart an attack of this magnitude and complexity, Akamai leveraged a balanced combination of automated and human mitigation: 99.8% of the assault was pre-mitigated thanks to the customer’s proactive defensive posture, a preemptive security measure implemented by the Akamai Security Operations Command Center (SOCC). Remaining attack traffic and follow-up attacks leveraging different vectors were swiftly mitigated by our frontline security responders. In the wake of increasingly sophisticated DDoS attacks worldwide, many businesses struggle with the staffing of internal security resources, and instead look to Akamai’s SOCC to augment and act as an extension of their incident response team.
The attackers’ command and control system had no delay in activating the multidestination attack, which escalated in 60 seconds from 100 to 1,813 IPs active per minute. Those IPs were spread across eight distinct subnets in six distinct locations. An attack this heavily distributed could drown an underprepared security team in alerts, making it difficult to assess the severity and scope of the intrusion, let alone fight the attack. Sean Lyons, Senior Vice President and General Manager of Infrastructure Security says, “Akamai Prolexic’s DDoS specialization culture, focus on customer infrastructure designs and history are rooted in defending the most complex, multifaceted attacks, and our platform is equipped with purpose-built tooling for rapid threat mitigation, even in the ‘fog of war.’ “
Akamai Prolexic’s DDoS specialization culture, focus on customer infrastructure designs and history are rooted in defending the most complex, multifaceted attacks, and our platform is equipped with purpose-built tooling for rapid threat mitigation, even in the ‘fog of war.
Sean Lyons, Senior Vice President and General Manager of Infrastructure Security
Conclusion
Having a proven DDoS mitigation strategy and platform in place is imperative for shielding your business from downtime and disruption. Learn more about Akamai’s industry-leading DDoS solutions and how our advanced attack-fighting capabilities keeps organizations safe from increasingly sophisticated threats.
Immediately review and implement Cybersecurity and Infrastructure Security Agency (CISA) recommendations.
Review critical subnets and IP spaces, and ensure that they have mitigation controls in place.
Deploy DDoS security controls in an always-on mitigation posture as a first layer of defense, to avoid an emergency integration scenario and to reduce the burden on incident responders. If you don’t have a trusted and proven cloud-based provider, get one now.
Proactively pull together a crisis response team and ensure runbooks and incident response plans are up-to-date. For example, do you have a runbook to deal with catastrophic events? Are the contacts within the playbooks updated? A playbook that references outdated tech assets or people who have long left the company isn’t going to help.
For additional information on the steps you can take to protect your organization, please visit the following CISA resources:
The James Webb Telescope reveals emerging stellar nurseries and individual stars in the Carina Nebula that were previously obscured. Credits: NASA, ESA, CSA, and STScI. Full image here.
“Somewhere, something incredible is waiting to be known.” — Carl Sagan
In the past few years, space technology and travel have been trending with increased attention and endeavors (including private ones). In our 2021 Year in Review we showed how NASA and SpaceX flew higher, at least in terms of interest on the Internet.
This week, NASA in collaboration with the European Space Agency (ESA) and the Canadian Space Agency (CSA), released the first images from the James Webb Telescope (JWST) which conducts infrared astronomy to “reveal the unseen universe”.
Webb’s First Deep Field is the first operational image taken by the James Webb Space Telescope, depicting a galaxy cluster with a distance of 5.12 billion light-years from Earth. Revealed to the public on 11 July 2022. Credits: NASA, ESA, CSA, and STScI. Full image here.
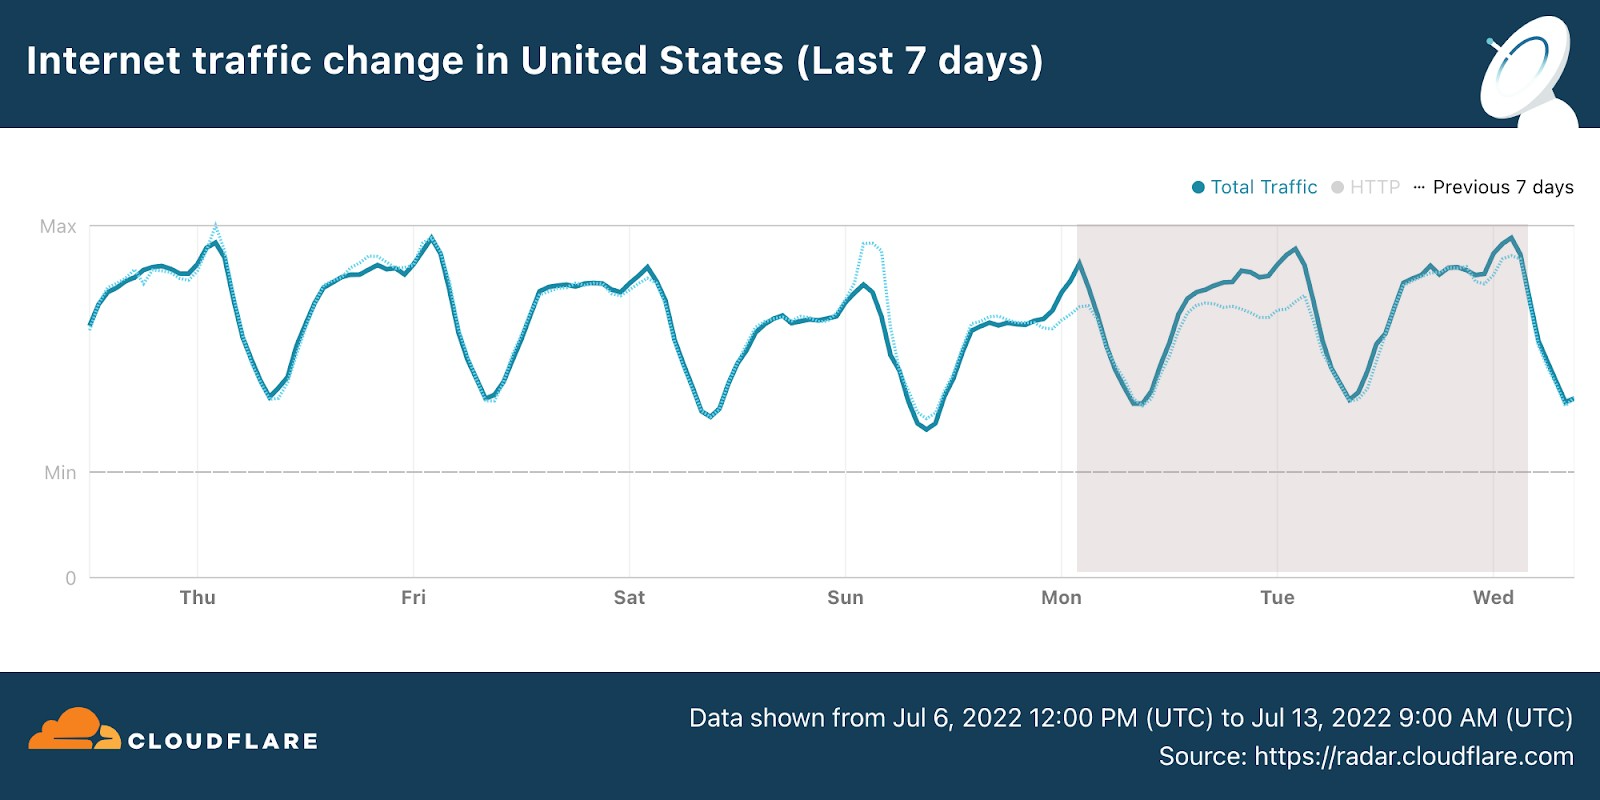
So, let’s dig into something we really like here at Cloudflare, checking how real life and human interest has an impact on the Internet. In terms of general Internet traffic in the US, Radar shows us that there was an increase both on July 11 and July 12, compared to the previous week (bear in mind that July 4, the previous Monday, was the Independence Day holiday in the US).
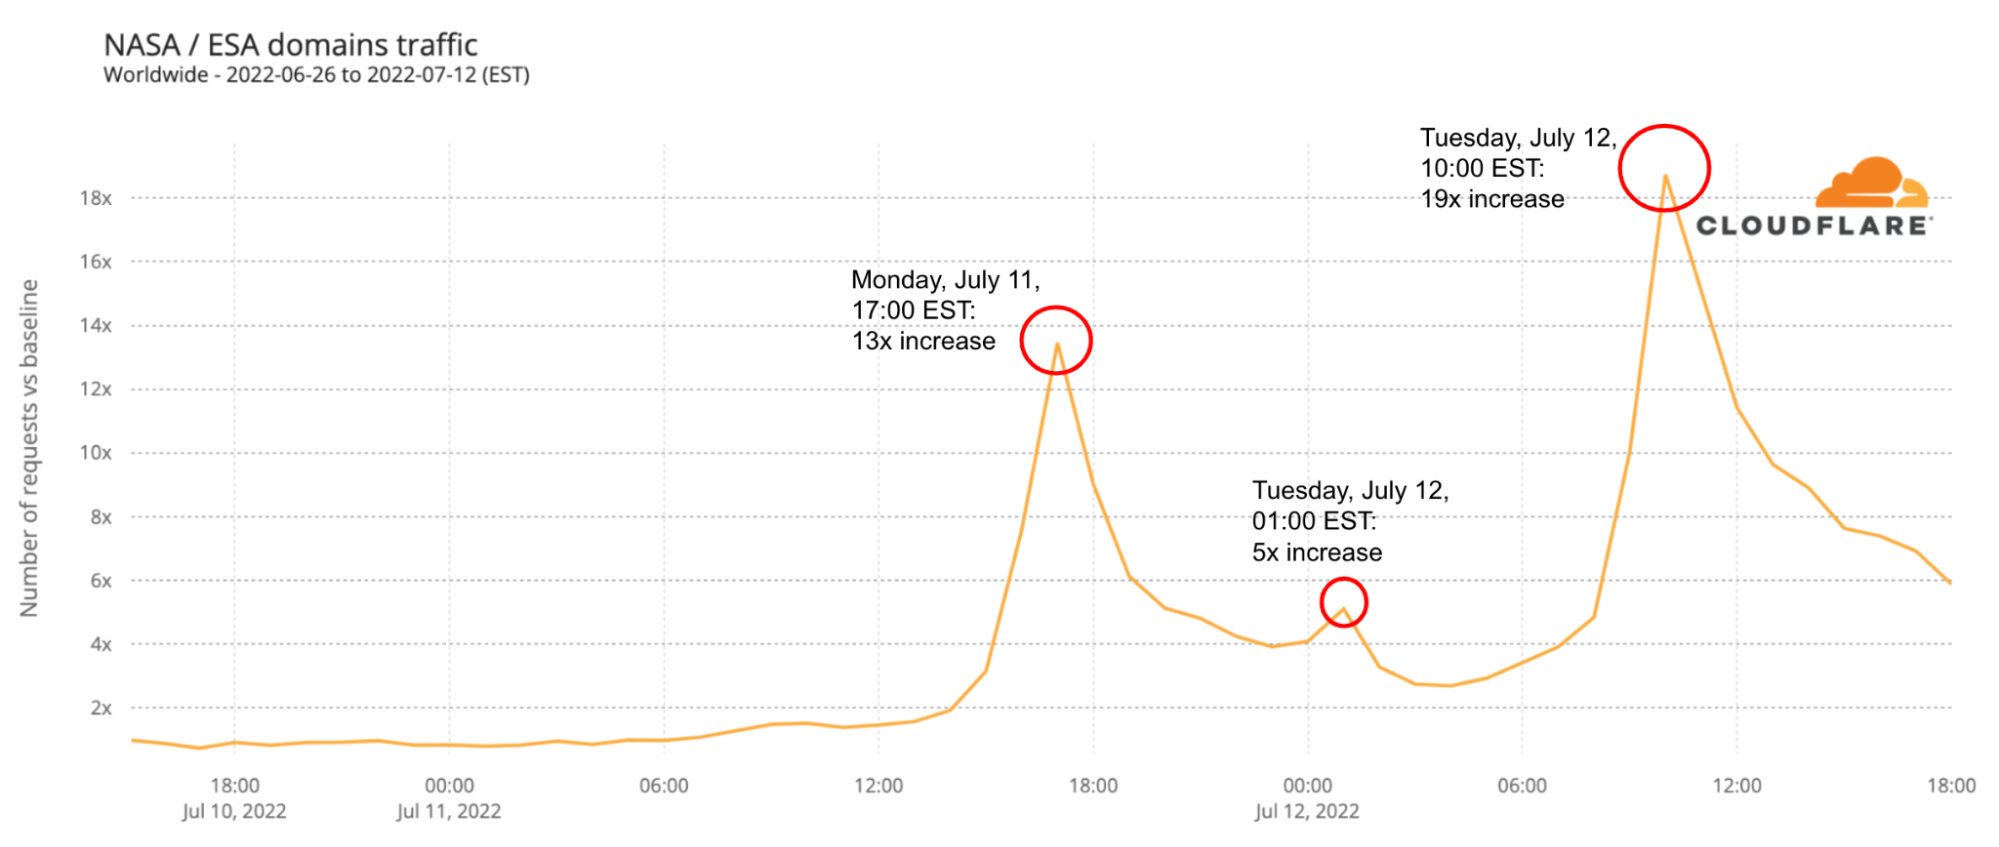
Next, we look at DNS request trends to get a sense of traffic to Internet properties (and using from this point on EST time in all the charts). Let’s start with the cornucopia of NASA, ESA and other websites (there are many, some dedicated just to the James Webb Telescope findings).
There are two clear spikes in the next chart. The first was around the time the first galaxy cluster infrared image was announced by Joe Biden, on Monday, July 11, 2022 (at 17:00), with traffic rising 13x higher than in the previous week. There was also a 5x spike at 01:00 EST that evening. The second spike was higher and longer and happened during Tuesday, July 12, 2022, when more images were revealed. Tuesday’s peak was at 10:00, with traffic being 19x higher than in the previous week — traffic was higher than 10x between 09:00 and 13:00.
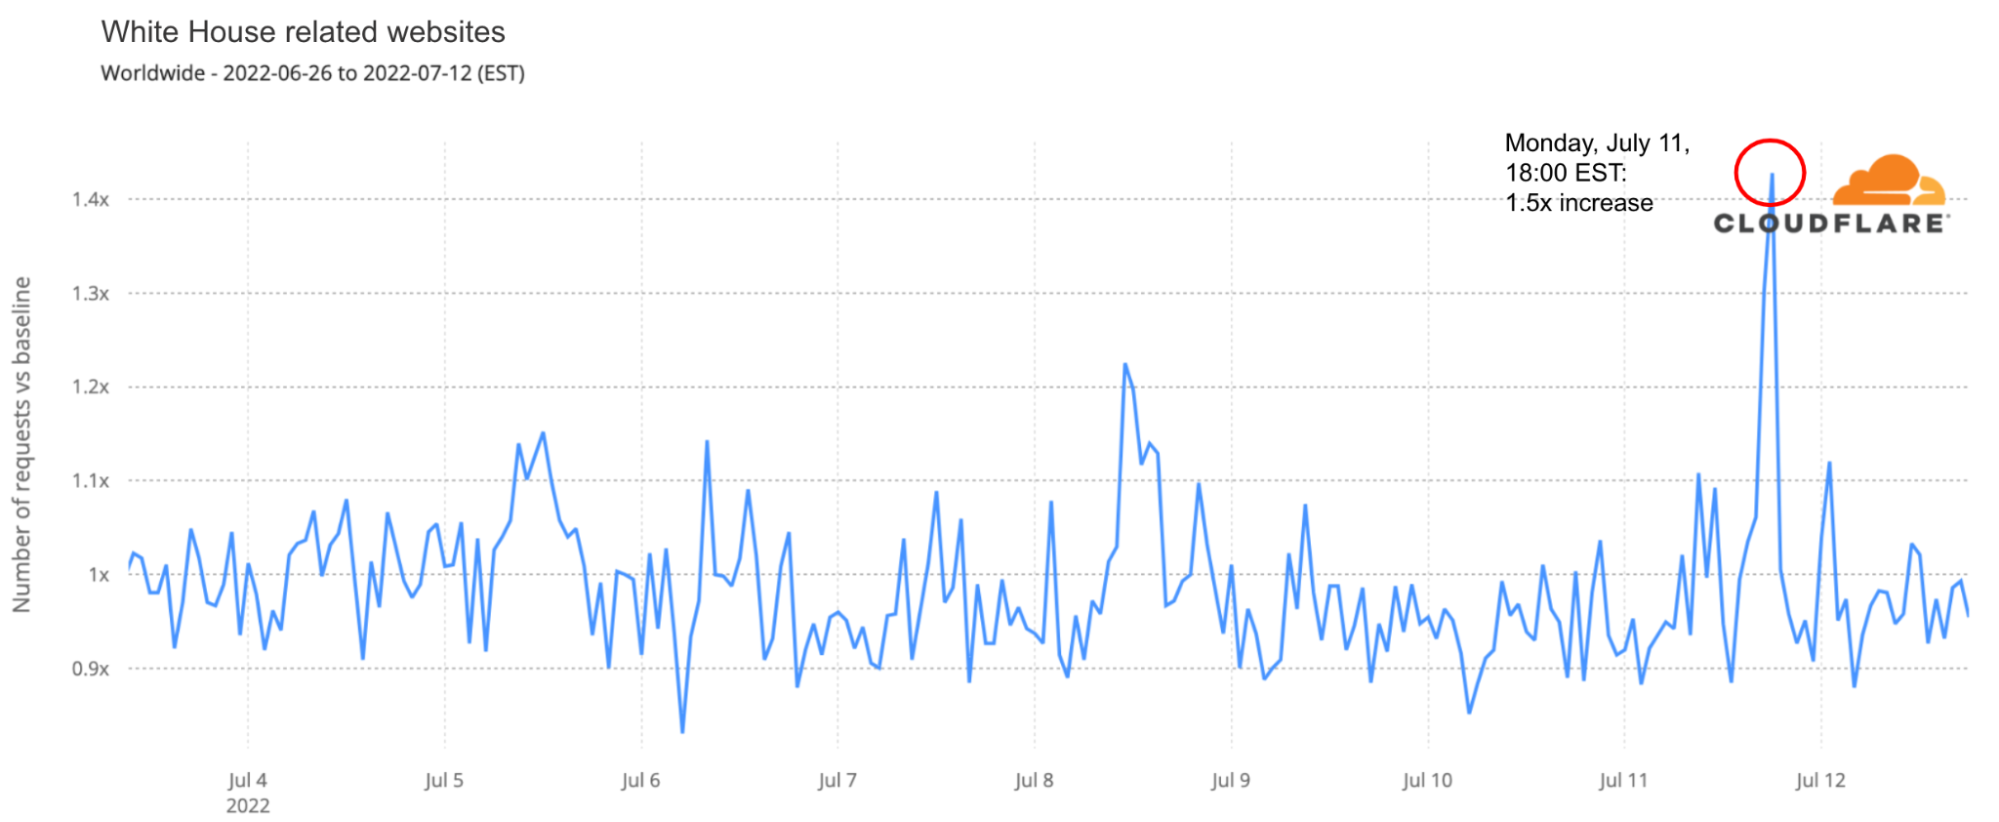
The first image was presented by US president at around 17:00 on July 11. DNS traffic was 1.5x higher to White House-related websites than any time in the preceding month.
Conclusion: space, the final frontier
As we saw in 2021, space projects and announcements continue to have a clear impact on the Internet, in this case in our DNS request view of Internet traffic. So far, what the James Webb Telescope images are showing us is a glimpse of a never-before-seen picture of parts of the universe (there’s no lack of excitement in Cloudflare’s internal chat groups).
You can keep an eye on these and other trends using Cloudflare Radar and follow @CloudflareRadar on Twitter — recently we covered extensively Canada’s Internet outage.
Visit 1.1.1.1 from any device to get started with our free app that makes your Internet faster and safer.
To learn more about our mission to help build a better Internet, start here. If you’re looking for a new career direction, check out our open positions.
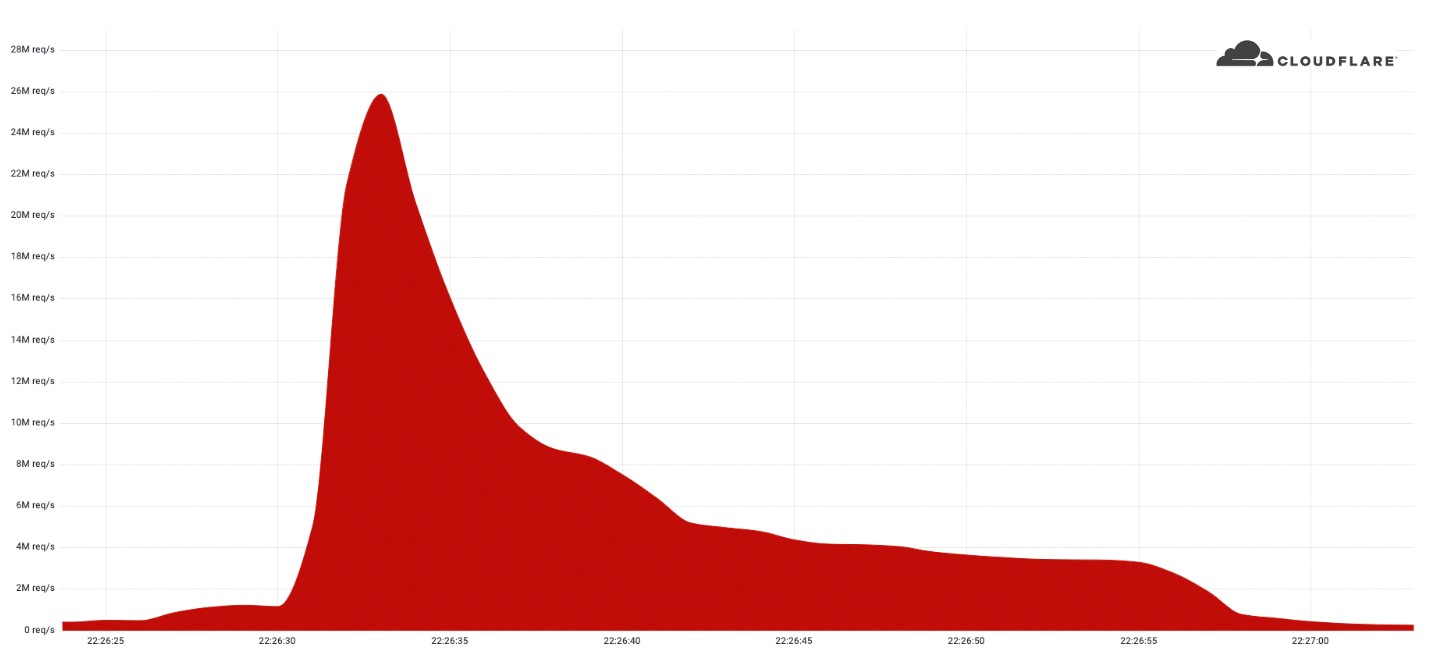
In June 2022, we reported on the largest HTTPS DDoS attack that we’ve ever mitigated — a 26 million request per second attack – the largest attack on record. Our systems automatically detected and mitigated this attack and many more. Since then, we have been tracking this botnet, which we’ve called “Mantis”, and the attacks it has launched against almost a thousand Cloudflare customers.
Cloudflare WAF/CDN customers are protected against HTTP DDoS attacks including Mantis attacks. Please refer to the bottom of this blog for additional guidance on how to best protect your Internet properties against DDoS attacks.
Have you met Mantis?
We named the botnet that launched the 26M rps (requests per second) DDoS attack “Mantis” as it is also like the Mantis shrimp, small but very powerful. Mantis shrimps, also known as “thumb-splitters”, are very small; less than 10 cm in length, but their claws are so powerful that they can generate a shock wave with a force of 1,500 Newtons at speeds of 83 km/h from a standing start. Similarly, the Mantis botnet operates a small fleet of approximately 5,000 bots, but with them can generate a massive force — responsible for the largest HTTP DDoS attacks we have ever observed.
The Mantis botnet was able to generate the 26M HTTPS requests per second attack using only 5,000 bots. I’ll repeat that: 26 million HTTPS requests per second using only 5,000 bots. That’s an average of 5,200 HTTPS rps per bot. Generating 26M HTTP requests is hard enough to do without the extra overhead of establishing a secure connection, but Mantis did it over HTTPS. HTTPS DDoS attacks are more expensive in terms of required computational resources because of the higher cost of establishing a secure TLS encrypted connection. This stands out and highlights the unique strength behind this botnet.
As opposed to “traditional” botnets that are formed of Internet of Things (IoT) devices such as DVRs, CC cameras, or smoke detectors, Mantis uses hijacked virtual machines and powerful servers. This means that each bot has a lot more computational resources — resulting in this combined thumb-splitting strength.
Mantis is the next evolution of the Meris botnet. The Meris botnet relied on MikroTik devices, but Mantis has branched out to include a variety of VM platforms and supports running various HTTP proxies to launch attacks. The name Mantis was chosen to be similar to “Meris” to reflect its origin, and also because this evolution hits hard and fast. Over the past few weeks, Mantis has been especially active directing its strengths towards almost 1,000 Cloudflare customers.
Who is Mantis attacking?
In our recent DDoS attack trends report, we talked about the increasing number of HTTP DDoS attacks. In the past quarter, HTTP DDoS attacks increased by 72%, and Mantis has surely contributed to that growth. Over the past month, Mantis has launched over 3,000 HTTP DDoS attacks against Cloudflare customers.
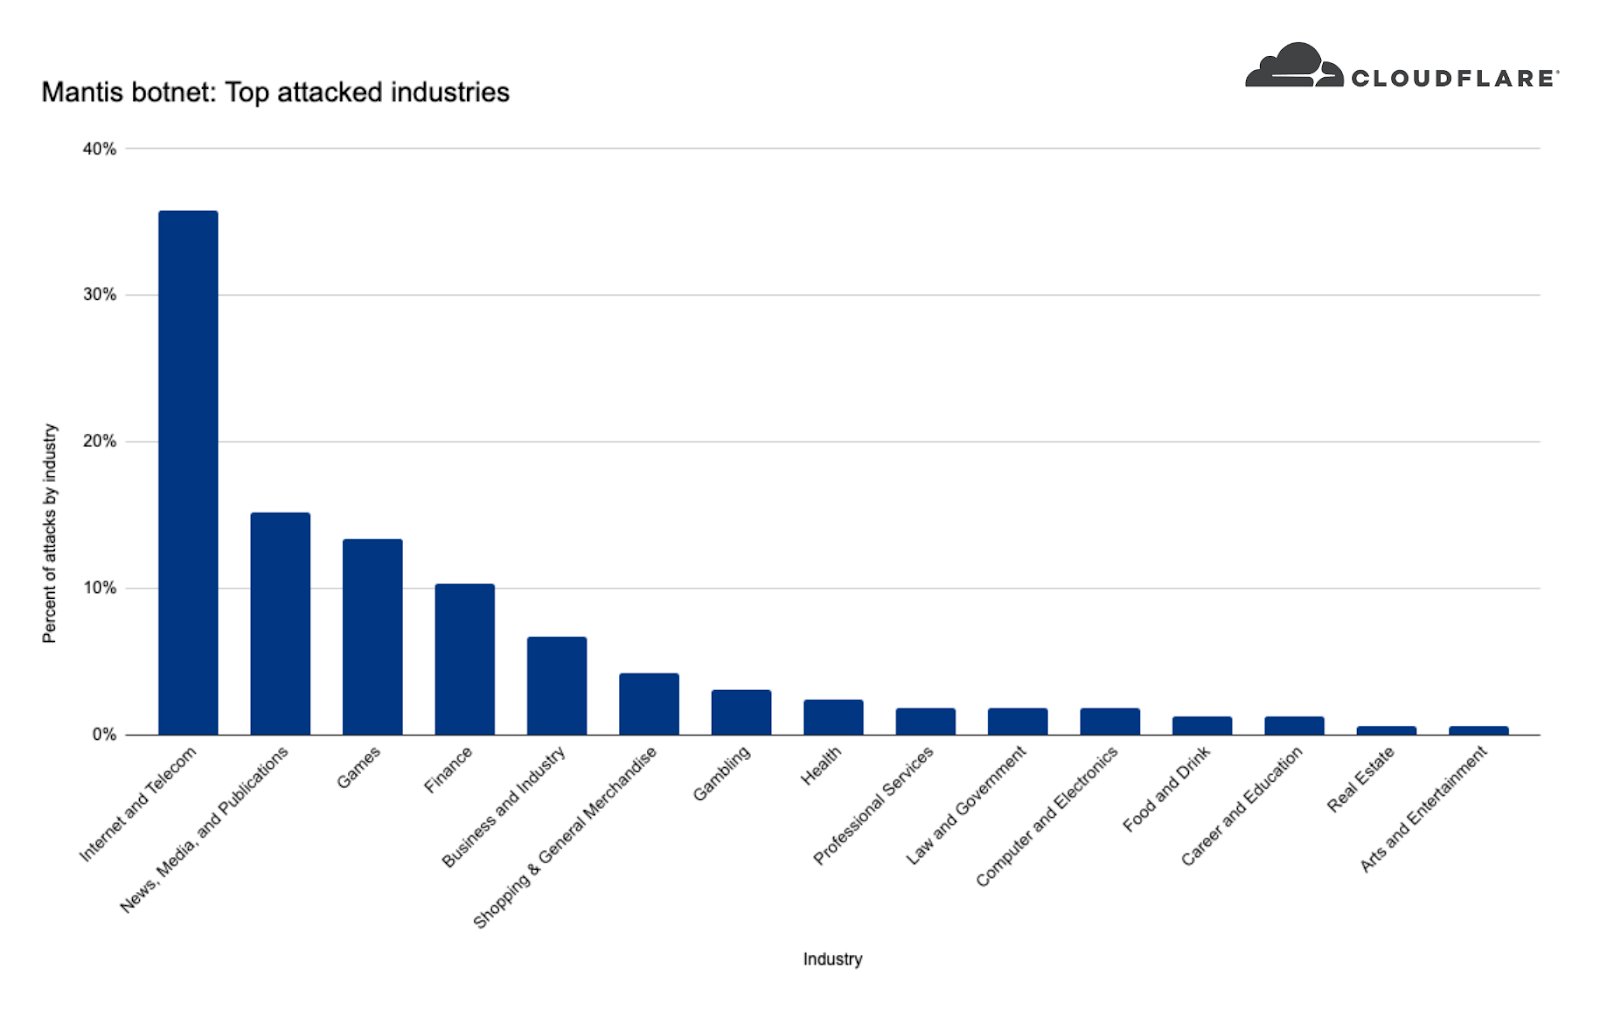
When we take a look at Mantis’ targets we can see that the top attacked industry was the Internet & Telecommunications industry with 36% of attack share. In second place, the News, Media & Publishing industry, followed by Gaming and Finance.
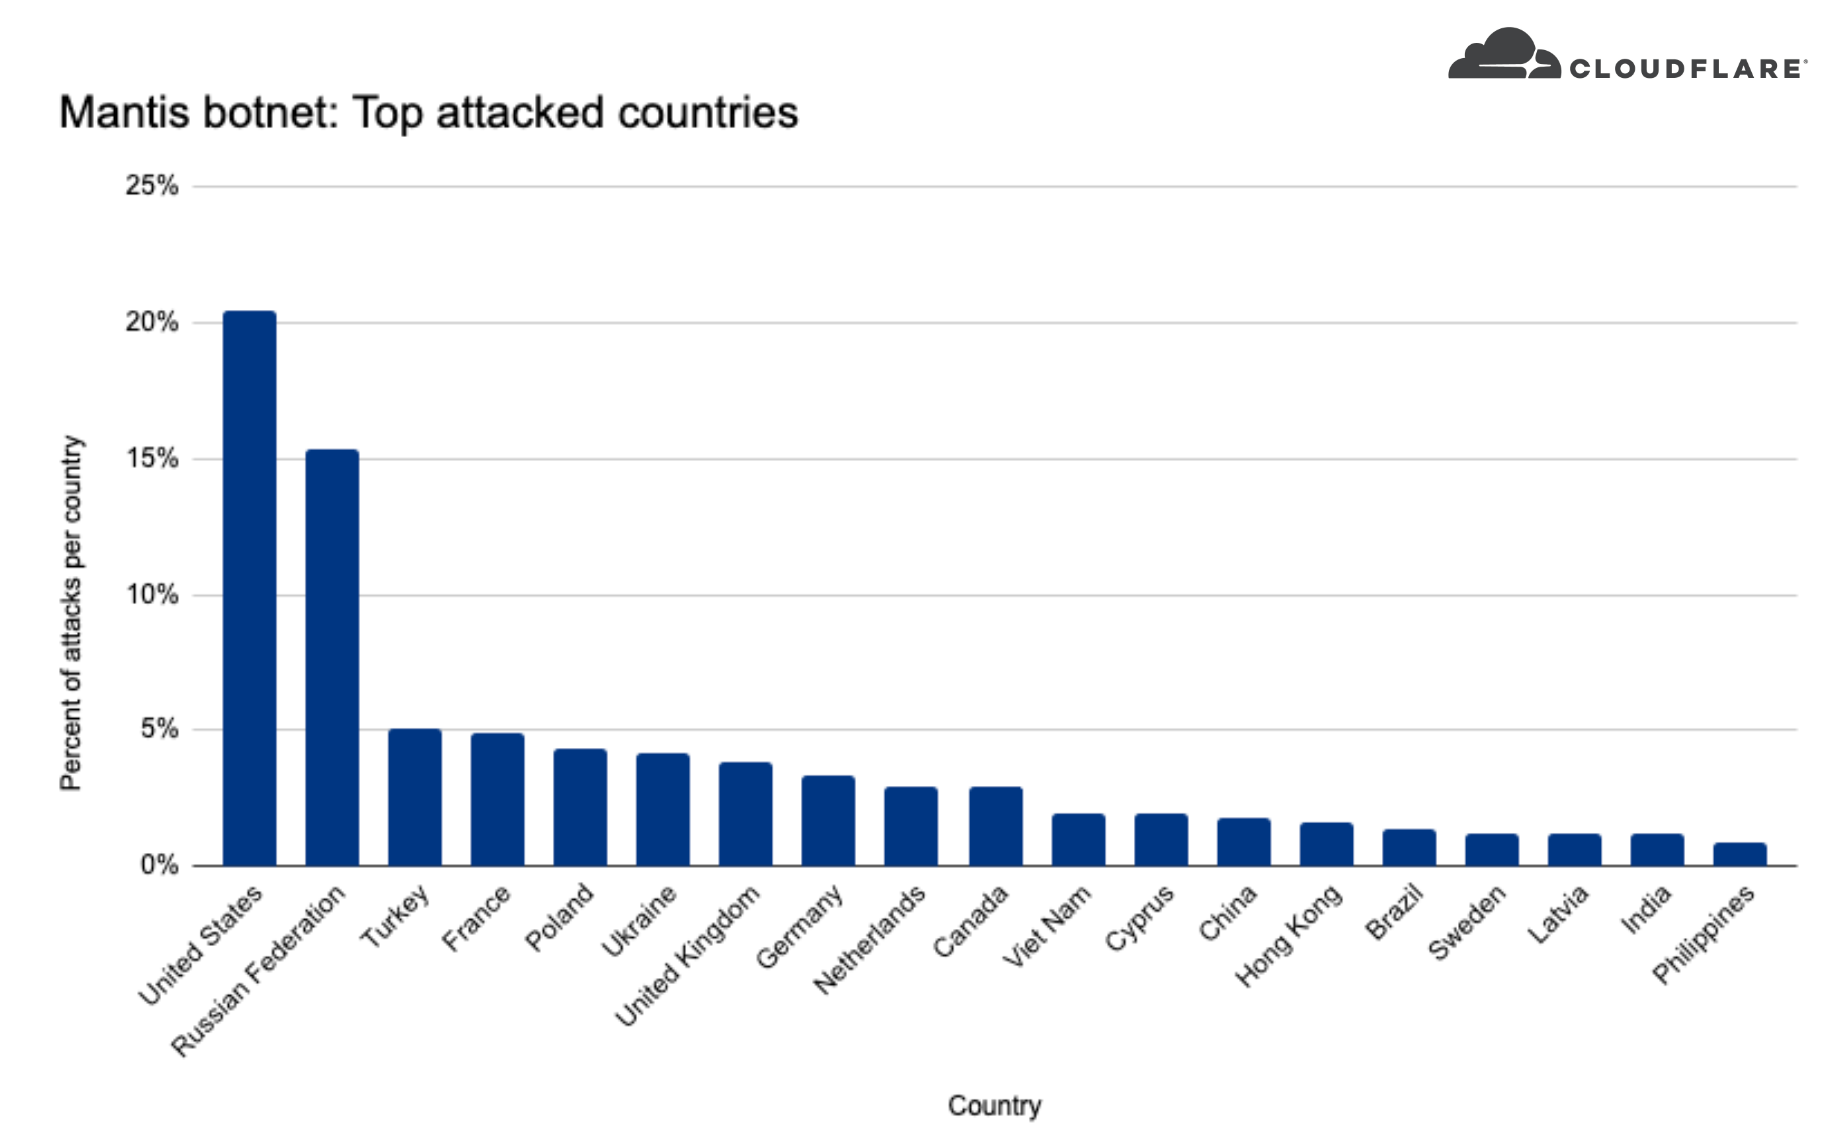
When we look at where these companies are located, we can see that over 20% of the DDoS attacks targeted US-based companies, over 15% Russia-based companies, and less than five percent included Turkey, France, Poland, Ukraine, and more.
How to protect against Mantis and other DDoS attacks
Cloudflare’s automated DDoS protection system leverages dynamic fingerprinting to detect and mitigate DDoS attacks. The system is exposed to customers as the HTTP DDoS Managed Ruleset. The ruleset is enabled and applying mitigation actions by default, so if you haven’t made any changes, there is no action for you to take — you are protected. You can also review our guides Best Practices: DoS preventive measures and Responding to DDoS attacks for additional tips and recommendations on how to optimize your Cloudflare configurations.
Visit 1.1.1.1 from any device to get started with our free app that makes your Internet faster and safer.
To learn more about our mission to help build a better Internet, start here. If you’re looking for a new career direction, check out our open positions.
New survey reveals lack of staff, skills, and resources driving smaller teams to outsource security.
As business begins its return to normalcy (however “normal” may look), CISOs at small and medium-size enterprises (500 – 10,000 employees) were asked to share their cybersecurity challenges and priorities, and their responses were compared the results with those of a similar survey from 2021.
Here are the 5 key things we learned from 200 responses:
1 — Remote Work Has Accelerated the Use of EDR Technologies
In 2021, 52% of CISOs surveyed were relying on endpoint detection and response (EDR) tools. This year that number has leapt to 85%. In contrast, last year 45% were using network detection and response (NDR) tools, while this year just 6% employ NDR. Compared to 2021, double the number of CISOs and their organizations are seeing the value of extended detection and response (XDR) tools, which combine EDR with integrated network signals. This is likely due to the increase in remote work, which is more difficult to secure than when employees work within the company’s network environment.
2 — 90% of CISOs Use an MDR Solution
There is a massive skills gap in the cybersecurity industry, and CISOs are under increasing pressure to recruit internally. Especially in small security teams where additional headcount is not the answer, CISOs are turning to outsourced services to fill the void. In 2021, 47% of CISOs surveyed relied on a Managed Security Services Provider (MSSP), while 53% were using a managed detection and response (MDR) service. This year, just 21% are using an MSSP, and 90% are using MDR.
3 — Overlapping Threat Protection Tools are the #1 Pain Point for Small Teams
The majority (87%) of companies with small security teams struggle to manage and operate their threat protection products. Among these companies, 44% struggle with overlapping capabilities, while 42% struggle to visualize the full picture of an attack when it occurs. These challenges are intrinsically connected, as teams find it difficult to get a single, comprehensive view with multiple tools.
4 — Small Security Teams Are Ignoring More Alerts
Small security teams are giving less attention to their security alerts. Last year 14% of CISOs said they look only at critical alerts, while this year that number jumped to 21%. In addition, organizations are increasingly letting automation take the wheel. Last year, 16% said they ignore automatically remediated alerts, and this year that’s true for 34% of small security teams.
5 — 96% of CISOs Are Planning to Consolidate Security Platforms
Almost all CISOs surveyed have consolidation of security tools on their to-do lists, compared to 61% in 2021. Not only does consolidation reduce the number of alerts – making it easier to prioritize and view all threats – respondents believe it will stop them from missing threats (57%), reduce the need for specific expertise (56%), and make it easier to correlate findings and visualize the risk landscape (46%). XDR technologies have emerged as the preferred method of consolidation, with 63% of CISOs calling it their top choice.
The OpenSSL Technical Committee (OTC) was recently made aware of several potential attacks against the OpenSSL libraries which might permit information leakage via the Spectre attack.1 Although there are currently no known exploits for the Spectre attacks identified, it is plausible that some of them might be exploitable.
Local side channel attacks, such as these, are outside the scope of our security policy, however the project generally does introduce mitigations when they are discovered. In this case, the OTC has decided that these attacks will not be mitigated by changes to the OpenSSL code base. The full reasoning behind this is given below.
The Spectre attack vector, while applicable everywhere, is most important for code running in enclaves because it bypasses the protections offered. Example enclaves include, but are not limited to:
The reasoning behind the OTC’s decision to not introduce mitigations for these attacks is multifold:
Such issues do not fall under the scope of our defined security policy. Even though we often apply mitigations for such issues we do not mandate that they are addressed.
Maintaining code with mitigations in place would be significantly more difficult. Most potentially vulnerable code is extremely non-obvious, even to experienced security programmers. It would thus be quite easy to introduce new attack vectors or fix existing ones unknowingly. The mitigations themselves obscure the code which increases the maintenance burden.
Automated verification and testing of the attacks is necessary but not sufficient. We do not have automated detection for this family of vulnerabilities and if we did, it is likely that variations would escape detection. This does not mean we won’t add automated checking for issues like this at some stage.
These problems are fundamentally a bug in the hardware. The software running on the hardware cannot be expected to mitigate all such attacks. Some of the in-CPU caches are completely opaque to software and cannot be easily flushed, making software mitigation quixotic. However, the OTC recognises that fixing hardware is difficult and in some cases impossible.
Some kernels and compilers can provide partial mitigation. Specifically, several common compilers have introduced code generation options addressing some of these classes of vulnerability:
GCC has the -mindirect-branch, -mfunction-return and -mindirect-branch-register options
LLVM has the -mretpoline option
MSVC has the /Qspectre option
Nicholas Mosier, Hanna Lachnitt, Hamed Nemati, and Caroline Trippel, “Axiomatic Hardware-Software Contracts for Security,” in Proceedings of the 49th ACM/IEEE International Symposium on Computer Architecture (ISCA), 2022.↩
Posted by OpenSSL Technical Committee May 13th, 2022 12:00 am
But reliable recognition isn’t just about the big things — done well, even the smallest details of your WordPress website can help it stand out from the crowd and attract customer notice. This is the role of the favorite icon or “favicon” that’s used in web browser tabs, bookmarks, and on mobile devices as the app image for your site.
Not sure how favicons work or how to get them up and running on your site? We’ve got you covered with our functional guide to favicons — what they are, why they matter, and how to enable them in WordPress.
The official WordPress support page defines a favicon as “an icon associated with a particular website or web page.” This description doesn’t do the term justice — in fact, favicons are everywhere and are intrinsically associated with your brand.
Let’s take a closer look at how favicons look and why they matter below.
WordPress Favicon Size
The typical size of a WordPress favicon is 512 x 512 pixels. These icons are stored as .ico files in the root directory of your WordPress server.
But what does a favicon look like in real life? For a quick example, take a look at the browser tab of this webpage if you’re on a desktop or the area just under the address bar on your mobile device. Notice anything? That orange symbol with lines and circles is HubSpot’s favicon — and it shows up anytime you’re on our site.
In most cases, favicons are the same as brand logos scaled down to fit web and mobile browsers. Where this isn’t possible — such as cases where your logo is too complex or detailed — site owners typically opt for similar color schemes and thematic elements to ensure brand consistency.
Once you start seeing favicons you can’t unsee them; from webpages to tabs to bookmarks and mobile applications, the icon you choose for your favicon is inextricably linked to your site and your brand — so make sure you choose wisely.
Why Favicons Matter
Favicons are the visual currency of your brand. They’re everywhere — from browsers to bookmarks to mobile apps — and become an integral part of your site’s overall branding strategy.
As result, effective favicon design and deployment offers three broad benefits:
Improved Brand Recognition
Think of your favicon like your calling card — the icon needs to be simple, recognizable and consistent. The more places your favicon appears, the better, since this makes it easy for users to connect your WordPress site with your icon image.
Consistency is also key as users open multiple browser tabs and the available space for text descriptions naturally shrinks. Open enough tabs and all that’s left is — you guessed it — room for the favicon.
Increased Consumer Confidence
While visitors may not be able to define what a favicon is or how it works, these icons are inherently familiar. So familiar, in fact, that sites without favicons often stand out from the crowd for all the wrong reasons.
Much like relevant social media content and secure site connections, favicons are critical to boosting consumer confidence in the products or services you offer on your site.
Integrated Mobile Consistency
The impact of mobile devices can’t be ignored, with smartphones and tablets now outpacing desktops as the primary means of consumer online interaction. Favicons make it possible to ensure your brand easily translates to mobile — when users create website bookmarks on mobile home screens, your favicon stands in for the link.
Favicon Creation Guidelines
Not sure how to get started creating your site’s favicon? Let’s break down some best-practice guidelines.
1. Get the size right.
As noted above, favicons are typically 512 x 512 pixels in size. While it’s possible to use a larger WordPress favicon size, the platform will often ask you to crop the image down.
2. Keep it simple.
While it’s possible to add background colors and other customization to your favicon, keeping it simple is often the best choice. Here, simplicity includes opting for transparency over background colors and keeping the number of foreground colors in your favicon to one or two at most.
Ideally, your favicon will look almost identical to your brand’s logo — if that’s not possible, try to pull elements from your logo such as shapes or color schemes that help tie in your new favicon.
3. Choose wisely.
Site owners can update their favicon at any time, but it’s a good idea to keep the number of changes to a minimum. Here’s why: If users see a different favicon every time they log on to your website, they won’t have an opportunity to associate a specific image with your brand.
Bottom line? Better to go without a favicon until you find one that works for your site and that you don’t plan on changing.
How to Enable WordPress Favicons
To get your favicon up and running on your WordPress site, you’ve got three options:
Use the Site Icon feature
Install a favicon plugin
Upload the new favicon yourself
Let’s break down each method in more detail.
1. Use the site icon feature.
As of WordPress version 4.3, the content management system (CMS) includes a Site Icon function that enables favicons. Simply prepare your image file — which can be a .jpeg, .ico, .gif or .png file — and head to the Administration page of your WordPress Site.
Next, click on “Appearance” and then “Customize”, then click “Site Identity.” Now, click “Select Image” under the Site Icon subheading and upload the file you’ve prepared. You should see a screen like this:
If you like the favicon you’ve created, no further action is required. If not, you can easily remove the file or upload a new image.
2. Install a favicon plugin.
You can also use a plugin — such as Favicon by RealFaviconGenerator — to create and deploy your favicon. This must-have WordPress plugin not only lets you customize your favicon but also ensures that multiple versions are created to satisfy the requirements of different operating systems and device versions.
As long as the image you upload to the plugin is at least 70 x 70 pixels, the RealFaviconGenerator will take care of the rest.
3. Upload the new favicon yourself.
If you’d rather do the legwork yourself, you can create and upload your own favicon to your WordPress site.
First, create an image that’s at least 16 x 16 pixels and is saved as a .ico file. Then, use an FTP client to upload this file to the main folder of your current WordPress theme — typically the same place as your wp-admin and wp-content folders.
While this should display your favicon in most web browsers, some older browser versions will require you to edit WordPress header HTML code. The result? DIY favicons aren’t recommended unless you’re familiar with more technical WordPress functions.
Final Favicon Thoughts
Whie favicons form only a small part of your WordPress website build, they’re critical for website recognition. Consistent and clear favicons make it easy for visitors to remember your site and carry this mental connection across desktop, tablet, and mobile devices.
Today, a cluster of Internet standards were published that rationalize and modernize the definition of HTTP – the application protocol that underpins the web. This work includes updates to, and refactoring of, HTTP semantics, HTTP caching, HTTP/1.1, HTTP/2, and the brand-new HTTP/3. Developing these specifications has been no mean feat and today marks the culmination of efforts far and wide, in the Internet Engineering Task Force (IETF) and beyond. We thought it would be interesting to celebrate the occasion by sharing some analysis of Cloudflare’s view of HTTP traffic over the last 12 months.
However, before we get into the traffic data, for quick reference, here are the new RFCs that you should make a note of and start using:
HTTP’s overall architecture, common terminology and shared protocol aspects such as request and response messages, methods, status codes, header and trailer fields, message content, representation data, content codings and much more. Obsoletes RFCs 2818, 7231, 7232, 7233, 7235, 7538, 7615, 7694, and portions of 7230.
A syntax of HTTP that uses a binary framing format, which provides streams to support concurrent requests and responses. Message fields can be compressed using HPACK. Typically used over TCP and TLS. Obsoletes RFCs 7540 and 8740.
A variation of HPACK field compression that is optimized for the QUIC transport protocol.
On May 28, 2021, we enabled QUIC version 1 and HTTP/3 for all Cloudflare customers, using the final “h3” identifier that matches RFC 9114. So although today’s publication is an occasion to celebrate, for us nothing much has changed, and it’s business as usual.
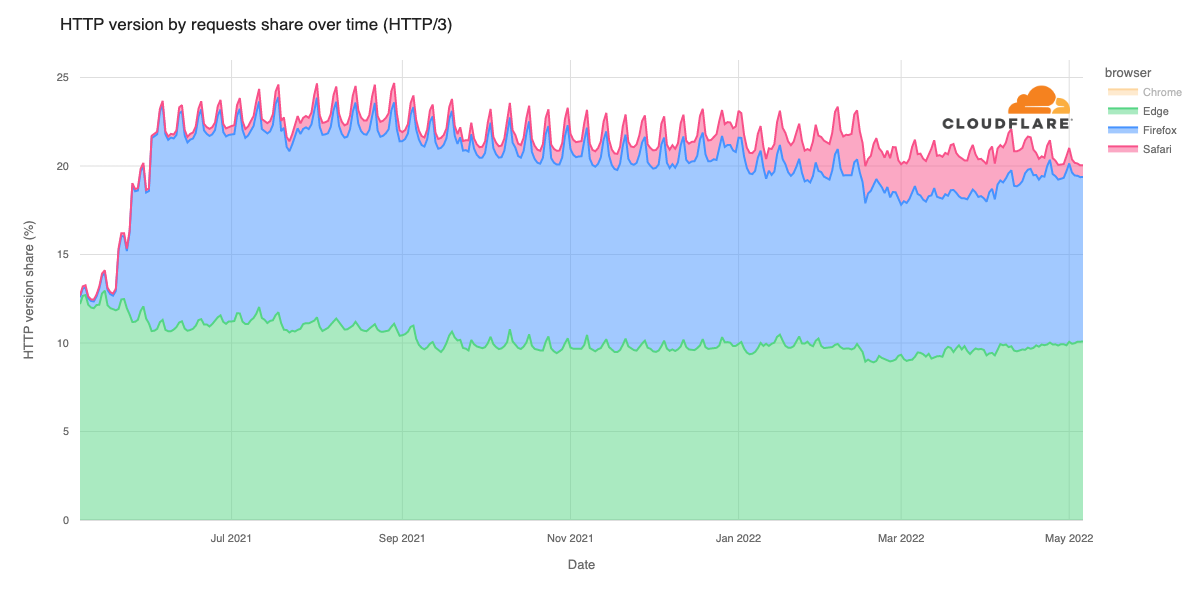
A browser and web server typically automatically negotiate the highest HTTP version available. Thus, HTTP/3 takes precedence over HTTP/2. We looked back over the last year to understand HTTP/3 usage trends across the Cloudflare network, as well as analyzing HTTP versions used by traffic from leading browser families (Google Chrome, Mozilla Firefox, Microsoft Edge, and Apple Safari), major search engine indexing bots, and bots associated with some popular social media platforms. The graphs below are based on aggregate HTTP(S) traffic seen globally by the Cloudflare network, and include requests for website and application content across the Cloudflare customer base between May 7, 2021, and May 7, 2022. We used Cloudflare bot scores to restrict analysis to “likely human” traffic for the browsers, and to “likely automated” and “automated” for the search and social bots.
Traffic by HTTP version
Overall, HTTP/2 still comprises the majority of the request traffic for Cloudflare customer content, as clearly seen in the graph below. After remaining fairly consistent through 2021, HTTP/2 request volume increased by approximately 20% heading into 2022. HTTP/1.1 request traffic remained fairly flat over the year, aside from a slight drop in early December. And while HTTP/3 traffic initially trailed HTTP/1.1, it surpassed it in early July, growing steadily and roughly doubling in twelve months.
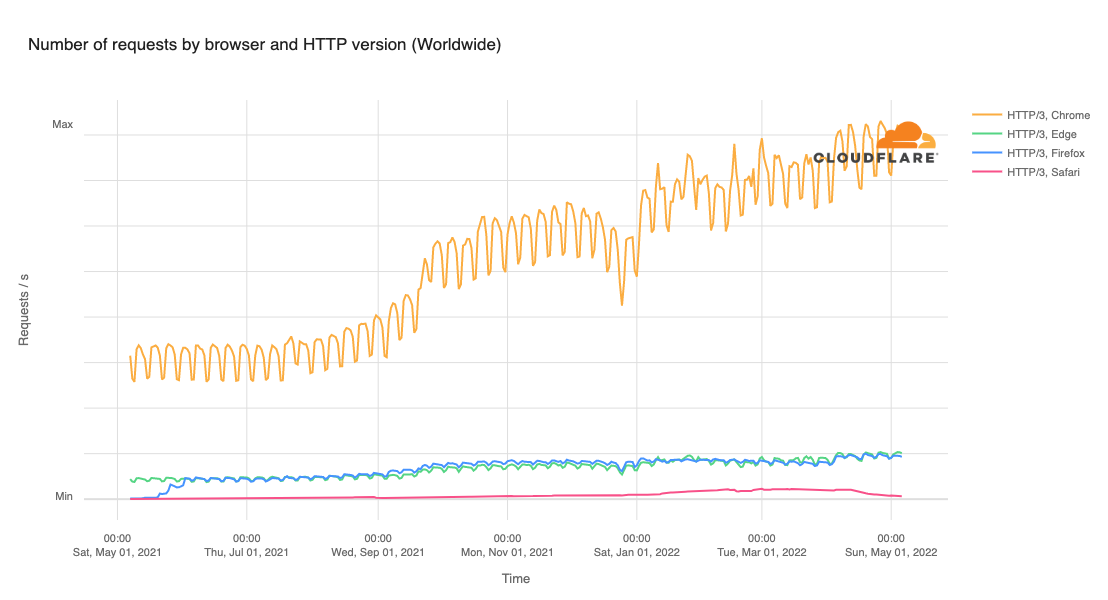
HTTP/3 traffic by browser
Digging into just HTTP/3 traffic, the graph below shows the trend in daily aggregate request volume over the last year for HTTP/3 requests made by the surveyed browser families. Google Chrome (orange line) is far and away the leading browser, with request volume far outpacing the others.
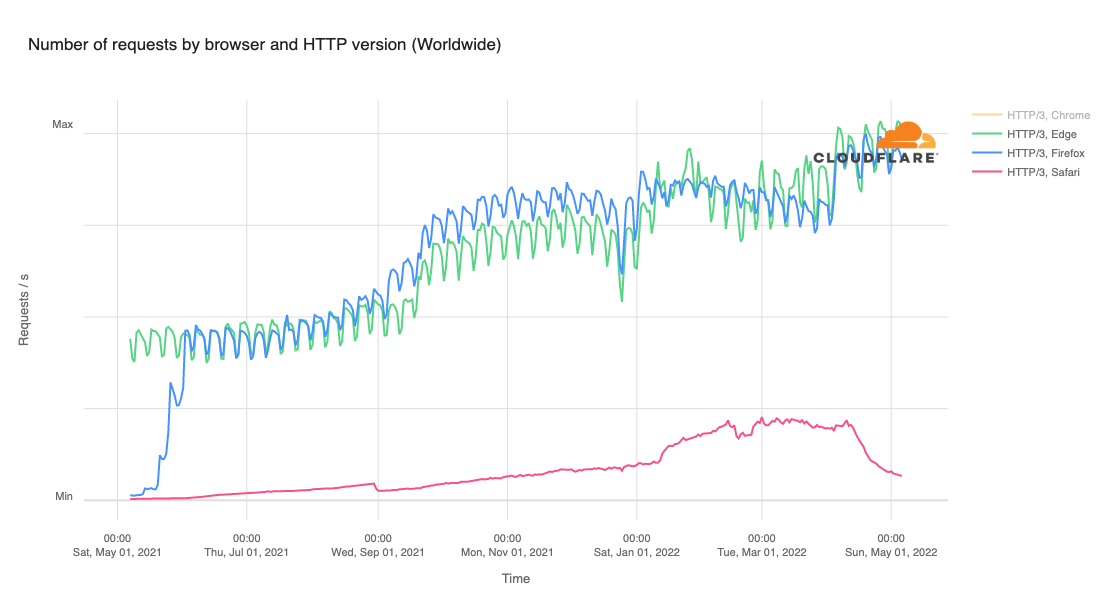
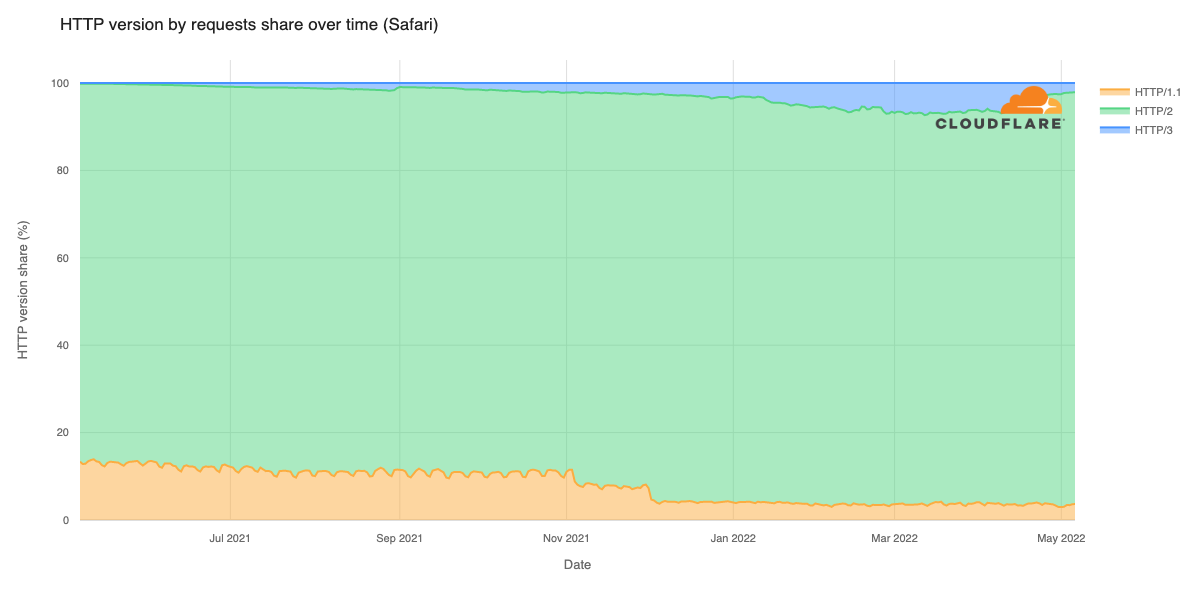
Below, we remove Chrome from the graph to allow us to more clearly see the trending across other browsers. Likely because it is also based on the Chromium engine, the trend for Microsoft Edge closely mirrors Chrome. As noted above, Mozilla Firefox first enabled production support in version 88 in April 2021, making it available by default by the end of May. The increased adoption of that updated version during the following month is clear in the graph as well, as HTTP/3 request volume from Firefox grew rapidly. HTTP/3 traffic from Apple Safari increased gradually through April, suggesting growth in the number of users enabling the experimental feature or running a Technology Preview version of the browser. However, Safari’s HTTP/3 traffic has subsequently dropped over the last couple of months. We are not aware of any specific reasons for this decline, but our most recent observations indicate HTTP/3 traffic is recovering.
Looking at the lines in the graph for Chrome, Edge, and Firefox, a weekly cycle is clearly visible in the graph, suggesting greater usage of these browsers during the work week. This same pattern is absent from Safari usage.
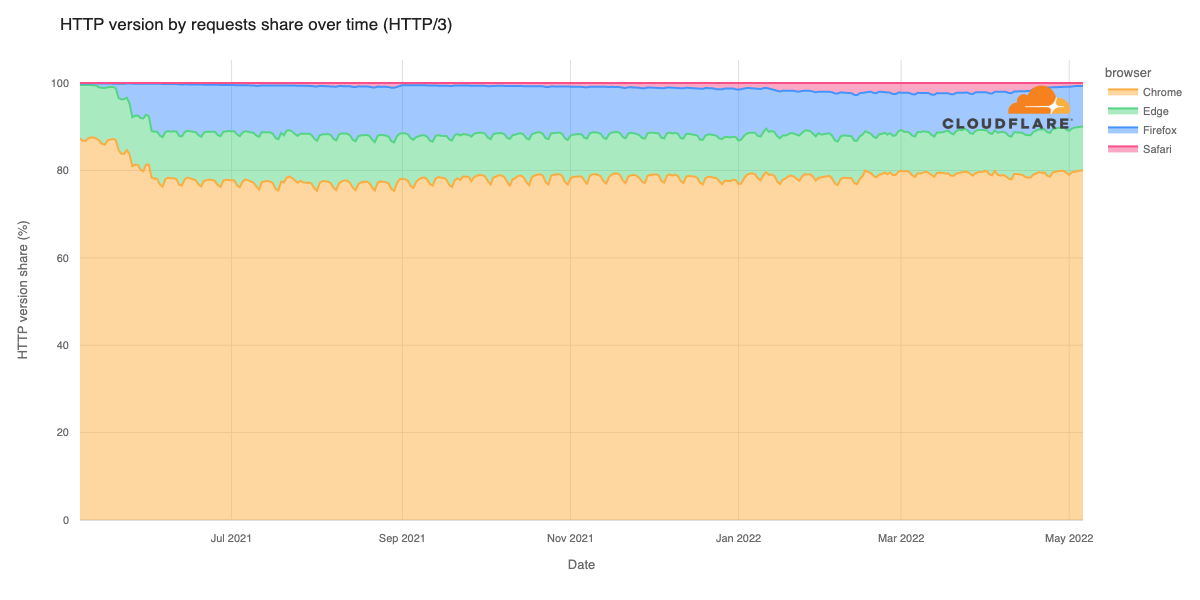
Across the surveyed browsers, Chrome ultimately accounts for approximately 80% of the HTTP/3 requests seen by Cloudflare, as illustrated in the graphs below. Edge is responsible for around another 10%, with Firefox just under 10%, and Safari responsible for the balance.
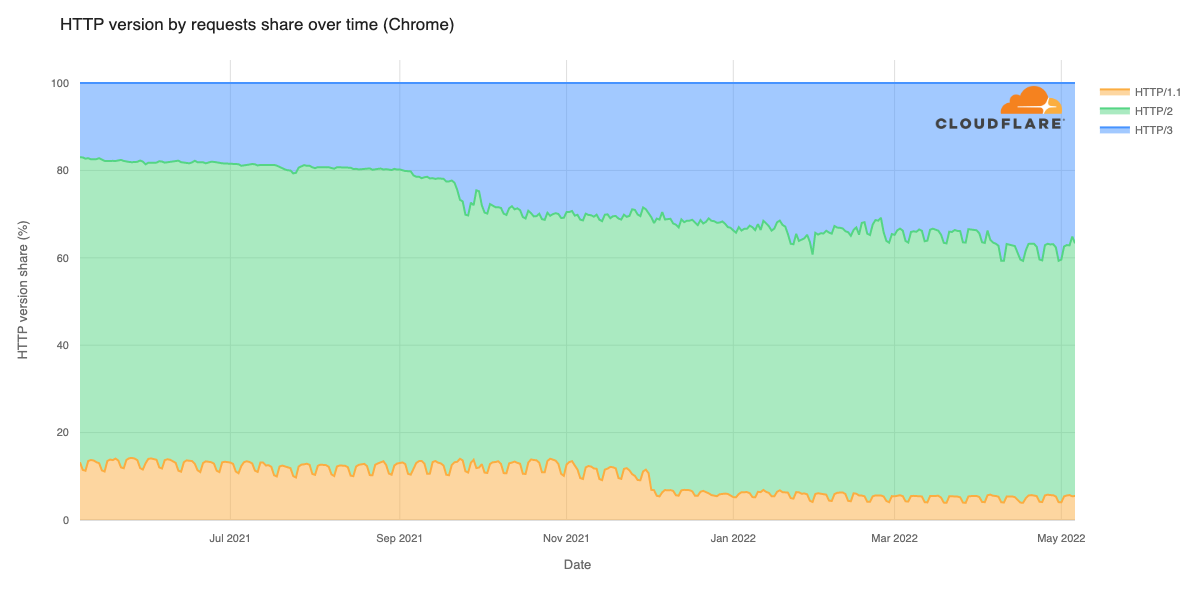
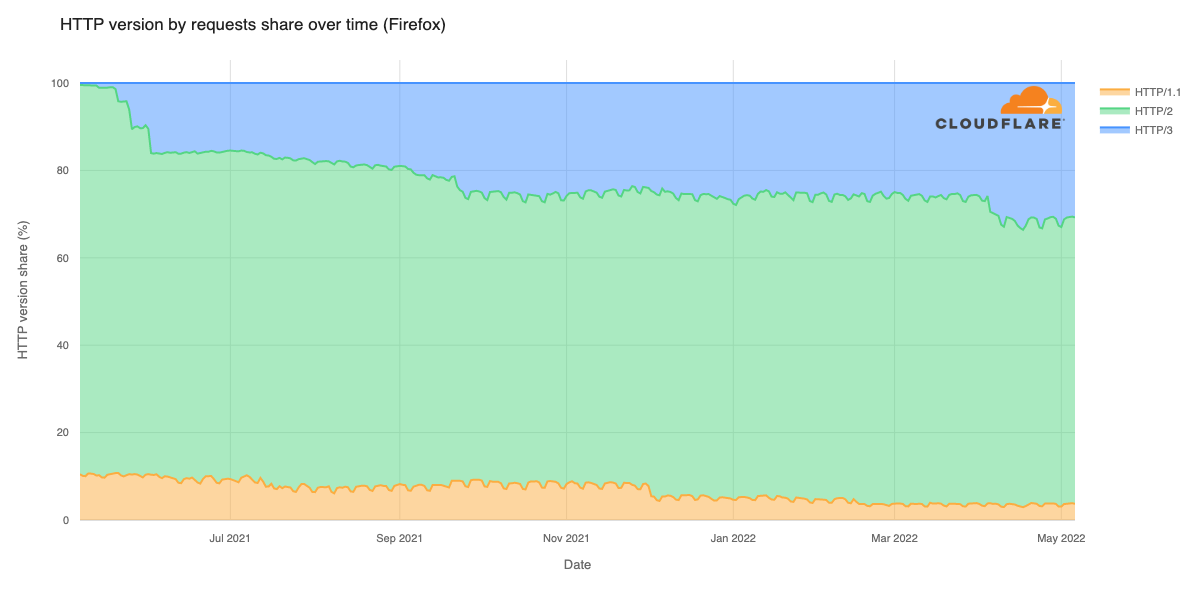
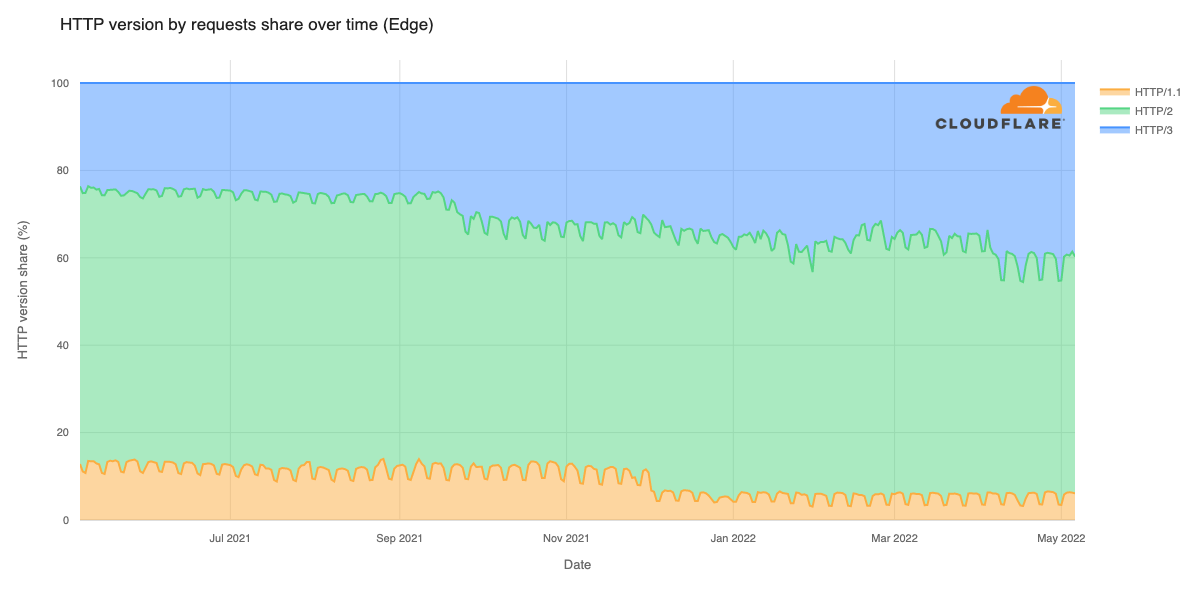
We also wanted to look at how the mix of HTTP versions has changed over the last year across each of the leading browsers. Although the percentages vary between browsers, it is interesting to note that the trends are very similar across Chrome, Firefox and Edge. (After Firefox turned on default HTTP/3 support in May 2021, of course.) These trends are largely customer-driven – that is, they are likely due to changes in Cloudflare customer configurations.
Most notably we see an increase in HTTP/3 during the last week of September, and a decrease in HTTP/1.1 at the beginning of December. For Safari, the HTTP/1.1 drop in December is also visible, but the HTTP/3 increase in September is not. We expect that over time, once Safari supports HTTP/3 by default that its trends will become more similar to those seen for the other browsers.
Traffic by search indexing bot
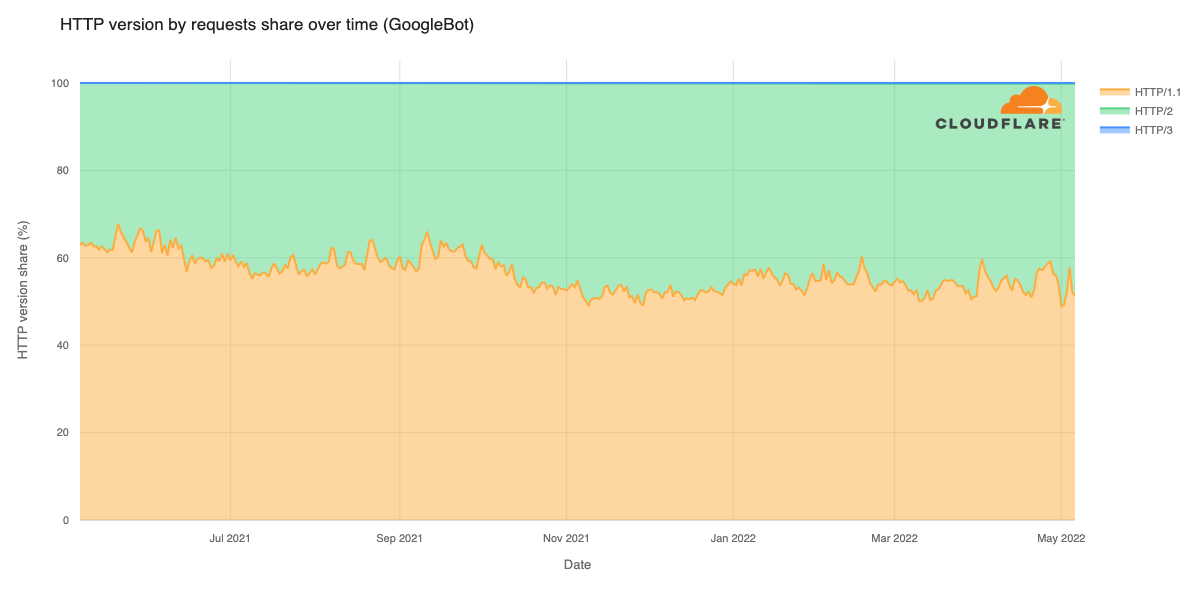
Back in 2014, Google announced that it would start to consider HTTPS usage as a ranking signal as it indexed websites. However, it does not appear that Google, or any of the other major search engines, currently consider support for the latest versions of HTTP as a ranking signal. (At least not directly – the performance improvements associated with newer versions of HTTP could theoretically influence rankings.) Given that, we wanted to understand which versions of HTTP the indexing bots themselves were using.
Despite leading the charge around the development of QUIC, and integrating HTTP/3 support into the Chrome browser early on, it appears that on the indexing/crawling side, Google still has quite a long way to go. The graph below shows that requests from GoogleBot are still predominantly being made over HTTP/1.1, although use of HTTP/2 has grown over the last six months, gradually approaching HTTP/1.1 request volume. (A blog post from Google provides some potential insights into this shift.) Unfortunately, the volume of requests from GoogleBot over HTTP/3 has remained extremely limited over the last year.
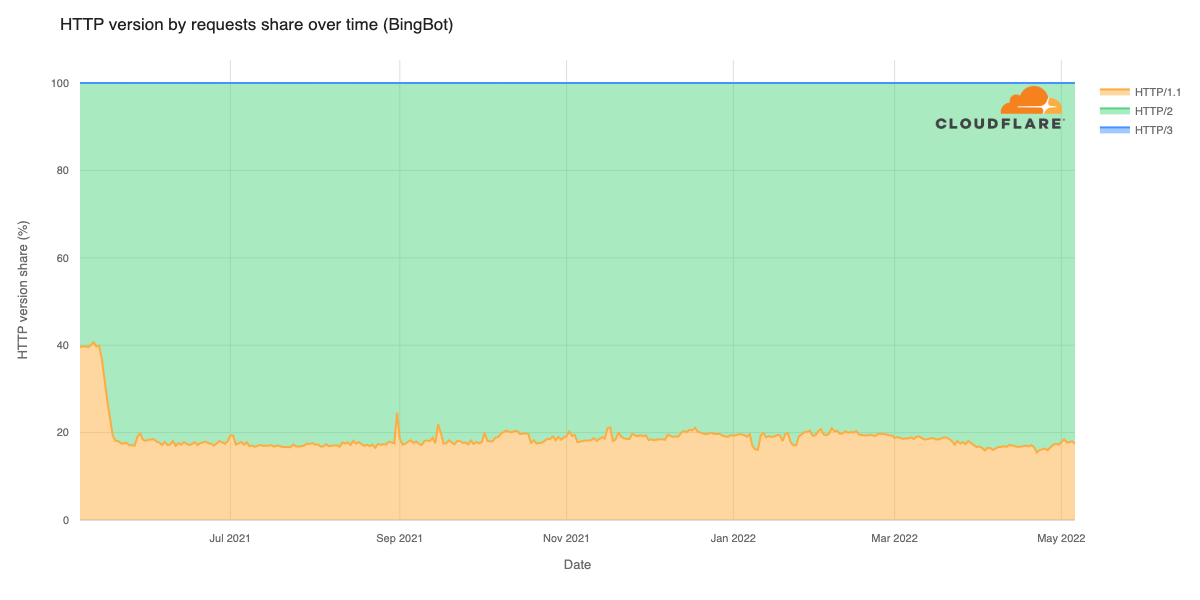
Microsoft’s BingBot also fails to use HTTP/3 when indexing sites, with near-zero request volume. However, in contrast to GoogleBot, BingBot prefers to use HTTP/2, with a wide margin developing in mid-May 2021 and remaining consistent across the rest of the past year.
Traffic by social media bot
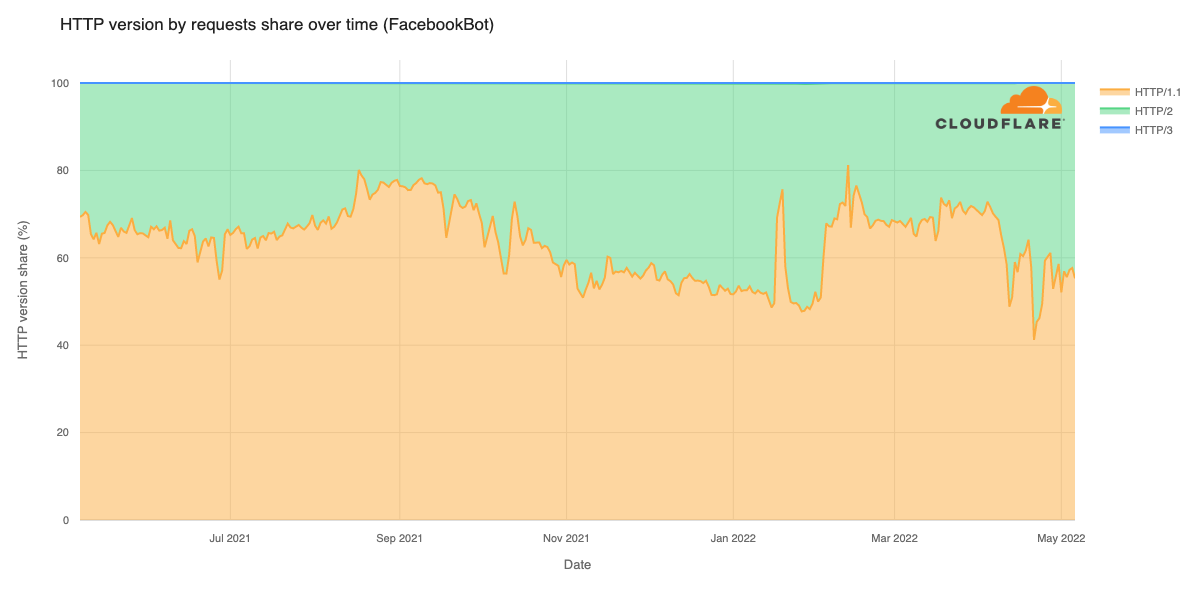
Major social media platforms use custom bots to retrieve metadata for shared content, improve language models for speech recognition technology, or otherwise index website content. We also surveyed the HTTP version preferences of the bots deployed by three of the leading social media platforms.
Although Facebook supports HTTP/3 on their main website (and presumably their mobile applications as well), their back-end FacebookBot crawler does not appear to support it. Over the last year, on the order of 60% of the requests from FacebookBot have been over HTTP/1.1, with the balance over HTTP/2. Heading into 2022, it appeared that HTTP/1.1 preference was trending lower, with request volume over the 25-year-old protocol dropping from near 80% to just under 50% during the fourth quarter. However, that trend was abruptly reversed, with HTTP/1.1 growing back to over 70% in early February. The reason for the reversal is unclear.
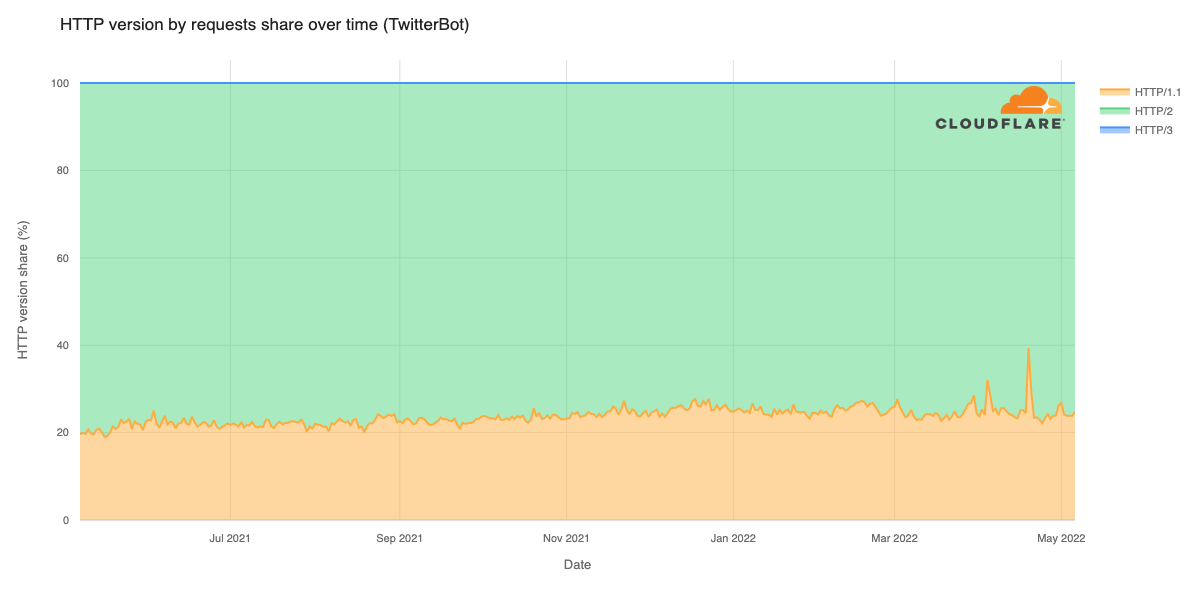
Similar to FacebookBot, it appears TwitterBot’s use of HTTP/3 is, unfortunately, pretty much non-existent. However, TwitterBot clearly has a strong and consistent preference for HTTP/2, accounting for 75-80% of its requests, with the balance over HTTP/1.1.
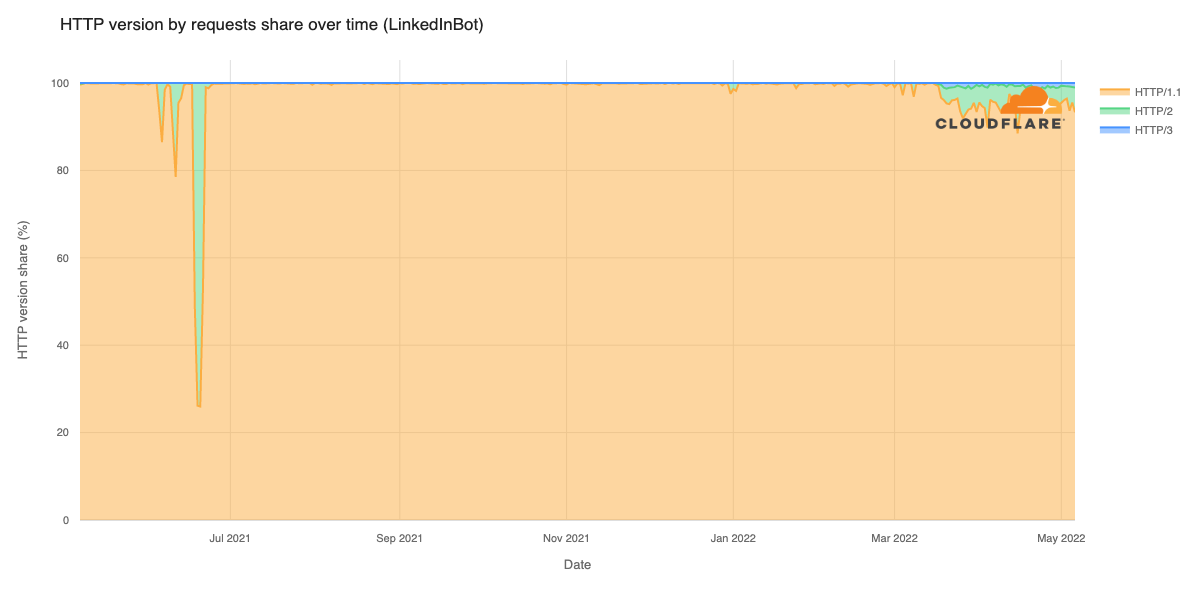
In contrast, LinkedInBot has, over the last year, been firmly committed to making requests over HTTP/1.1, aside from the apparently brief anomalous usage of HTTP/2 last June. However, in mid-March, it appeared to tentatively start exploring the use of other HTTP versions, with around 5% of requests now being made over HTTP/2, and around 1% over HTTP/3, as seen in the upper right corner of the graph below.
Conclusion
We’re happy that HTTP/3 has, at long last, been published as RFC 9114. More than that, we’re super pleased to see that regardless of the wait, browsers have steadily been enabling support for the protocol by default. This allows end users to seamlessly gain the advantages of HTTP/3 whenever it is available. On Cloudflare’s global network, we’ve seen continued growth in the share of traffic speaking HTTP/3, demonstrating continued interest from customers in enabling it for their sites and services. In contrast, we are disappointed to see bots from the major search and social platforms continuing to rely on aging versions of HTTP. We’d like to build a better understanding of how these platforms chose particular HTTP versions and welcome collaboration in exploring the advantages that HTTP/3, in particular, could provide.
Current statistics on HTTP/3 and QUIC adoption at a country and autonomous system (ASN) level can be found on Cloudflare Radar.
Running HTTP/3 and QUIC on the edge for everyone has allowed us to monitor a wide range of aspects related to interoperability and performance across the Internet. Stay tuned for future blog posts that explore some of the technical developments we’ve been making.
And this certainly isn’t the end of protocol innovation, as HTTP/3 and QUIC provide many exciting new opportunities. The IETF and wider community are already underway building new capabilities on top, such as MASQUE and WebTransport. Meanwhile, in the last year, the QUIC Working Group has adopted new work such as QUIC version 2, and the Multipath Extension to QUIC.
Last week, Cloudflare automatically detected and mitigated a 26 million request per second DDoS attack — the largest HTTPS DDoS attack on record.
The attack targeted a customer website using Cloudflare’s Free plan. Similar to the previous 15M rps attack, this attack also originated mostly from Cloud Service Providers as opposed to Residential Internet Service Providers, indicating the use of hijacked virtual machines and powerful servers to generate the attack — as opposed to much weaker Internet of Things (IoT) devices.
The 26M rps DDoS attack originated from a small but powerful botnet of 5,067 devices. On average, each node generated approximately 5,200 rps at peak. To contrast the size of this botnet, we’ve been tracking another much larger but less powerful botnet of over 730,000 devices. The latter, larger botnet wasn’t able to generate more than one million requests per second, i.e. roughly 1.3 requests per second on average per device. Putting it plainly, this botnet was, on average, 4,000 times stronger due to its use of virtual machines and servers.
Also, worth noting that this attack was over HTTPS. HTTPS DDoS attacks are more expensive in terms of required computational resources because of the higher cost of establishing a secure TLS encrypted connection. Therefore, it costs the attacker more to launch the attack, and for the victim to mitigate it. We’ve seen very large attacks in the past over (unencrypted) HTTP, but this attack stands out because of the resources it required at its scale.
Within less than 30 seconds, this botnet generated more than 212 million HTTPS requests from over 1,500 networks in 121 countries. The top countries were Indonesia, the United States, Brazil and Russia. About 3% of the attack came through Tor nodes.
The top source networks were the French-based OVH (Autonomous System Number 16276), the Indonesian Telkomnet (ASN 7713), the US-based iboss (ASN 137922) and the Libyan Ajeel (ASN 37284).
The DDoS threat landscape
It’s important to understand the attack landscape when thinking about DDoS protection. When looking at our recent DDoS Trends report, we can see that most of the attacks are small, e.g. cyber vandalism. However, even small attacks can severely impact unprotected Internet properties. On the other hand, large attacks are growing in size and frequency — but remain short and rapid. Attackers concentrate their botnet’s power to try and wreak havoc with a single quick knockout blow — trying to avoid detection.
DDoS attacks might be initiated by humans, but they are generated by machines. By the time humans can respond to the attack, it may be over. And even if the attack was quick, the network and application failure events can extend long after the attack is over — costing you revenue and reputation. For this reason, it is recommended to protect your Internet properties with an automated always-on protection service that does not rely on humans to detect and mitigate attacks.
Helping build a better Internet
At Cloudflare, everything we do is guided by our mission to help build a better Internet. The DDoS team’s vision is derived from this mission: our goal is to make the impact of DDoS attacks a thing of the past. The level of protection that we offer is unmetered and unlimited — It is not bounded by the size of the attack, the number of the attacks, or the duration of the attacks. This is especially important these days because as we’ve recently seen, attacks are getting larger and more frequent.
Not using Cloudflare yet? Start now with our Free and Pro plans to protect your websites, or contact us for comprehensive DDoS protection for your entire network using Magic Transit.
Welcome to our first DDoS report of 2022, and the ninth in total so far. This report includes new data points and insights both in the application-layer and network-layer sections — as observed across the global Cloudflare network between January and March 2022.
The first quarter of 2022 saw a massive spike in application-layer DDoS attacks, but a decrease in the total number of network-layer DDoS attacks. Despite the decrease, we’ve seen volumetric DDoS attacks surge by up to 645% QoQ, and we mitigated a new zero-day reflection attack with an amplification factor of 220 billion percent.
In the Russian and Ukrainian cyberspace, the most targeted industries were Online Media and Broadcast Media. In our Azerbaijan and Palestinian Cloudflare data centers, we’ve seen enormous spikes in DDoS activity — indicating the presence of botnets operating from within.
The Highlights
The Russian and Ukrainian cyberspace
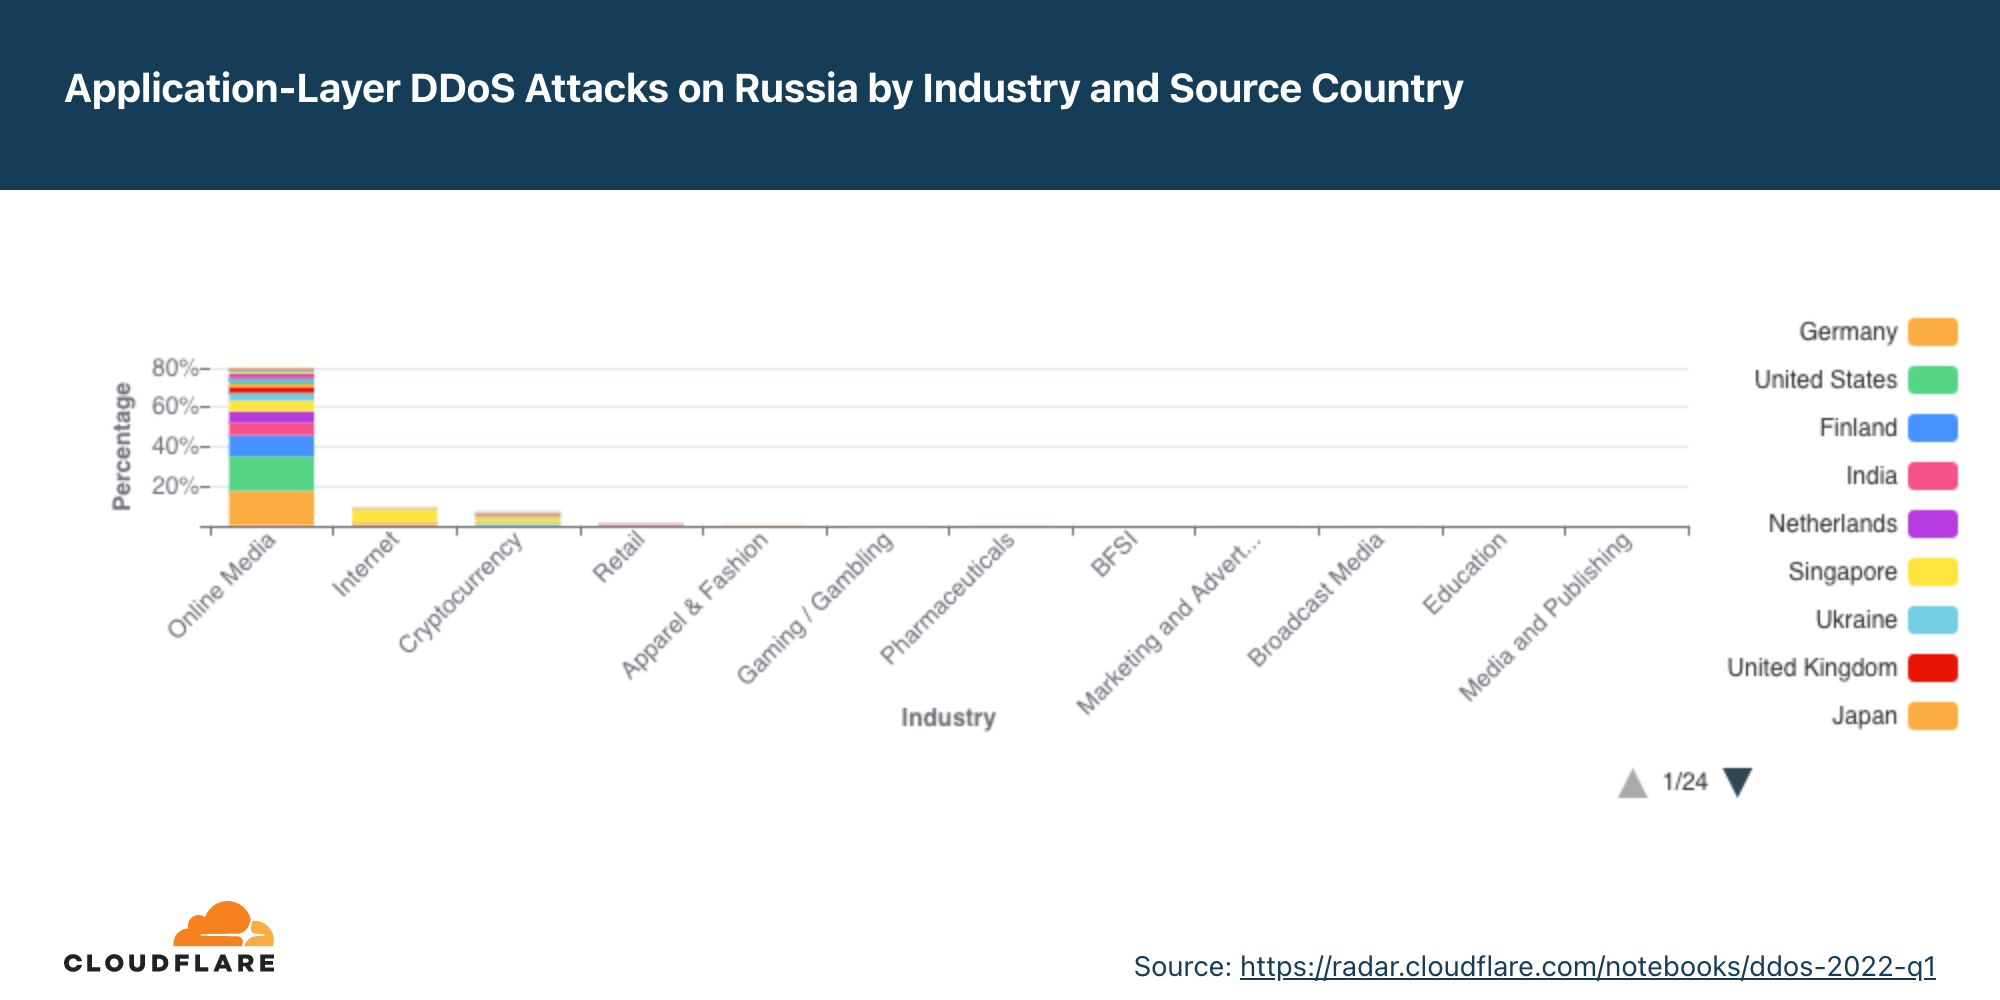
Russian Online Media companies were the most targeted industries within Russia in Q1. The next most targeted was the Internet industry, then Cryptocurrency, and then Retail. While many attacks that targeted Russian Cryptocurrency companies originated in Ukraine or the US, another major source of attacks was from within Russia itself.
The majority of HTTP DDoS attacks that targeted Russian companies originated from Germany, the US, Singapore, Finland, India, the Netherlands, and Ukraine. It’s important to note that being able to identify where cyber attack traffic originates is not the same as being able to attribute where the attacker is located.
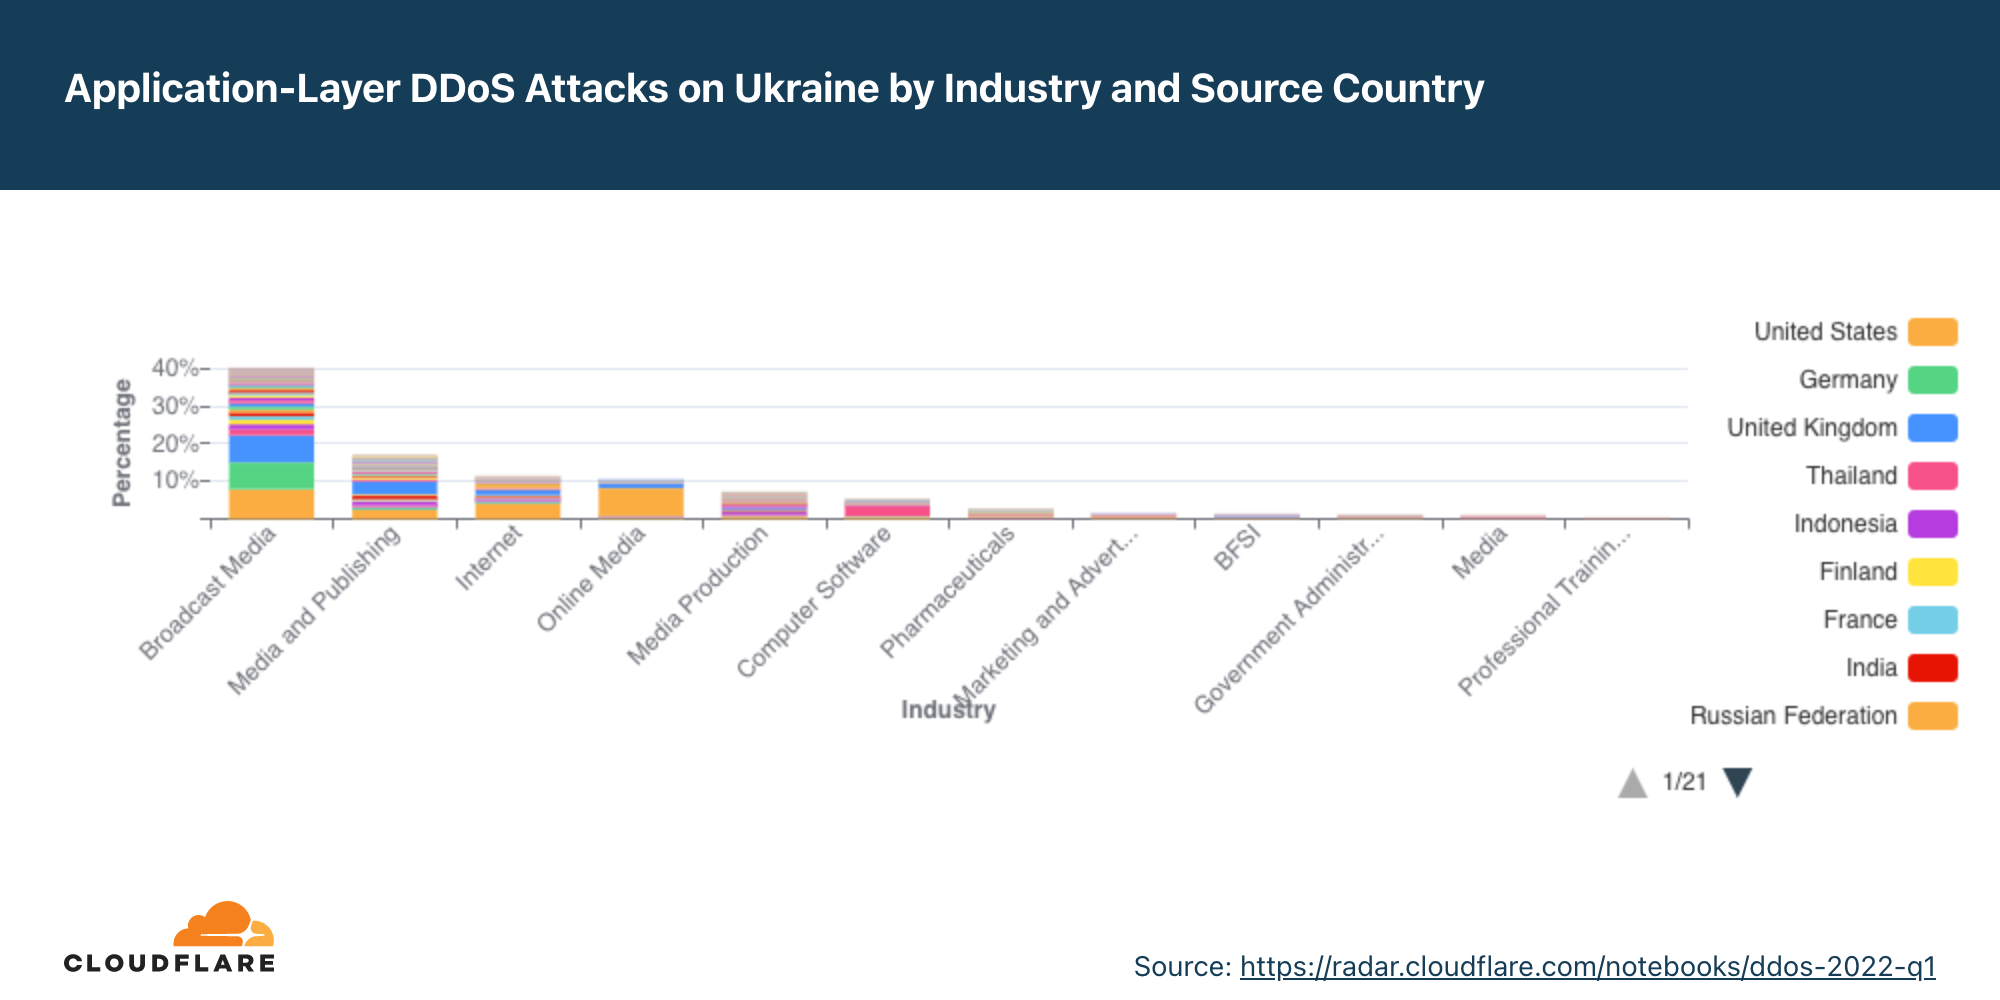
Attacks on Ukraine targeted Broadcast Media and Publishing websites and seem to have been more distributed, originating from more countries — which may indicate the use of global botnets. Still, most of the attack traffic originated from the US, Russia, Germany, China, the UK, and Thailand.
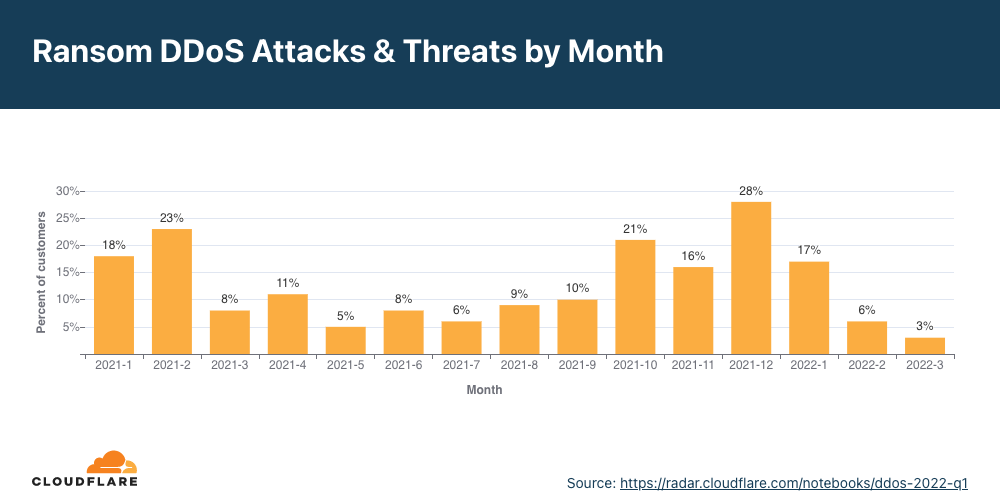
In January 2022, over 17% of under-attack respondents reported being targeted by ransom DDoS attacks or receiving a threat in advance.
That figure drastically dropped to 6% in February, and then to 3% in March.
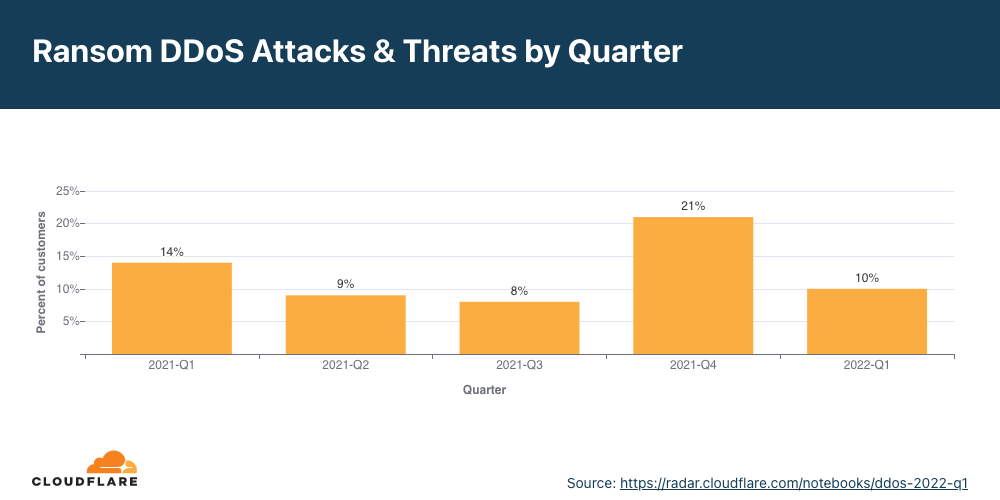
When compared to previous quarters, we can see that in total, in Q1, only 10% of respondents reported a ransom DDoS attack; a 28% decrease YoY and 52% decrease QoQ.
Application-layer DDoS attacks
2022 Q1 was the busiest quarter in the past 12 months for application-layer attacks. HTTP-layer DDoS attacks increased by 164% YoY and 135% QoQ.
Diving deeper into the quarter, in March 2022 there were more HTTP DDoS attacks than in all of Q4 combined (and Q3, and Q1).
After four consecutive quarters in a row with China as the top source of HTTP DDoS attacks, the US stepped into the lead this quarter. HTTP DDoS attacks originating from the US increased by a staggering 6,777% QoQ and 2,225% YoY.
Network-layer DDoS attacks
Network-layer attacks in Q1 increased by 71% YoY but decreased 58% QoQ.
The Telecommunications industry was the most targeted by network-layer DDoS attacks, followed by Gaming and Gambling companies, and the Information Technology and Services industry.
Volumetric attacks increased in Q1. Attacks above 10 Mpps (million packets per second) grew by over 300% QoQ, and attacks over 100 Gbps grew by 645% QoQ.
This report is based on DDoS attacks that were automatically detected and mitigated by Cloudflare’s DDoS Protection systems. To learn more about how it works, check out this deep-dive blog post.
A note on how we measure DDoS attacks observed over our network To analyze attack trends, we calculate the “DDoS activity” rate, which is either the percentage of attack traffic out of the total traffic (attack + clean) observed over our global network, or in a specific location, or in a specific category (e.g., industry or billing country). Measuring the percentages allows us to normalize data points and avoid biases reflected in absolute numbers towards, for example, a Cloudflare data center that receives more total traffic and likely, also more attacks.
To view an interactive version of this report view it on Cloudflare Radar.
Ransom Attacks
Our systems constantly analyze traffic and automatically apply mitigation when DDoS attacks are detected. Each DDoS’d customer is prompted with an automated survey to help us better understand the nature of the attack and the success of the mitigation.
For over two years now, Cloudflare has been surveying attacked customers — one question on the survey being if they received a threat or a ransom note demanding payment in exchange to stop the DDoS attack. In the last quarter, 2021 Q4, we observed a record-breaking level of reported ransom DDoS attacks (one out of every five customers). This quarter, we’ve witnessed a drop in ransom DDoS attacks with only one out of 10 respondents reporting a ransom DDoS attack; a 28% decrease YoY and 52% decrease QoQ.
When we break it down by month, we can see that January 2022 saw the largest number of respondents reporting receiving a ransom letter in Q1. Almost one out of every five customers (17%).
Application-layer DDoS attacks
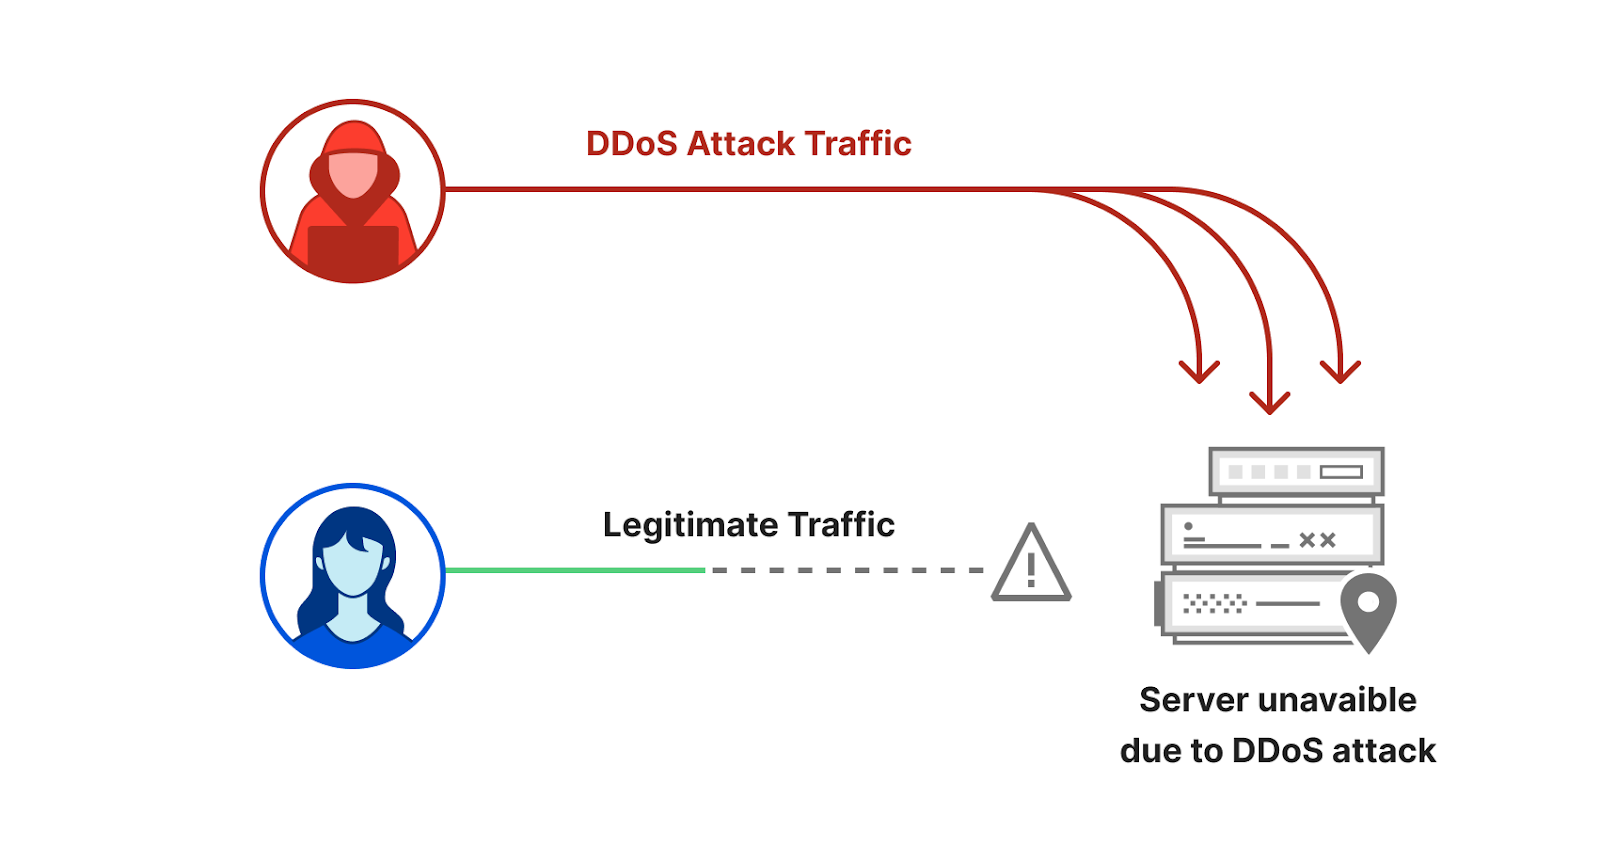
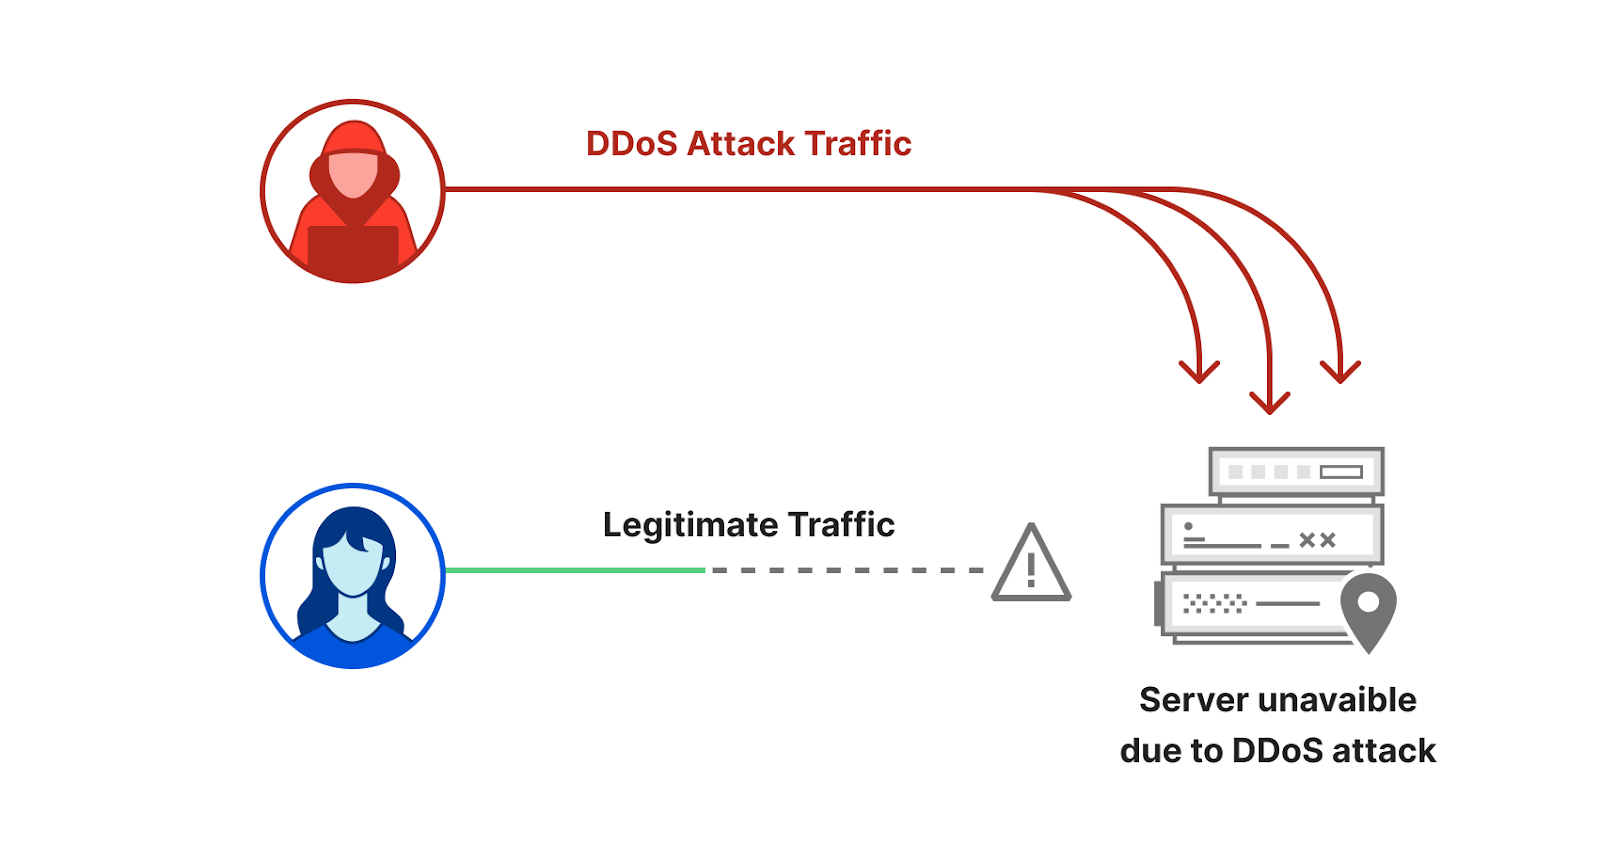
Application-layer DDoS attacks, specifically HTTP DDoS attacks, are attacks that usually aim to disrupt a web server by making it unable to process legitimate user requests. If a server is bombarded with more requests than it can process, the server will drop legitimate requests and — in some cases — crash, resulting in degraded performance or an outage for legitimate users.
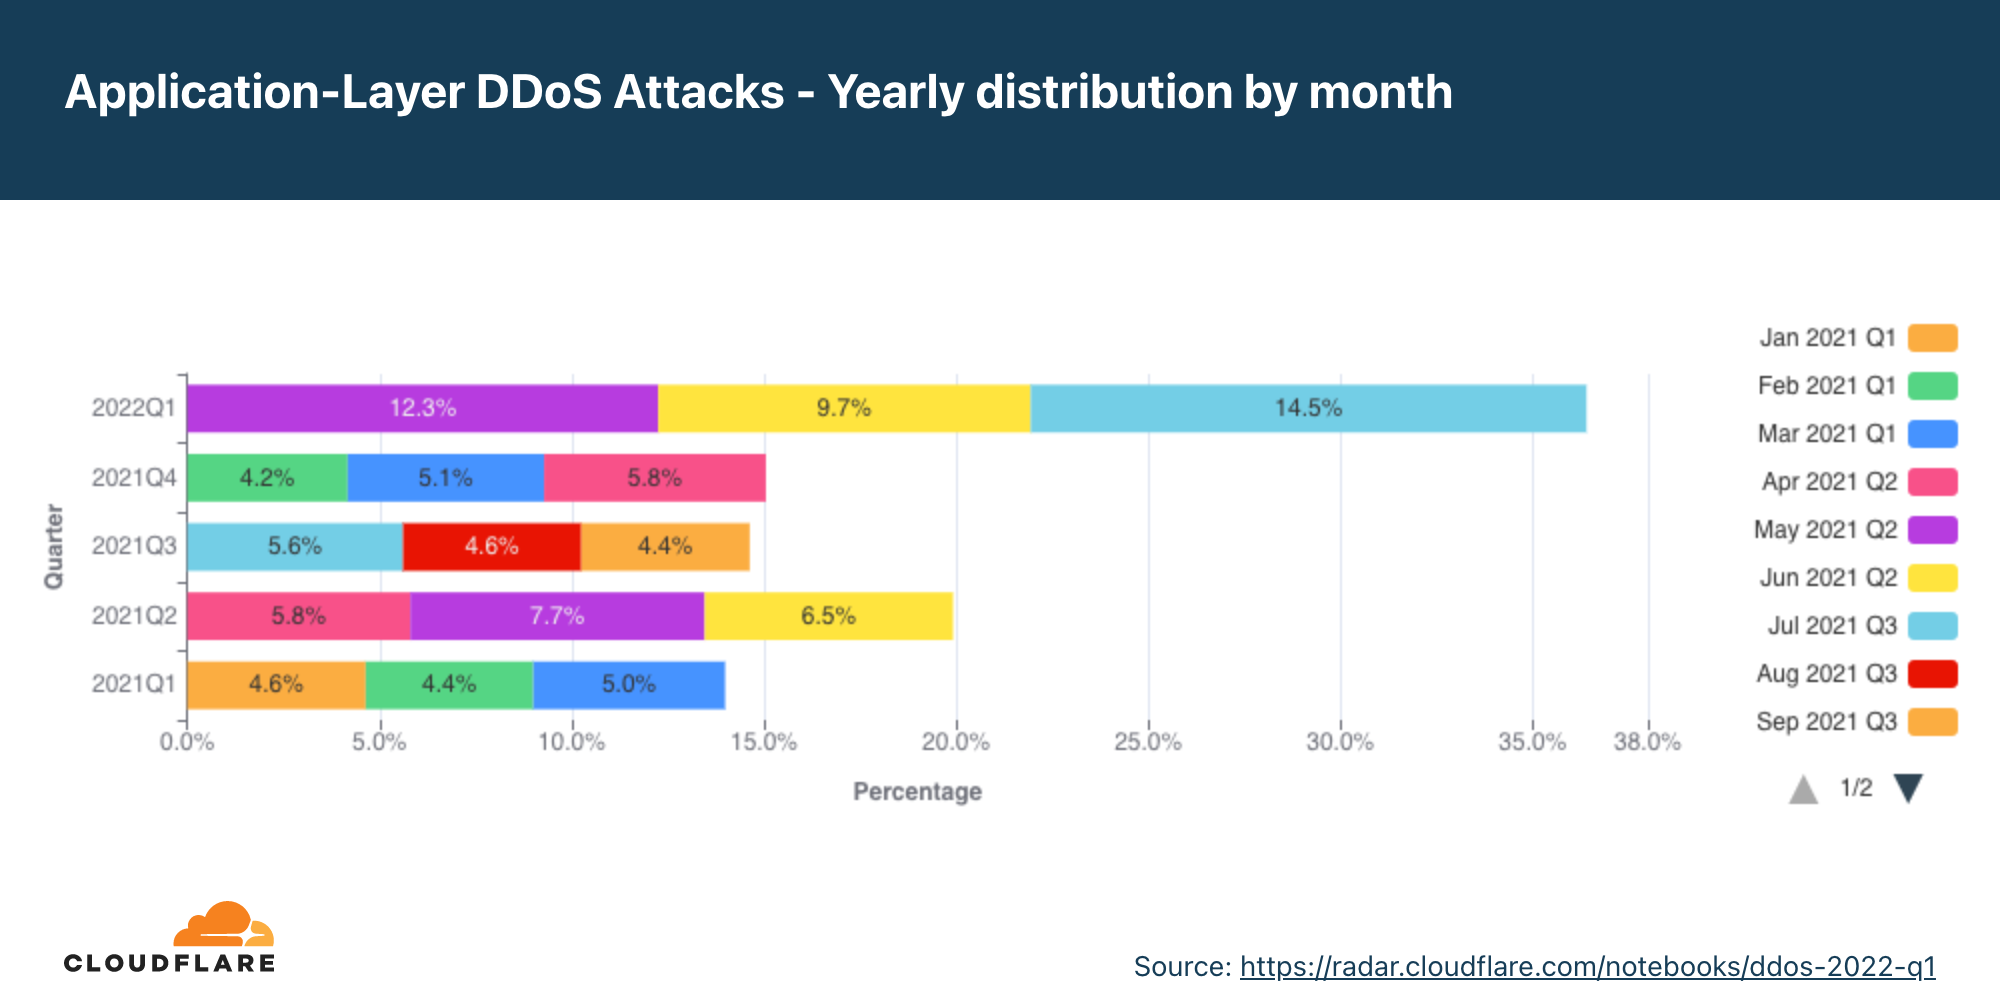
Application-layer DDoS attacks by month
In Q1, application-layer DDoS attacks soared by 164% YoY and 135% QoQ – the busiest quarter within the past year.
Application-layer DDoS attacks increased to new heights in the first quarter of 2022. In March alone, there were more HTTP DDoS attacks than in all of 2021 Q4 combined (and Q3, and Q1).
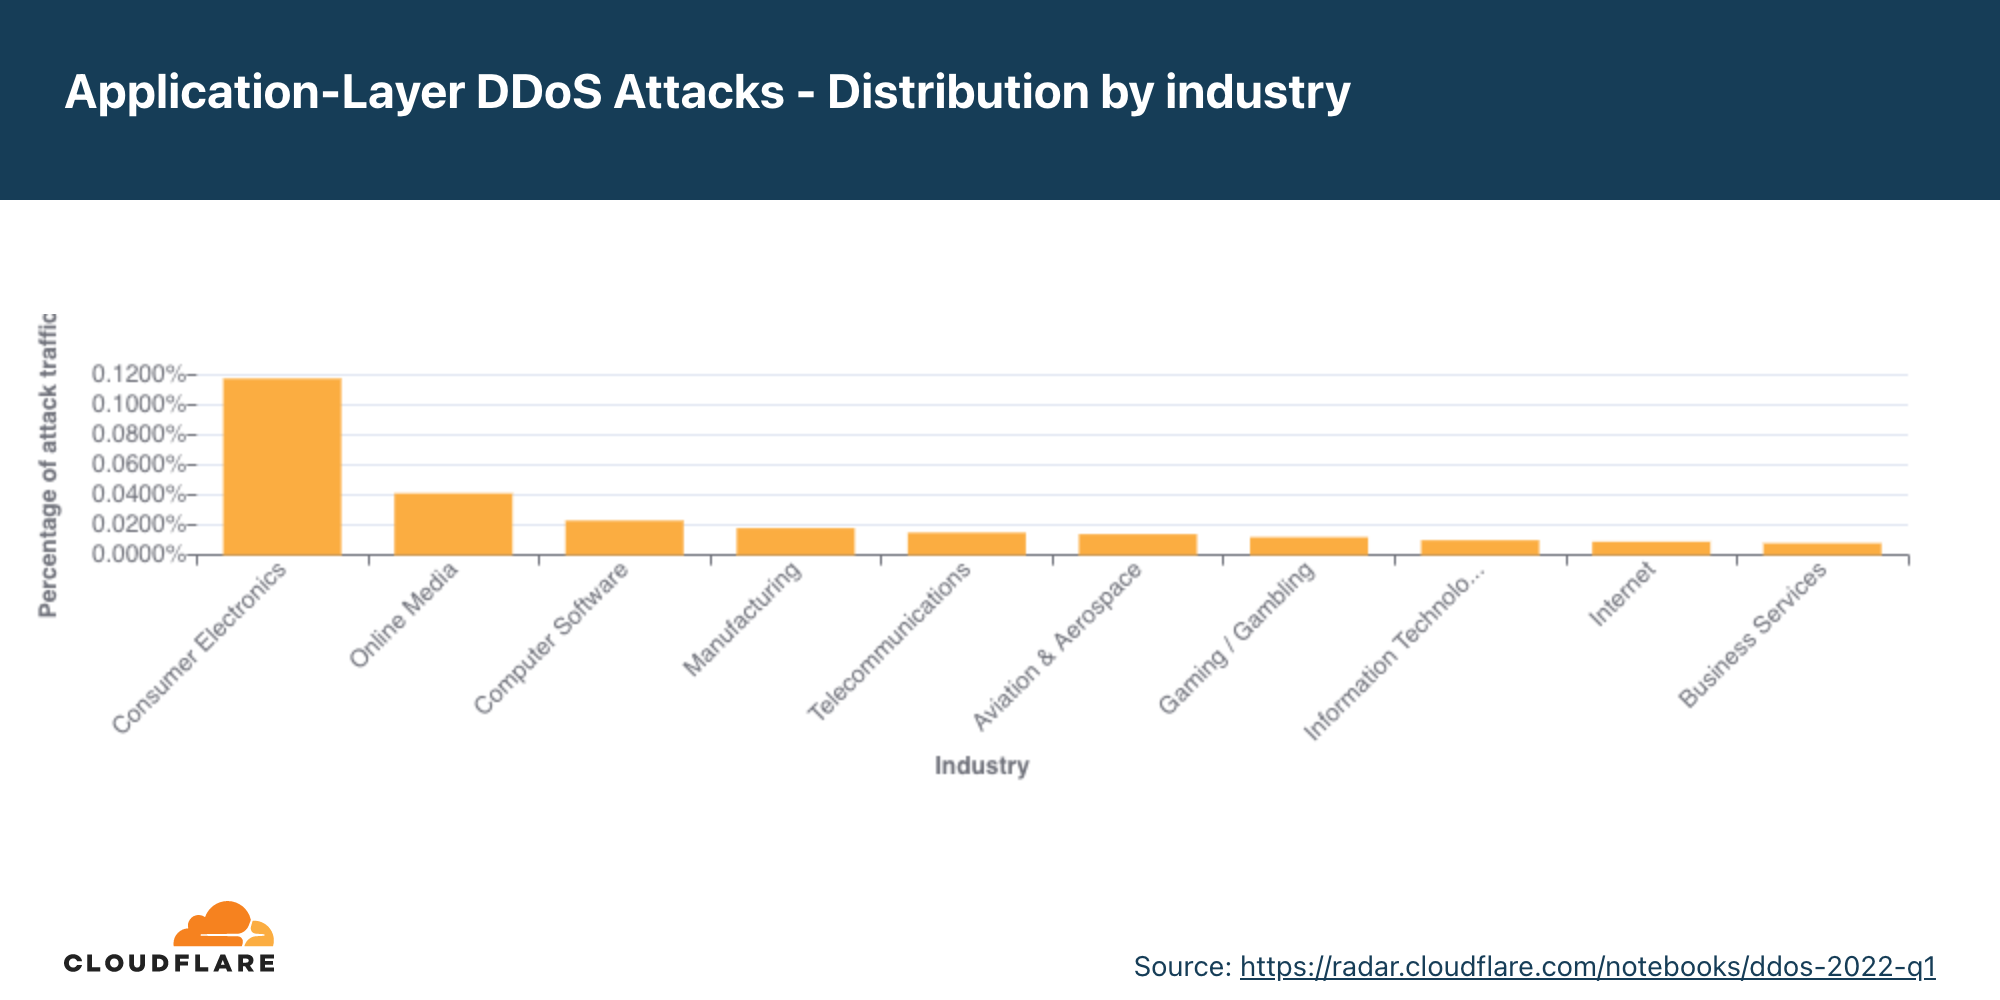
Application-layer DDoS attacks by industry
Consumer Electronics was the most targeted industry in Q1.
Globally, the Consumer Electronics industry was the most attacked with an increase of 5,086% QoQ. Second was the Online Media industry with a 2,131% increase in attacks QoQ. Third were Computer Software companies, with an increase of 76% QoQ and 1,472 YoY.
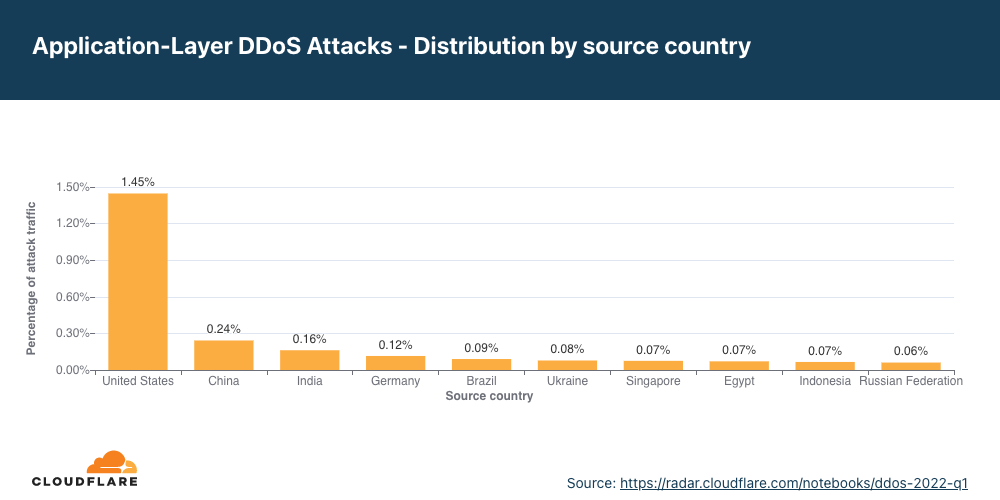
To understand the origin of the HTTP attacks, we look at the geolocation of the source IP address belonging to the client that generated the attack HTTP requests. Unlike network-layer attacks, source IP addresses cannot be spoofed in HTTP attacks. A high percentage of DDoS activity in a given country usually indicates the presence of botnets operating from within the country’s borders.
After four consecutive quarters in a row with China as the top source of HTTP DDoS attacks, the US stepped into the lead this quarter. HTTP DDoS attacks originating from the US increased by a staggering 6,777% QoQ and 2,225% YoY. Following China in second place are India, Germany, Brazil, and Ukraine.
Application-layer DDoS attacks by target country
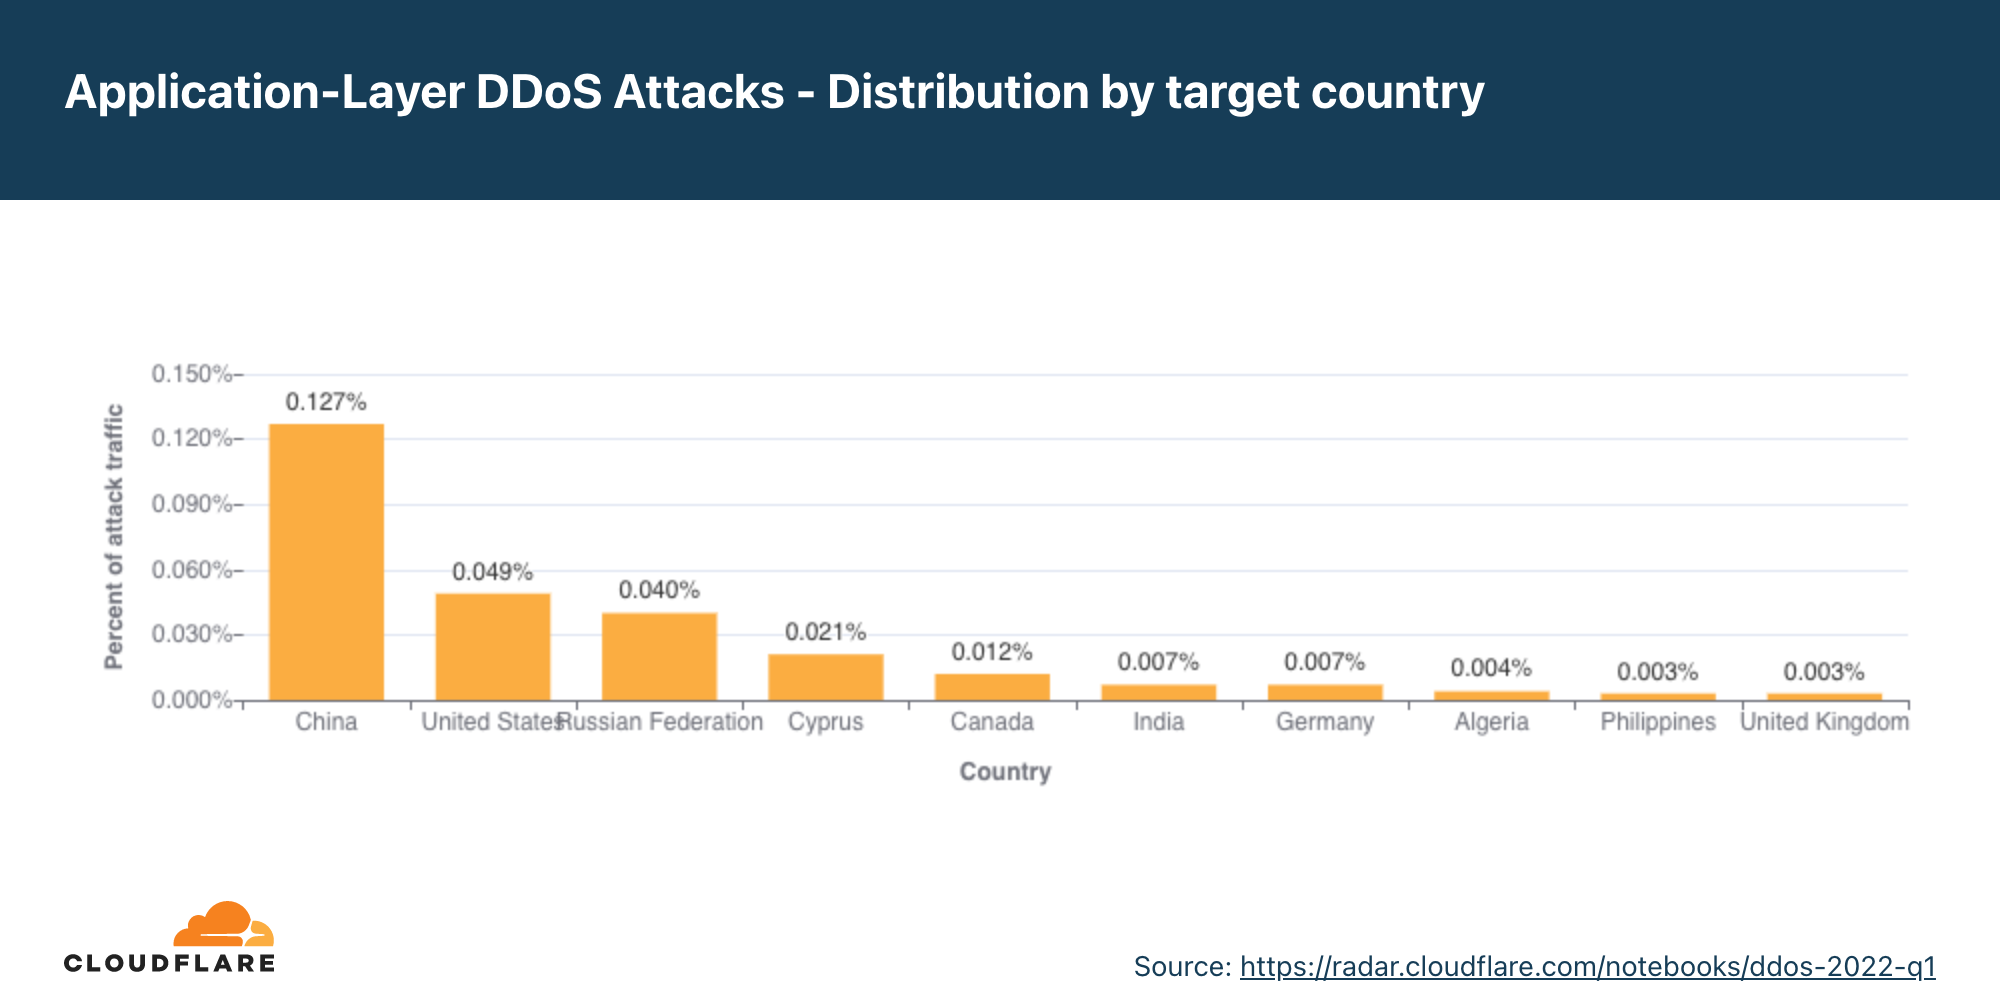
In order to identify which countries are targeted by the most HTTP DDoS attacks, we bucket the DDoS attacks by our customers’ billing countries and represent it as a percentage out of all DDoS attacks.
The US drops to second place, after being first for three consecutive quarters. Organizations in China were targeted the most by HTTP DDoS attacks, followed by the US, Russia, and Cyprus.
Network-layer DDoS attacks
While application-layer attacks target the application (Layer 7 of the OSI model) running the service that end users are trying to access (HTTP/S in our case), network-layer attacks aim to overwhelm network infrastructure (such as in-line routers and servers) and the Internet link itself.
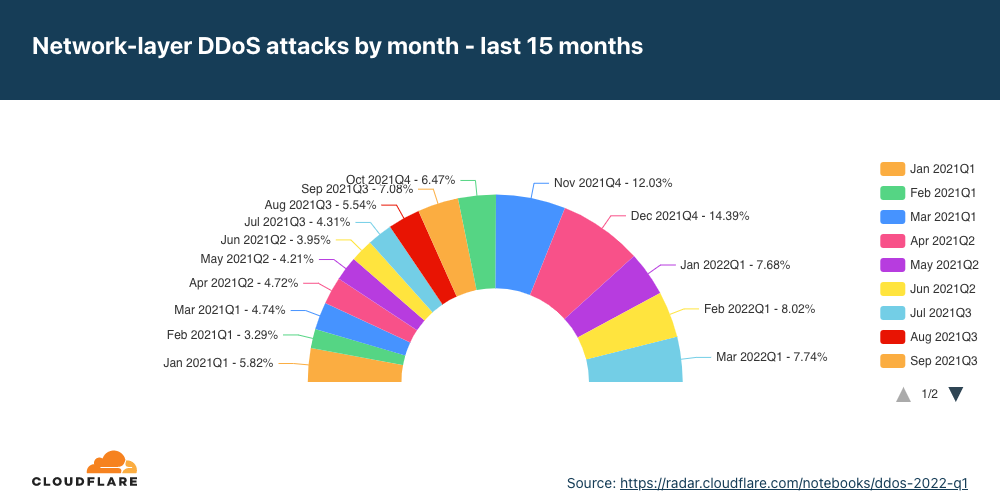
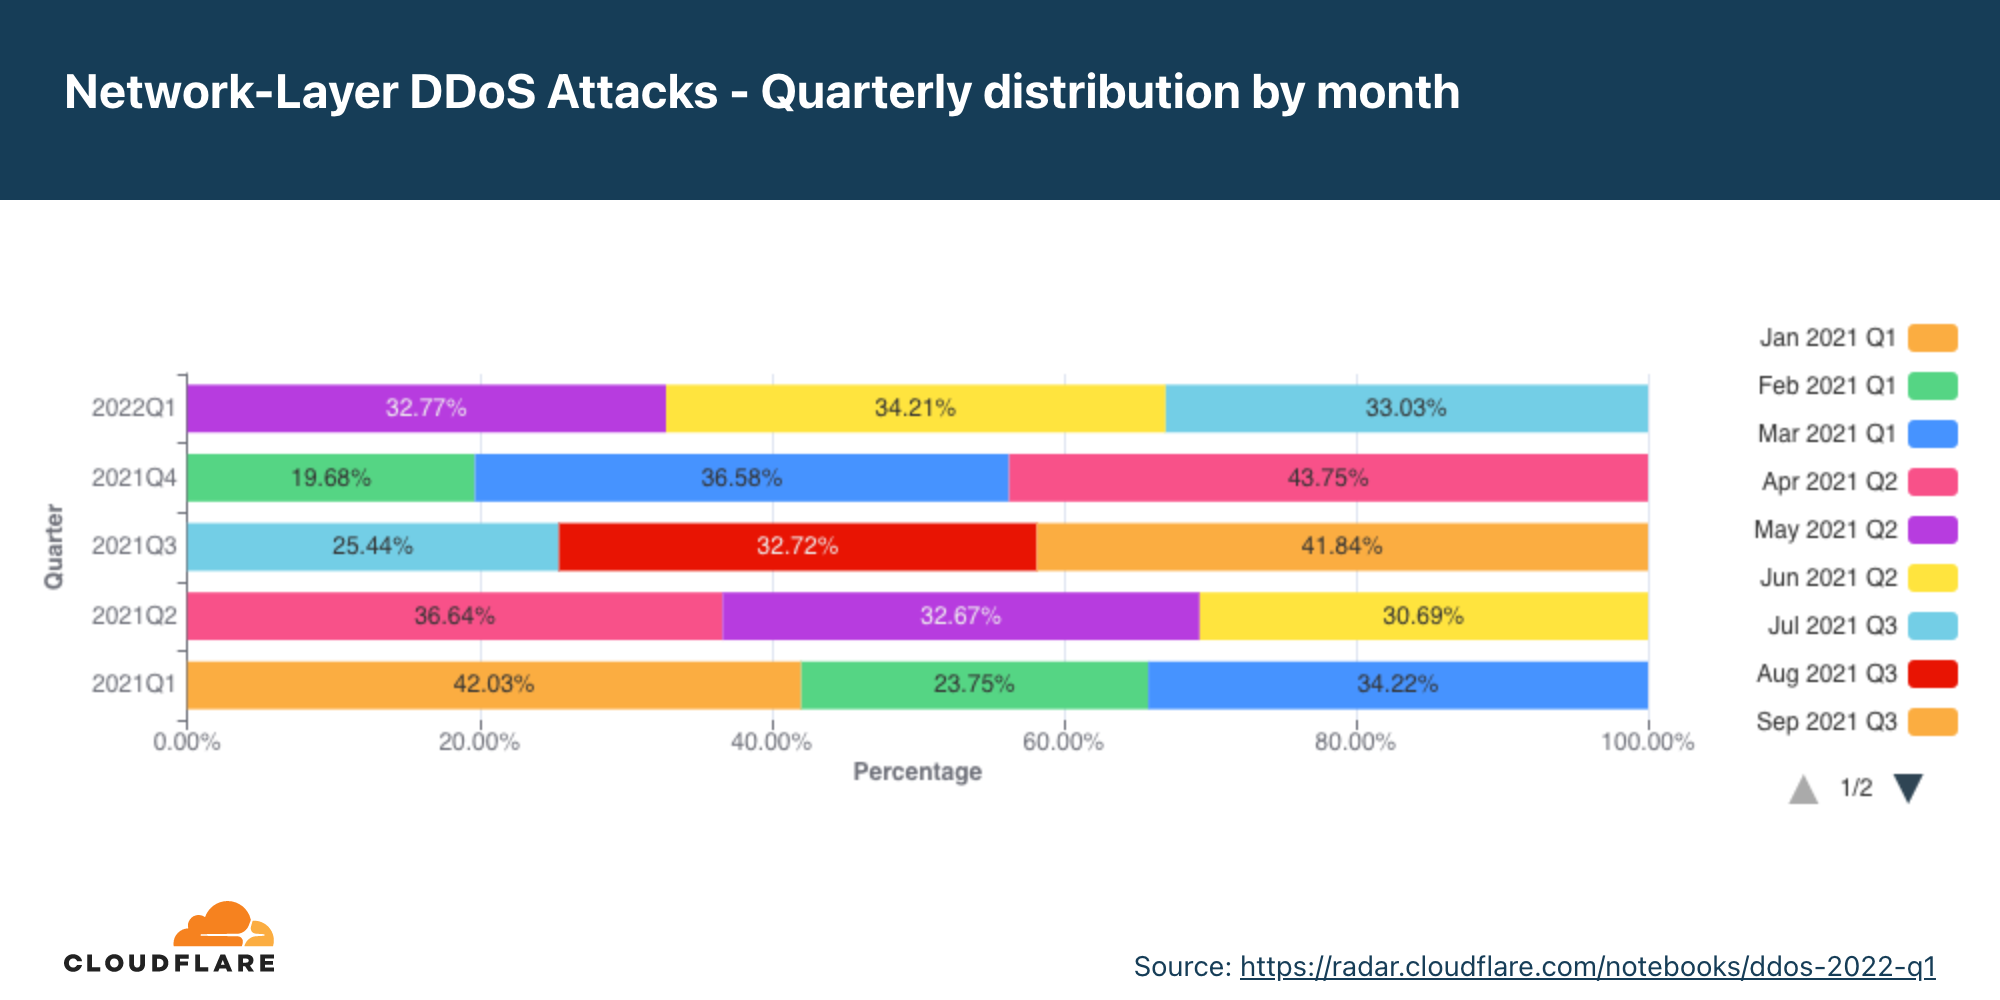
Network-layer DDoS attacks by month
While HTTP DDoS attacks soared in Q1, network-layer DDoS attacks actually decreased by 58% QoQ, but still increased by 71% YoY.
Diving deeper into Q1, we can see that the amount of network-layer DDoS attacks remained mostly consistent throughout the quarter with about a third of attacks occurring every month.
Amongst these network-layer DDoS attacks are also zero-day DDoS attacks that Cloudflare automatically detected and mitigated.
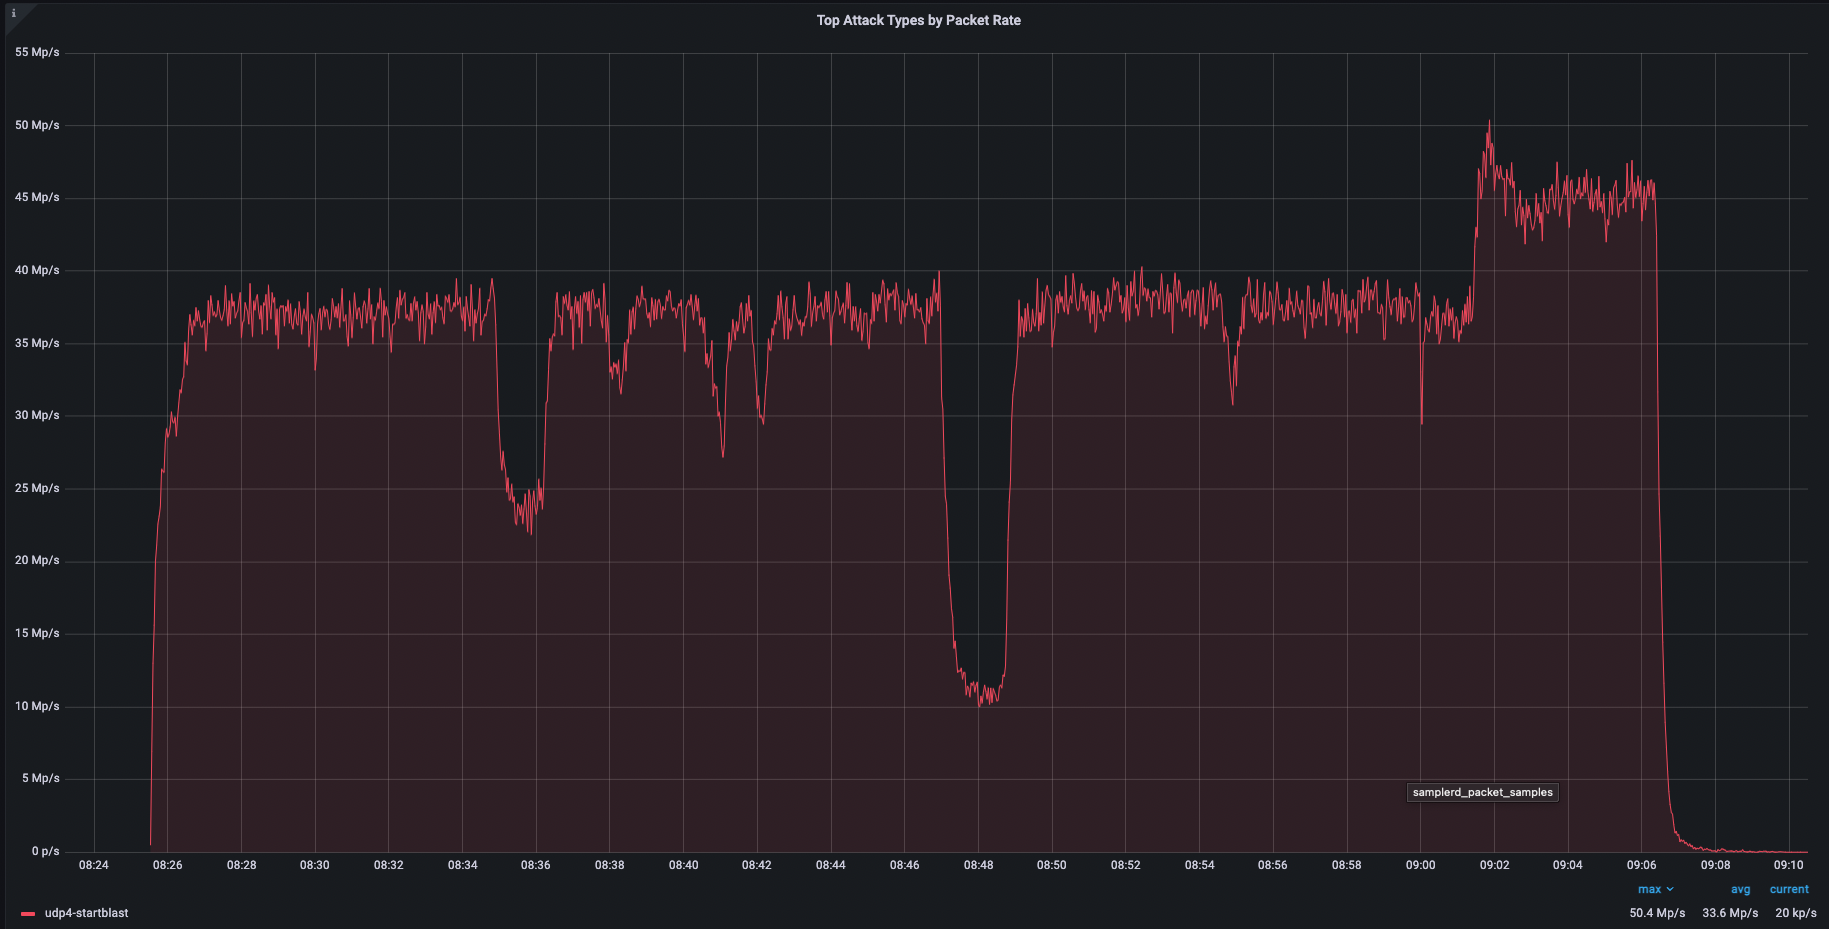
In the beginning of March, Cloudflare researchers helped investigate and expose a zero-day vulnerability in Mitel business phone systems that amongst other possible exploitations, also enables attackers to launch an amplification DDoS attack. This type of attack reflects traffic off vulnerable Mitel servers to victims, amplifying the amount of traffic sent in the process by an amplification factor of 220 billion percent in this specific case. You can read more about it in our recent blog post.
We observed several of these attacks across our network. One of them targeted a North American cloud provider using the Cloudflare Magic Transit service. The attack originated from 100 source IPs mainly from the US, UK, Canada, Netherlands, Australia, and approximately 20 other countries. It peaked above 50 Mpps (~22 Gbps) and was automatically detected and mitigated by Cloudflare systems.
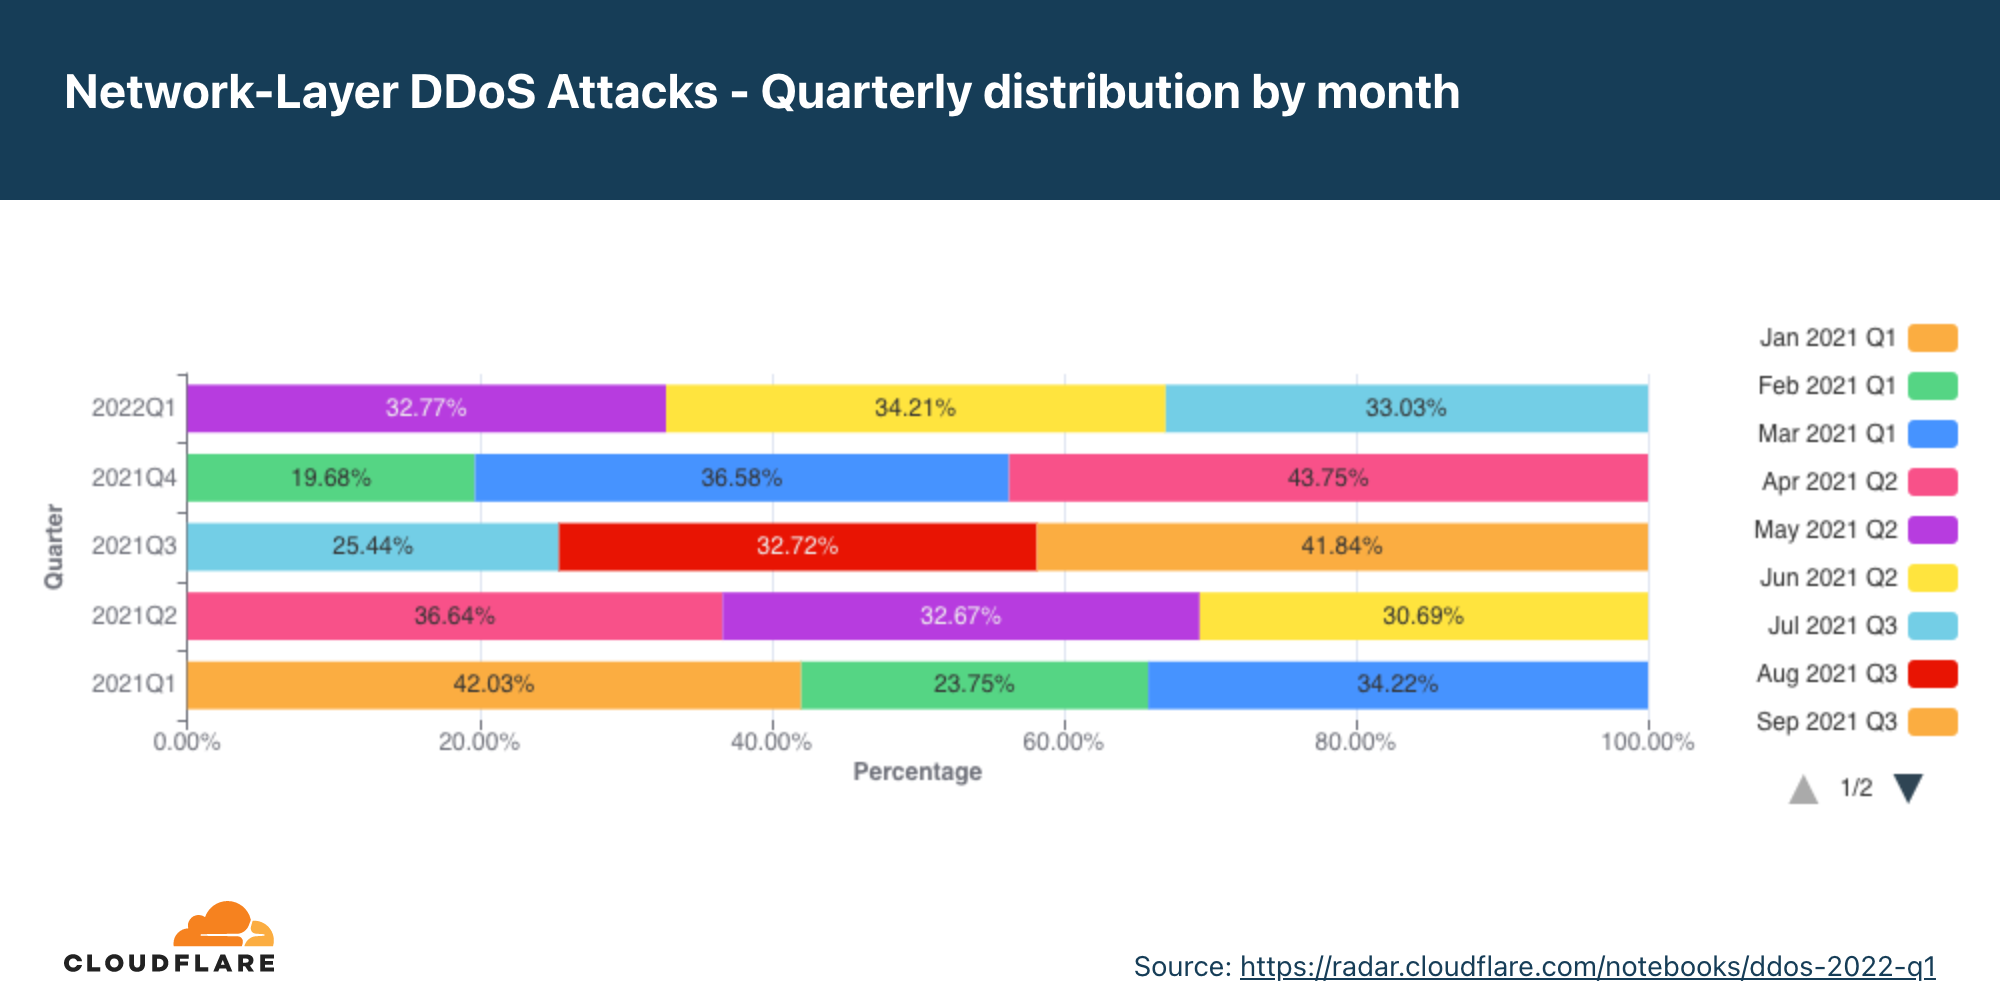
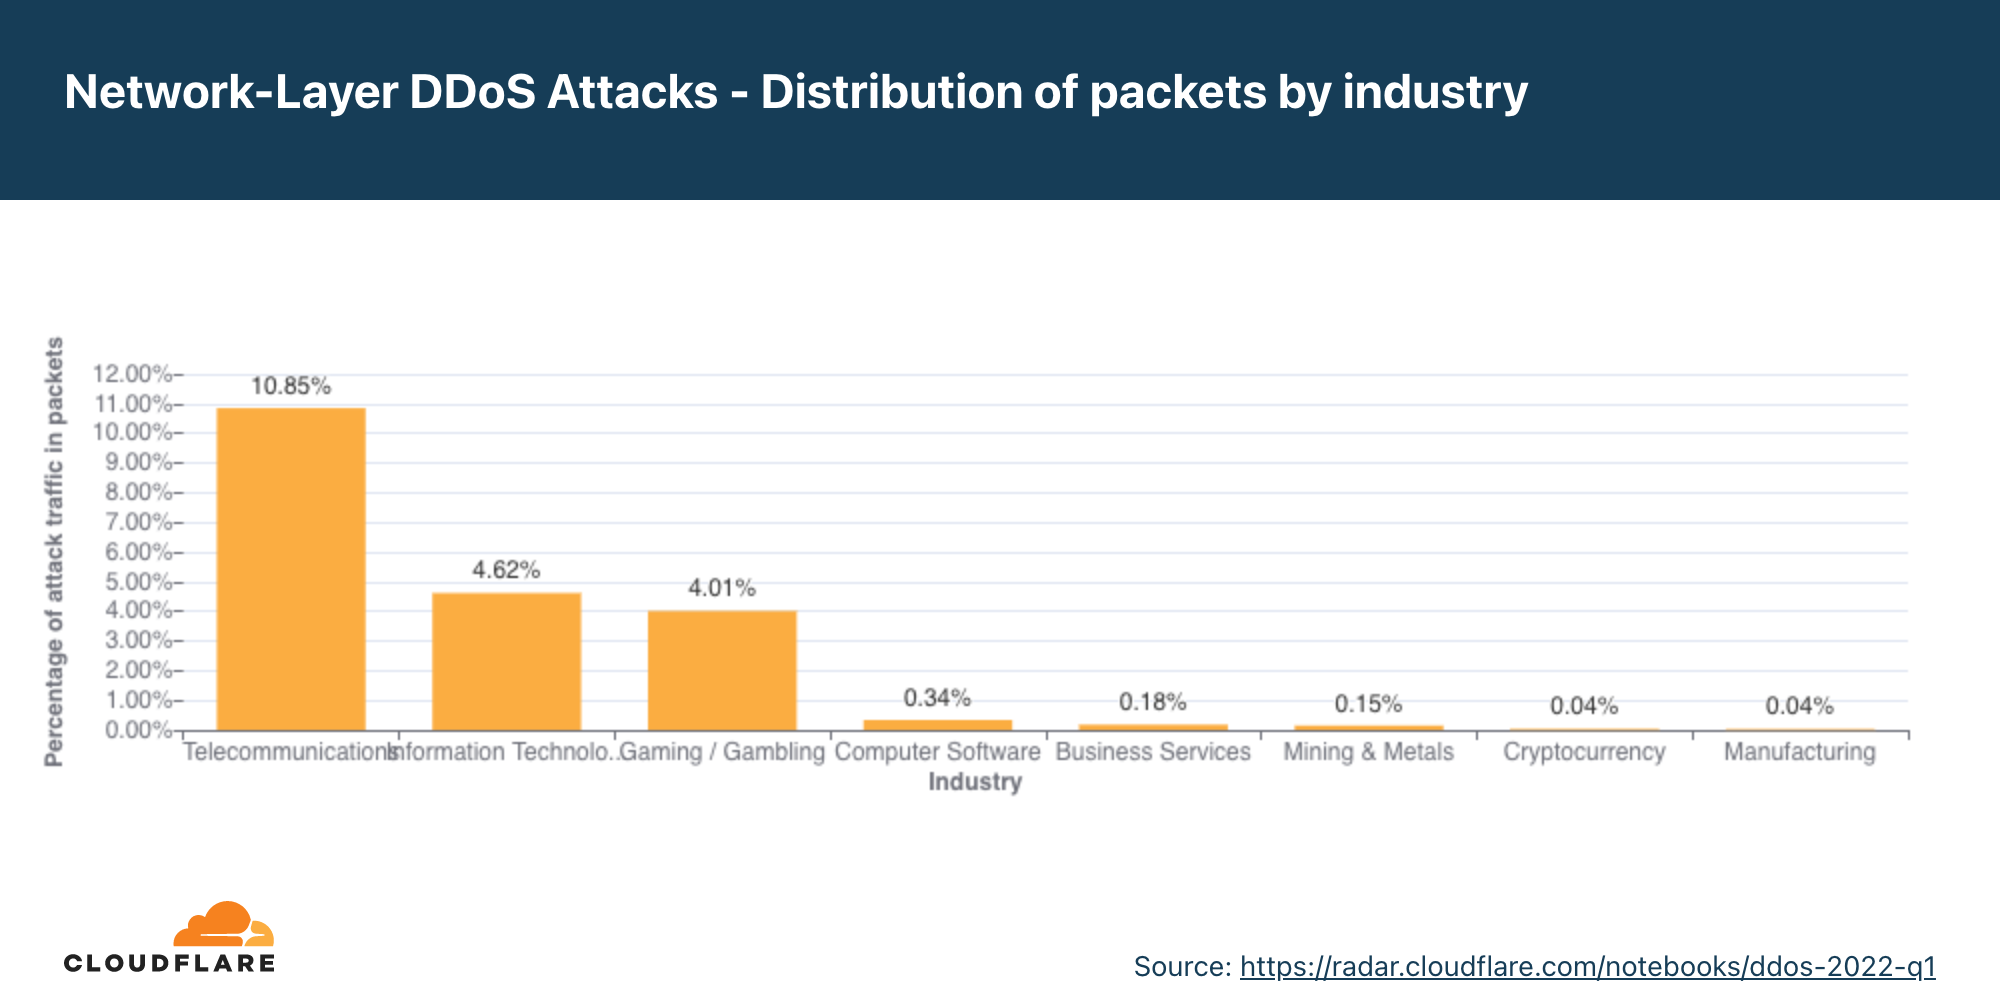
In this report, for the first time, we’ve begun classifying network-layer DDoS attacks according to the industries of our customers using the Spectrum and Magic products. This classification allows us to understand which industries are targeted the most by network-layer DDoS attacks.
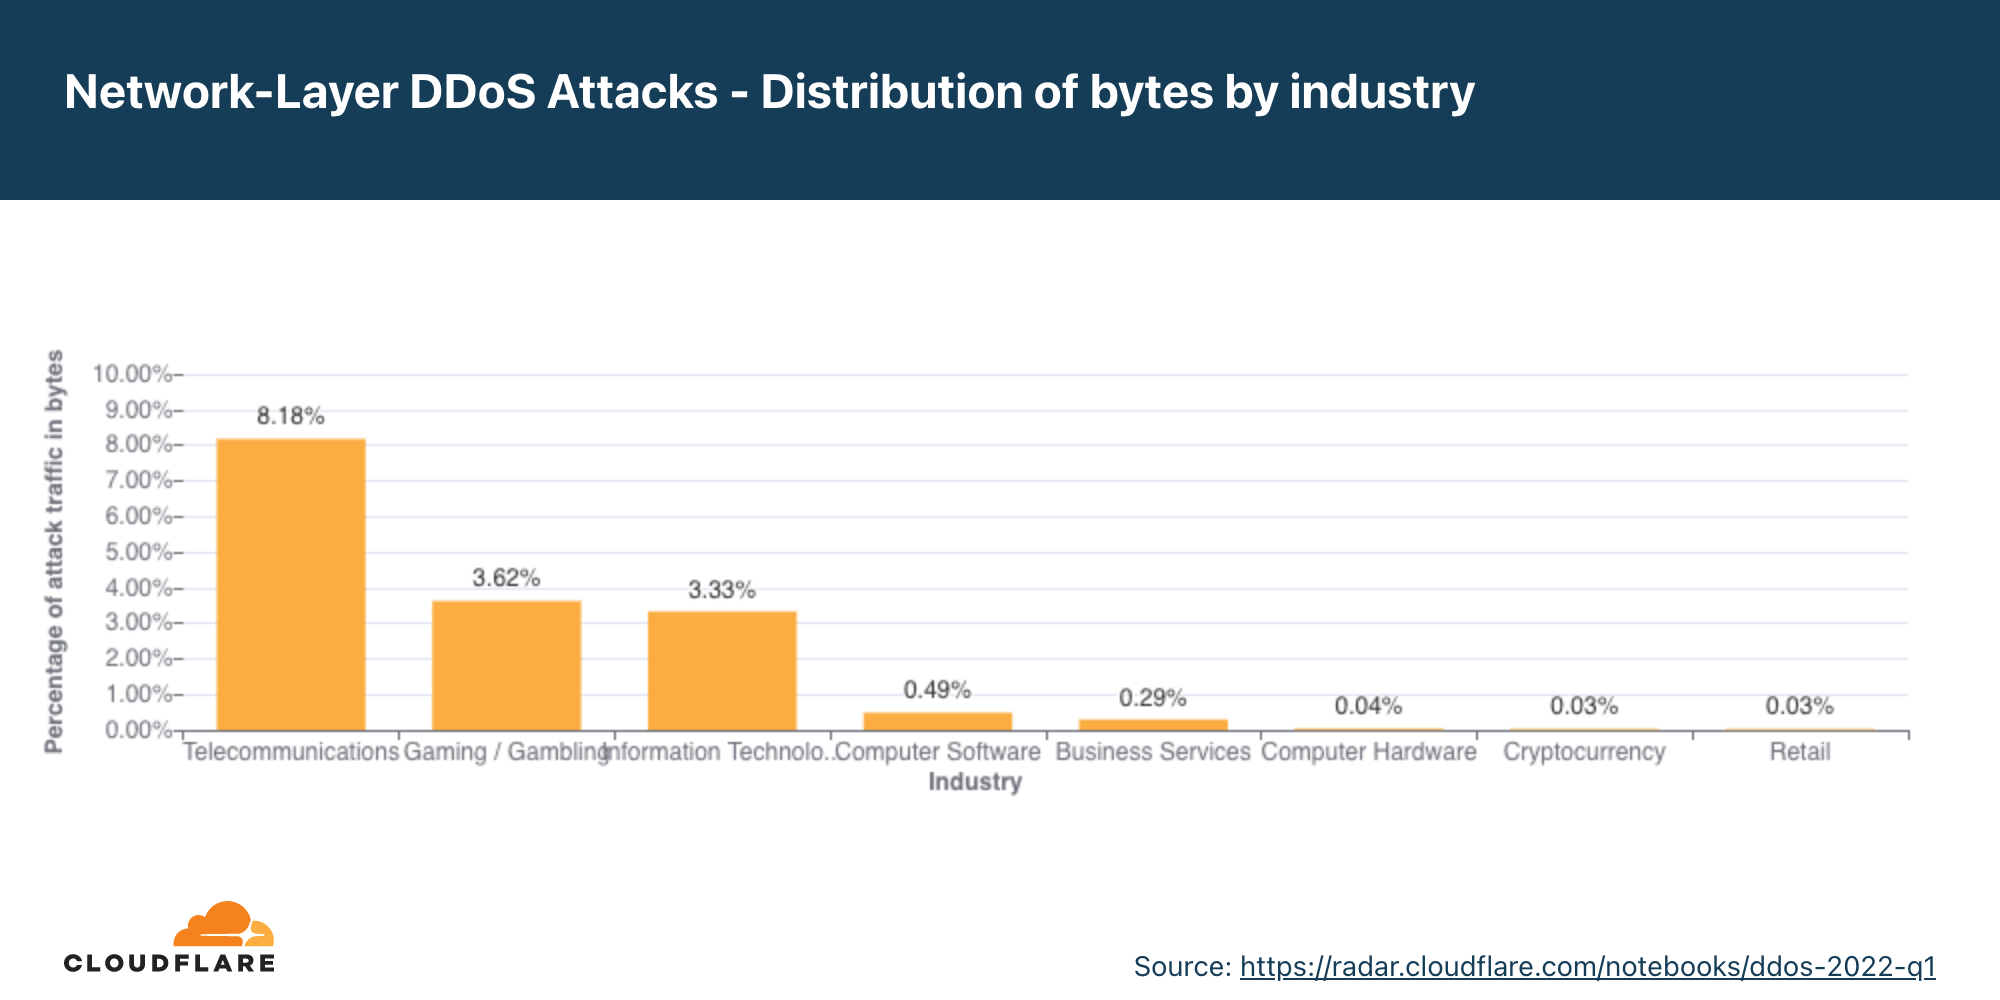
When we look at Q1 statistics, we can see that in terms of attack packets and attack bytes launched towards Cloudflare customers, the Telecommunications industry was targeted the most. More than 8% of all attack bytes and 10% of all attack packets that Cloudflare mitigated targeted Telecommunications companies.
Following not too far behind, in second and third place were the Gaming / Gambling and Information Technology and Services industries.
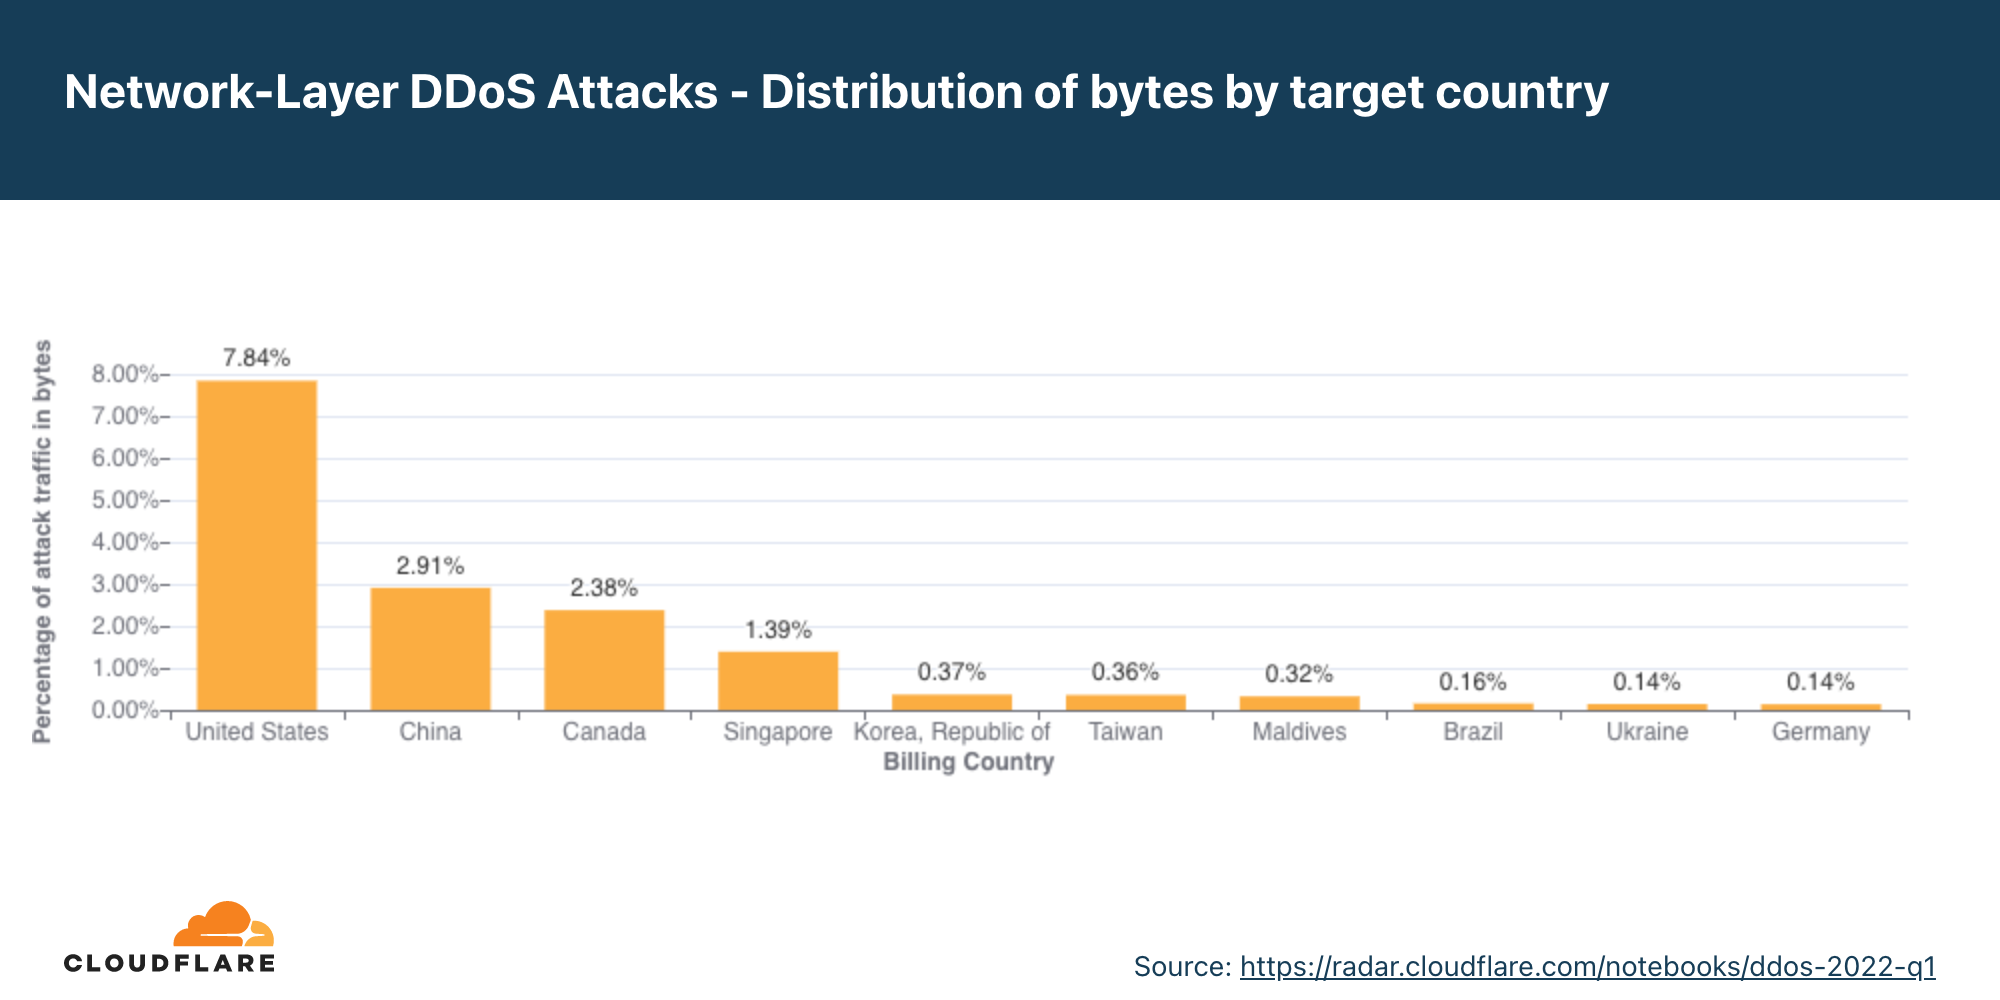
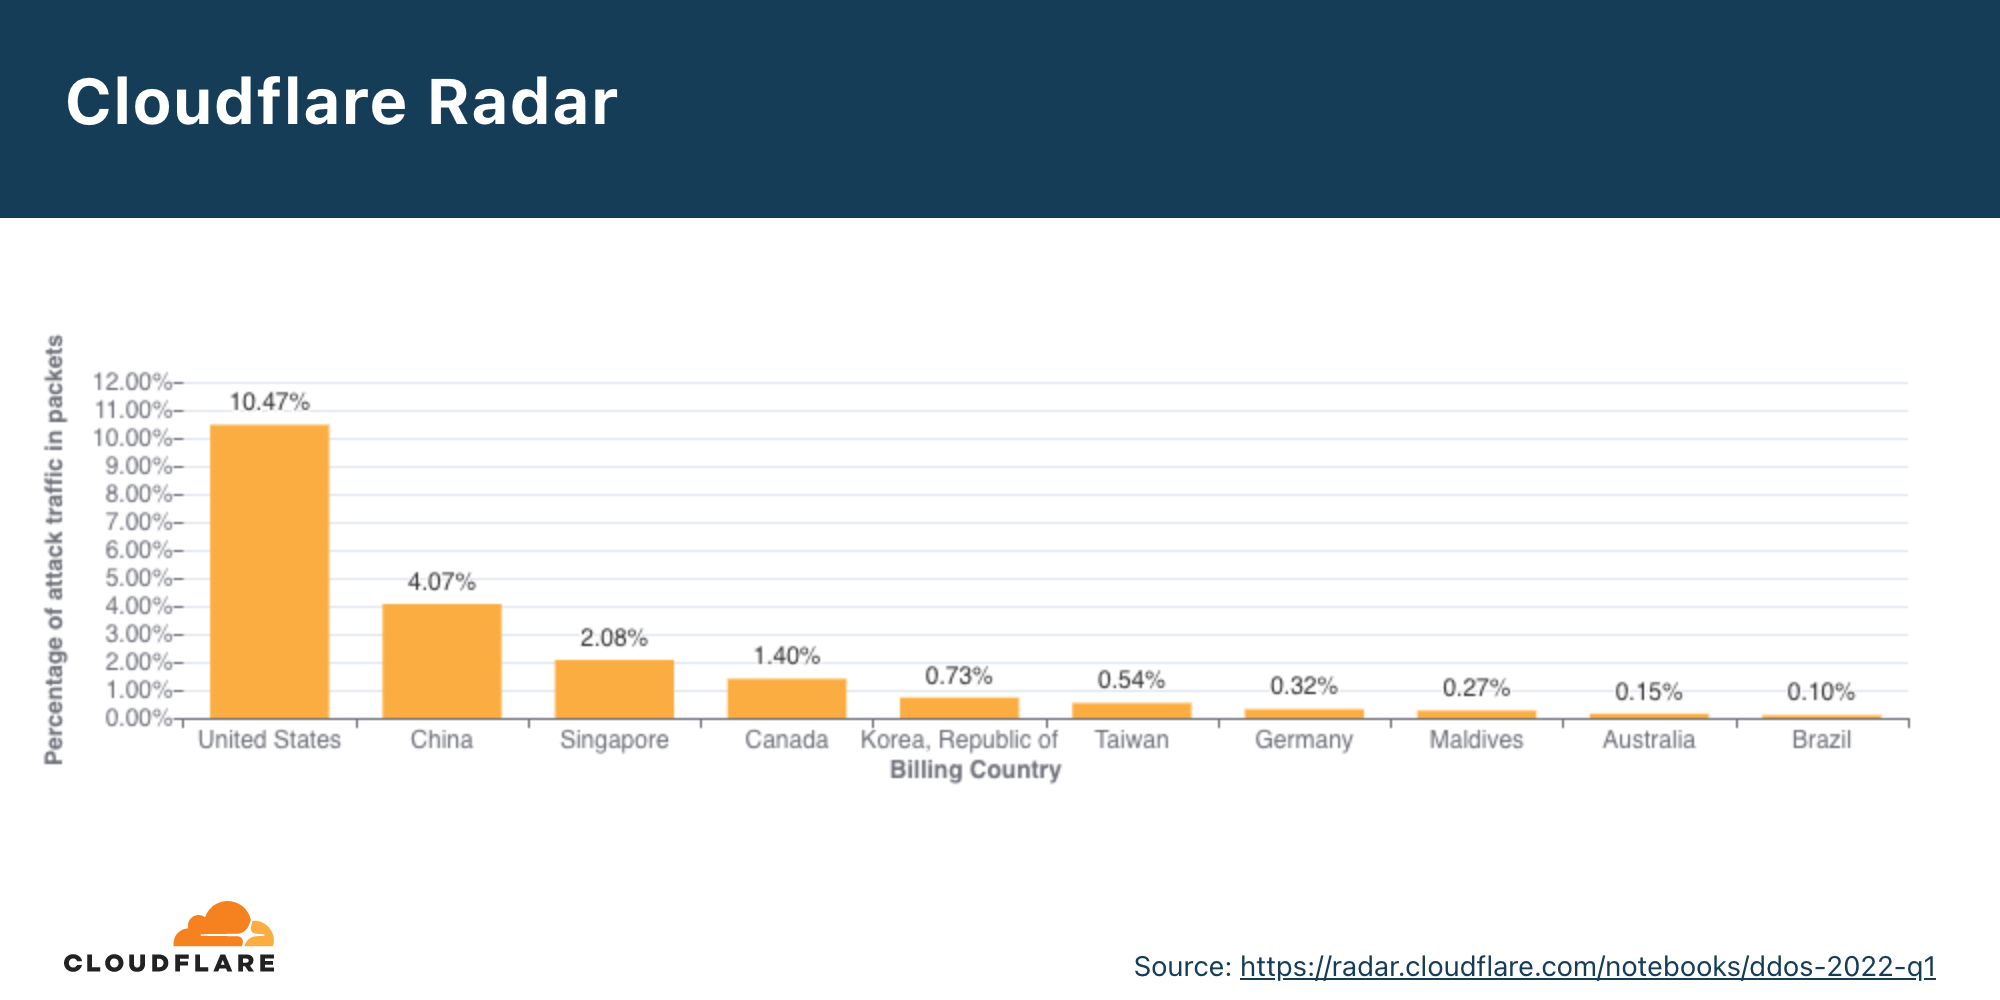
Network-layer DDoS attacks by target country
Similarly to the classification by our customers’ industry, we can also bucket attacks by our customers’ billing country as we do for application-layer DDoS attacks, to identify the top attacked countries.
Looking at Q1 numbers, we can see that the US was targeted by the highest percentage of DDoS attacks traffic — over 10% of all attack packets and almost 8% of all attack bytes. Following the US is China, Canada, and Singapore.
Network-layer DDoS attacks by ingress country
When trying to understand where network-layer DDoS attacks originate, we cannot use the same method as we use for the application-layer attack analysis. To launch an application-layer DDoS attack, successful handshakes must occur between the client and the server in order to establish an HTTP/S connection. For a successful handshake to occur, the attacker cannot spoof their source IP address. While the attacker may use botnets, proxies, and other methods to obfuscate their identity, the attacking client’s source IP location does sufficiently represent the attack source of application-layer DDoS attacks.
On the other hand, to launch network-layer DDoS attacks, in most cases, no handshake is needed. Attackers can spoof the source IP address in order to obfuscate the attack source and introduce randomness into the attack properties, which can make it harder for simple DDoS protection systems to block the attack. So if we were to derive the source country based on a spoofed source IP, we would get a ‘spoofed country’.
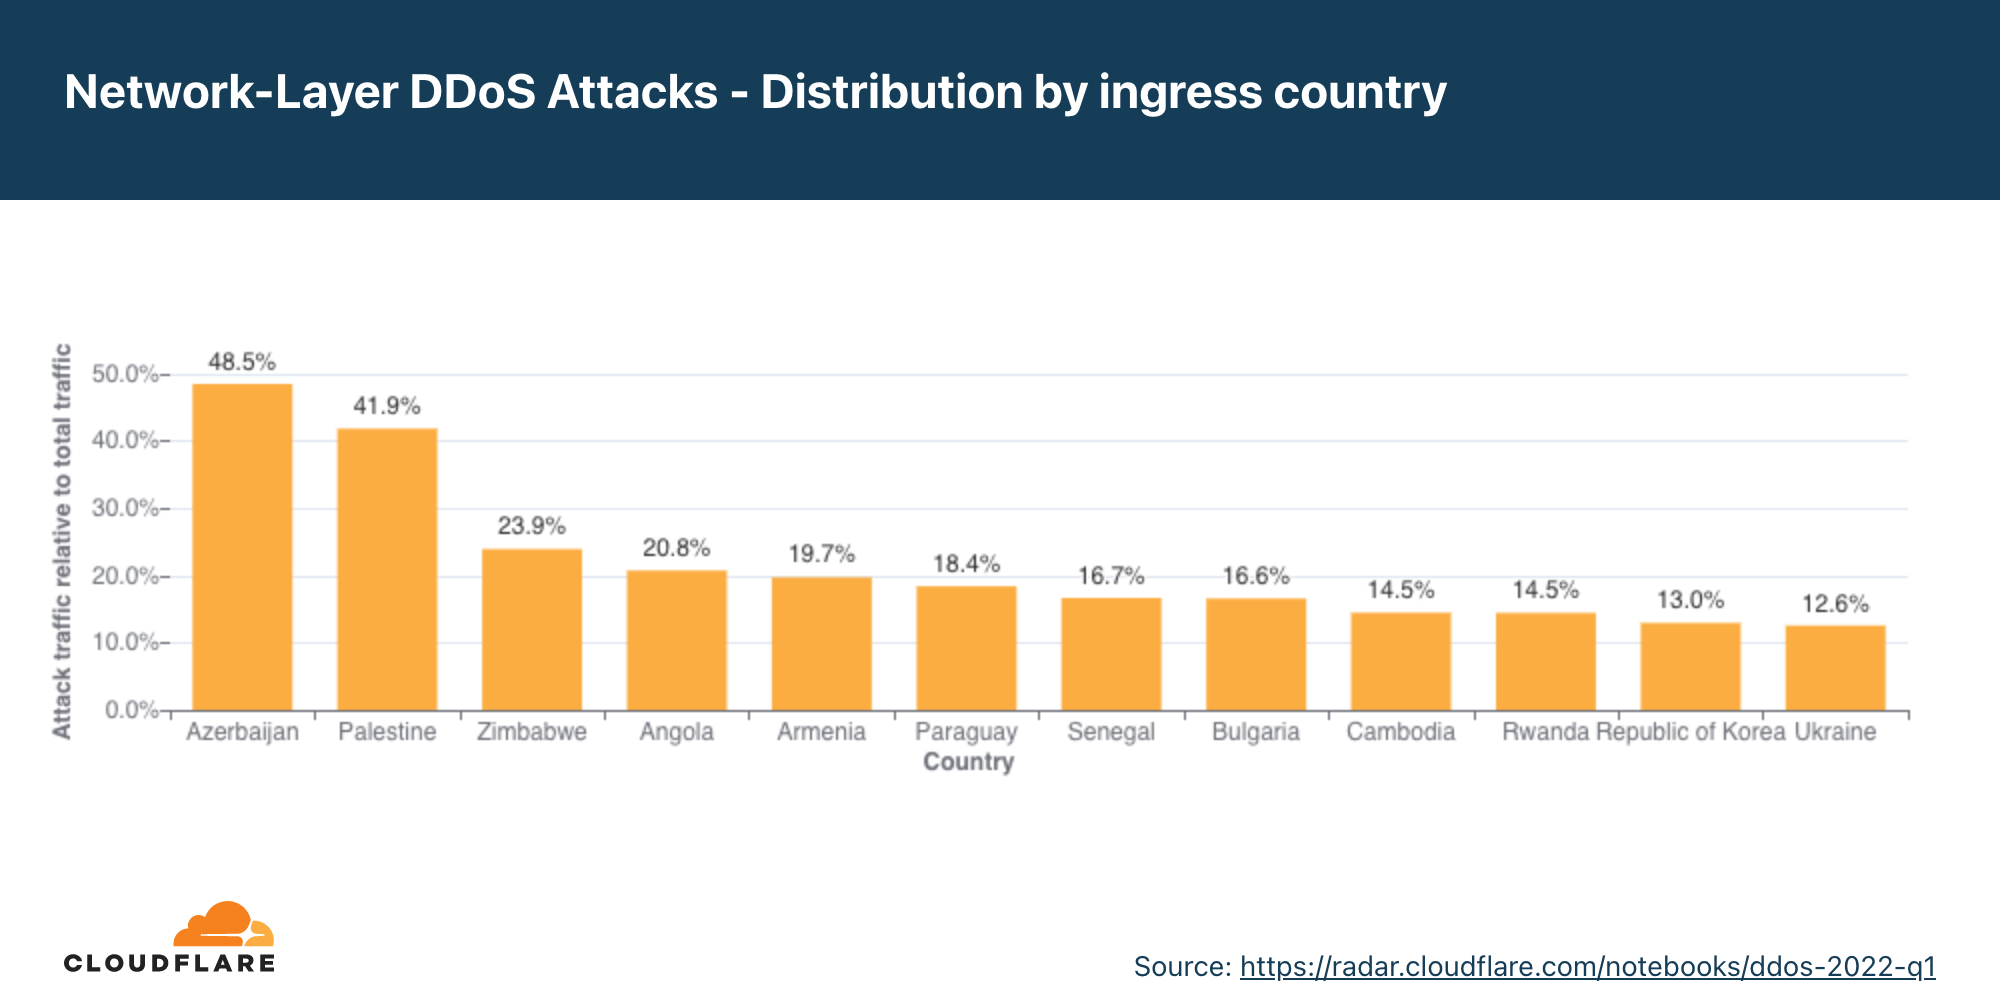
For this reason, when analyzing network-layer DDoS attack sources, we bucket the traffic by the Cloudflare edge data center locations where the traffic was ingested, and not by the (potentially) spoofed source IP to get an understanding of where the attacks originate from. We are able to achieve geographical accuracy in our report because we have data centers in over 270 cities around the world. However, even this method is not 100% accurate, as traffic may be back hauled and routed via various Internet Service Providers and countries for reasons that vary from cost reduction to congestion and failure management.
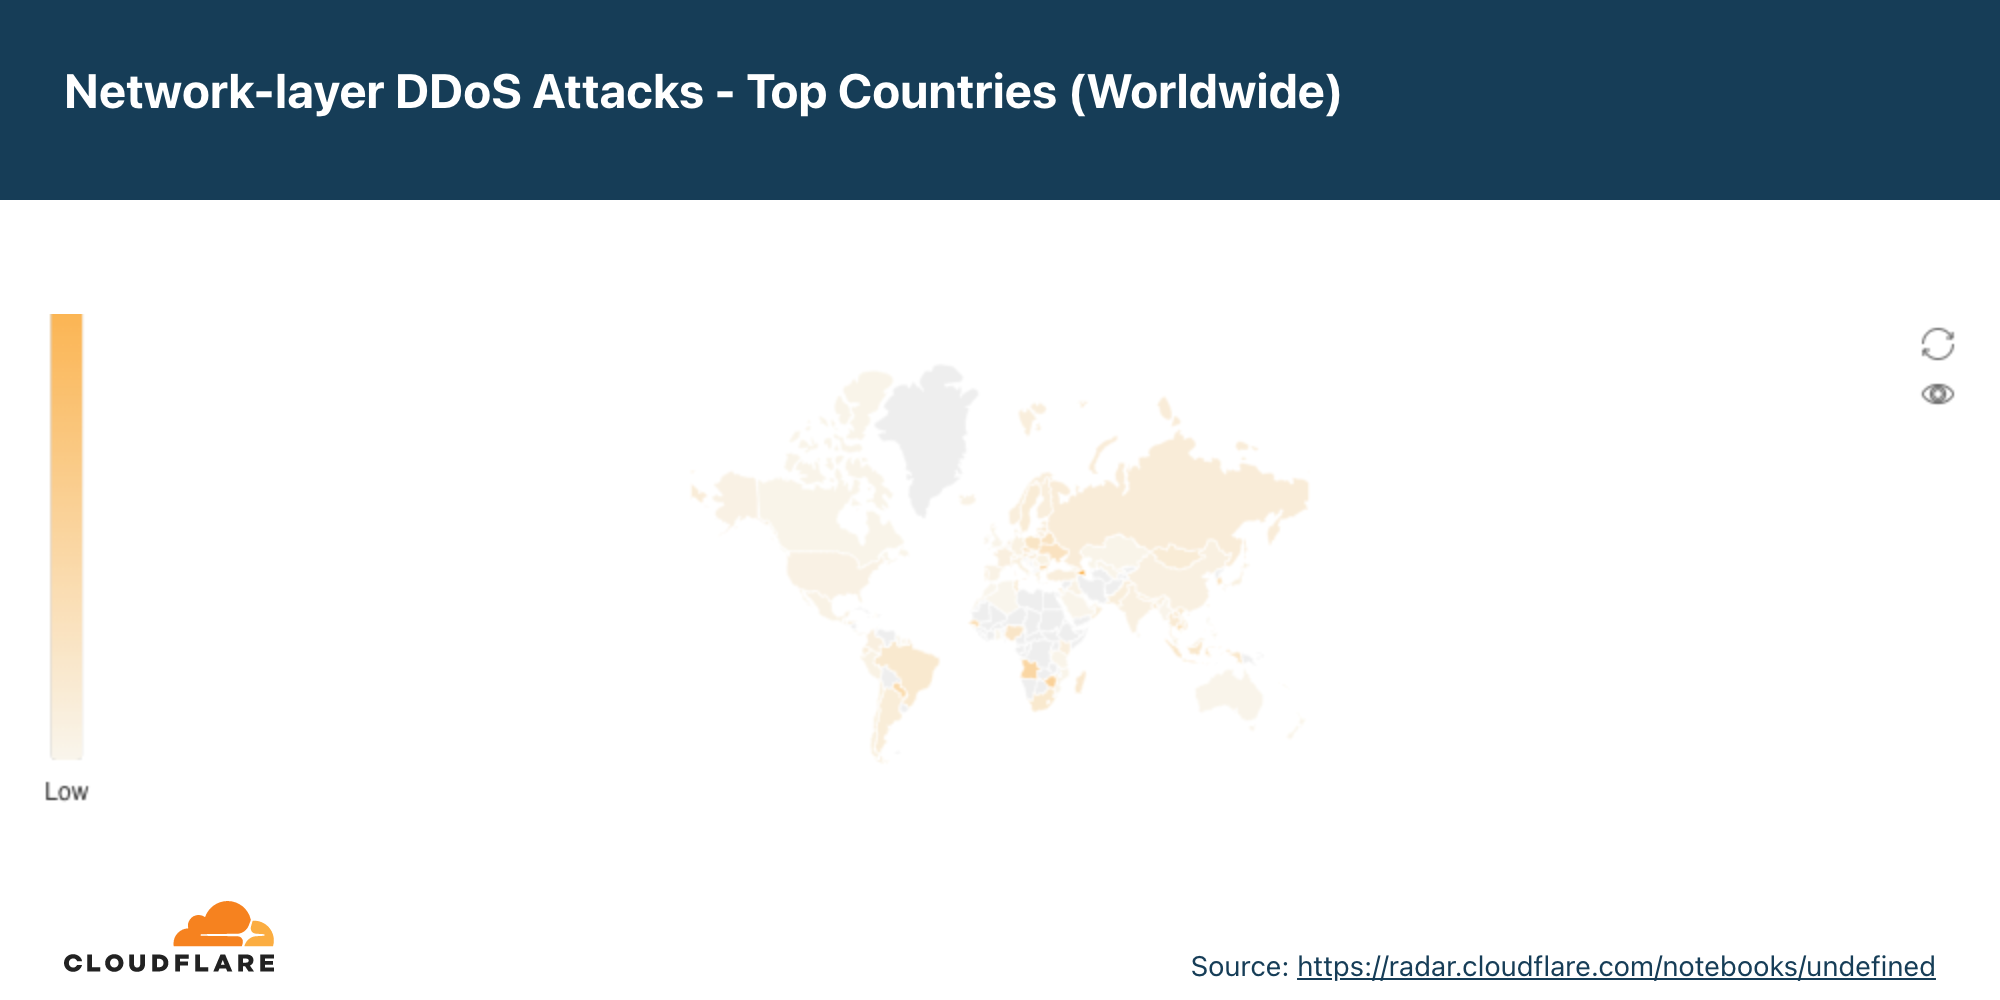
In Q1, the percentage of attacks detected in Cloudflare’s data centers in Azerbaijan increased by 16,624% QoQ and 96,900% YoY, making it the country with the highest percentage of network-layer DDoS activity (48.5%).
Following our Azerbaijanian data center is our Palestinian data center where a staggering 41.9% of all traffic was DDoS traffic. This represents a 10,120% increase QoQ and 46,456% YoY.
To view all regions and countries, check out the interactive map.
Attack vectors
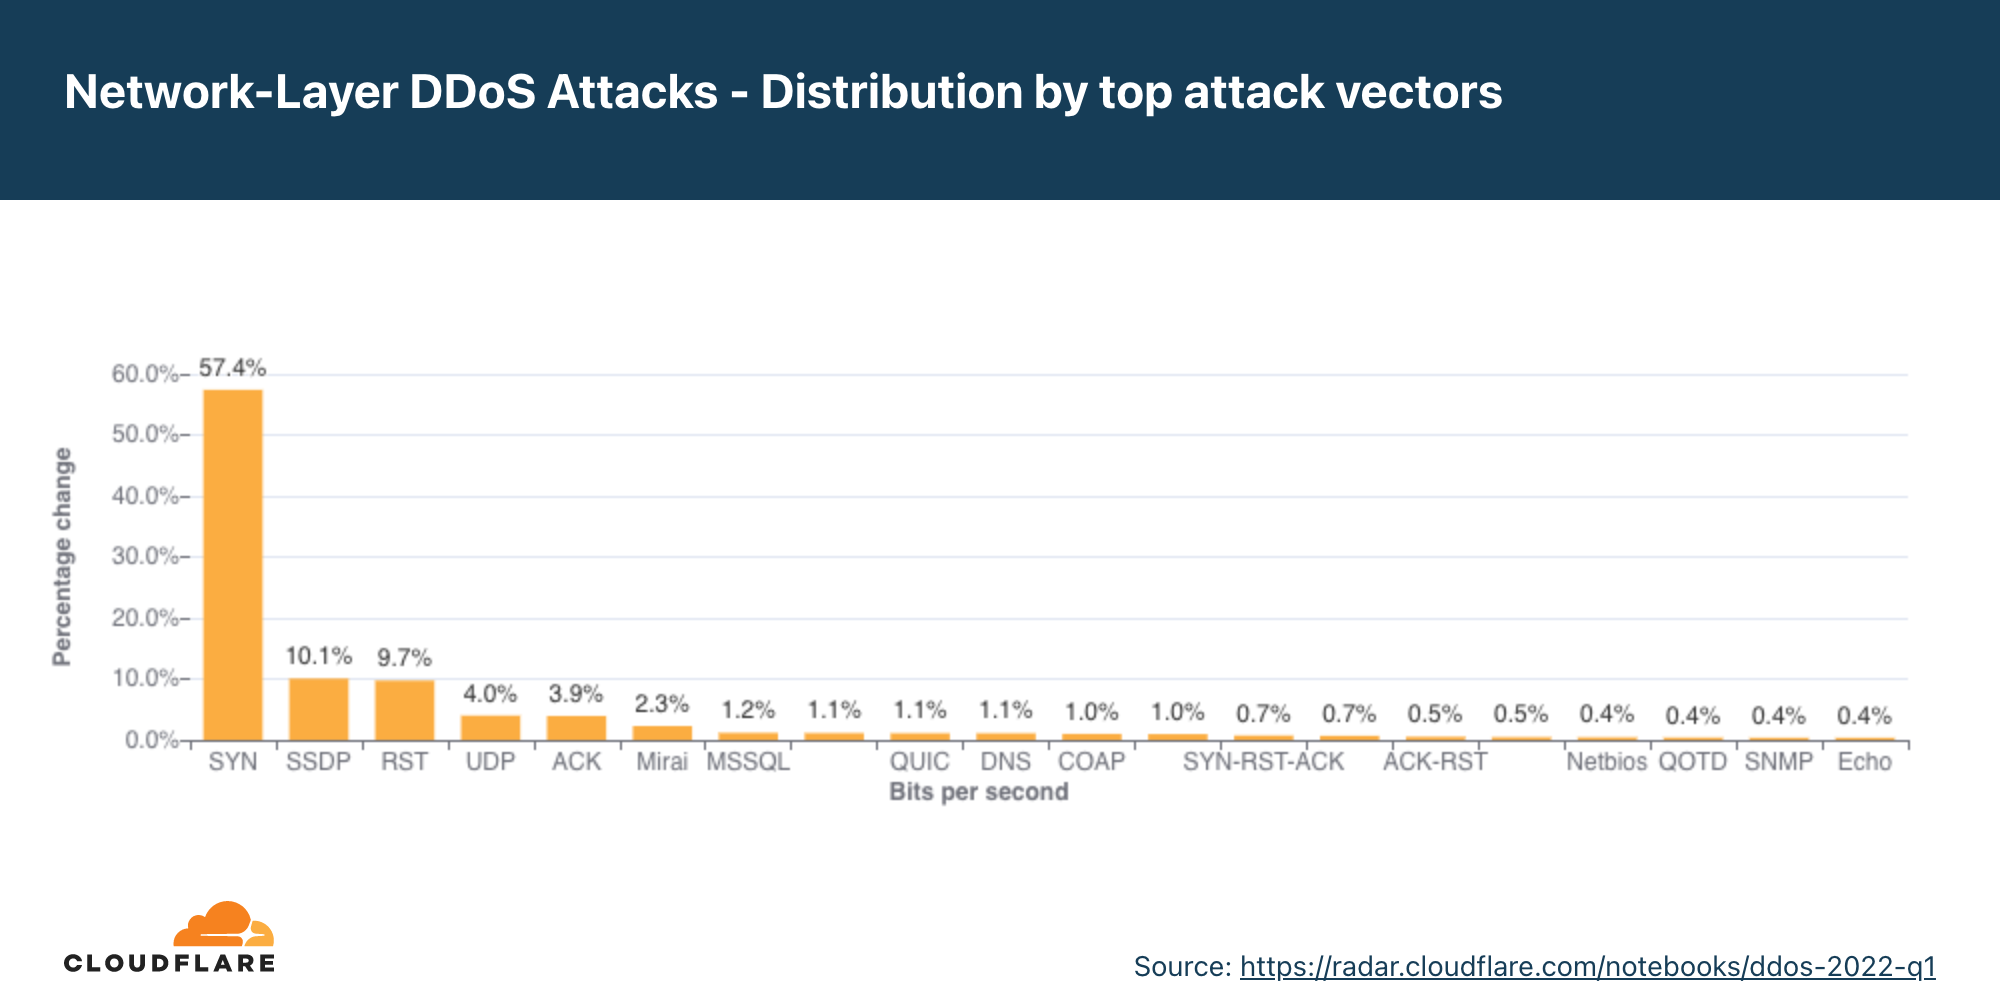
SYN Floods remain the most popular DDoS attack vector, while use of generic UDP floods drops significantly in Q1.
An attack vector is a term used to describe the method that the attacker uses to launch their DDoS attack, i.e., the IP protocol, packet attributes such as TCP flags, flooding method, and other criteria.
In Q1, SYN floods accounted for 57% of all network-layer DDoS attacks, representing a 69% increase QoQ and a 13% increase YoY. In second place, attacks over SSDP surged by over 1,100% QoQ. Following were RST floods and attacks over UDP. Last quarter, generic UDP floods took the second place, but this time, generic UDP DDoS attacks plummeted by 87% QoQ from 32% to a mere 3.9%.
Emerging threats
Identifying the top attack vectors helps organizations understand the threat landscape. In turn, this may help them improve their security posture to protect against those threats. Similarly, learning about new emerging threats that may not yet account for a significant portion of attacks, can help mitigate them before they become a significant force.
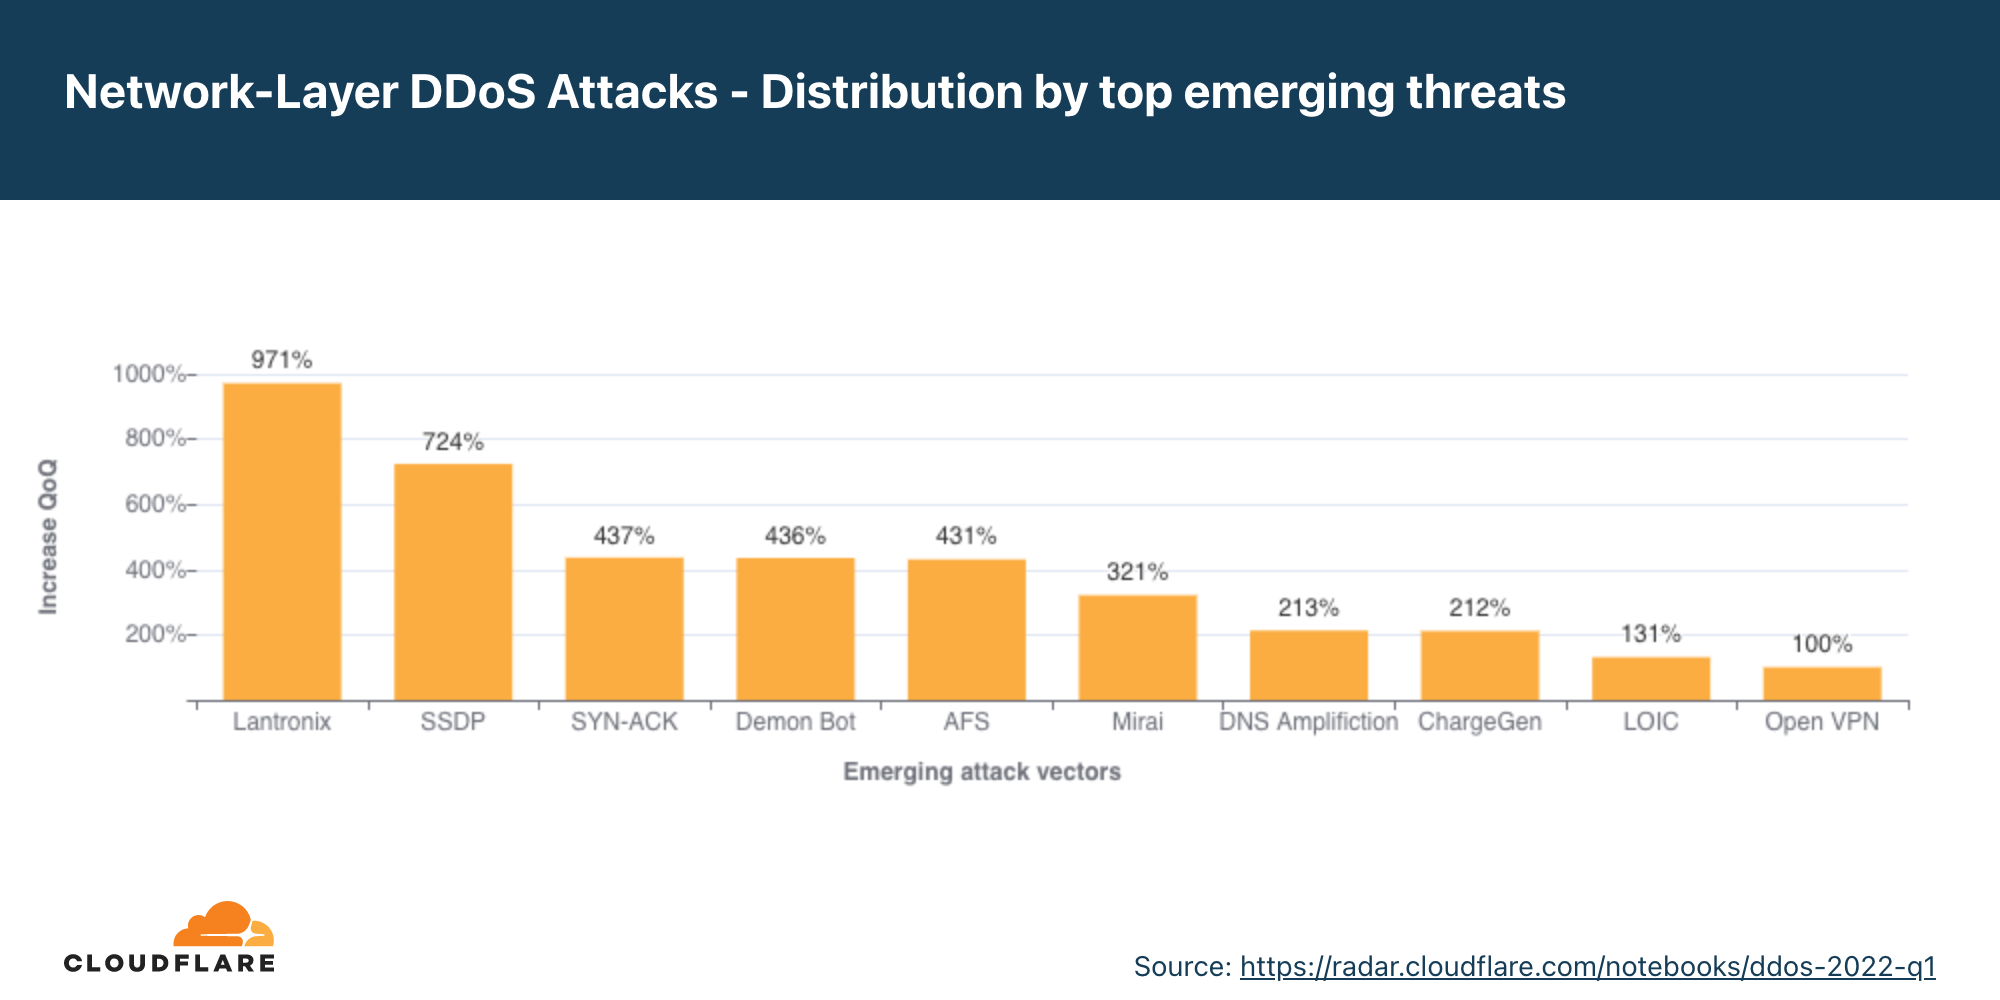
When we look at new emerging attack vectors in Q1, we can see increases in DDoS attacks reflecting off of Lantronix services (+971% QoQ) and SSDP reflection attacks (+724% QoQ). Additionally, SYN-ACK attacks increased by 437% and attacks by Mirai botnets by 321% QoQ.
Attacker reflecting traffic off of Lantronix Discovery Service
Lantronix is a US-based software and hardware company that provides solutions for Internet of Things (IoT) management amongst their vast offering. One of the tools that they provide to manage their IoT components is the Lantronix Discovery Protocol. It is a command-line tool that helps to search and find Lantronix devices. The discovery tool is UDP-based, meaning that no handshake is required. The source IP can be spoofed. So an attacker can use the tool to search for publicly exposed Lantronix devices using a 4 byte request, which will then in turn respond with a 30 byte response from port 30718. By spoofing the source IP of the victim, all Lantronix devices will target their responses to the victim — resulting in a reflection/amplification attack.
Simple Service Discovery Protocol used for reflection DDoS attacks
The Simple Service Discovery Protocol (SSDP) protocol works similarly to the Lantronix Discovery protocol, but for Universal Plug and Play (UPnP) devices such as network-connected printers. By abusing the SSDP protocol, attackers can generate a reflection-based DDoS attack overwhelming the target’s infrastructure and taking their Internet properties offline. You can read more about SSDP-based DDoS attacks here.
Network-layer DDoS attacks by attack rate
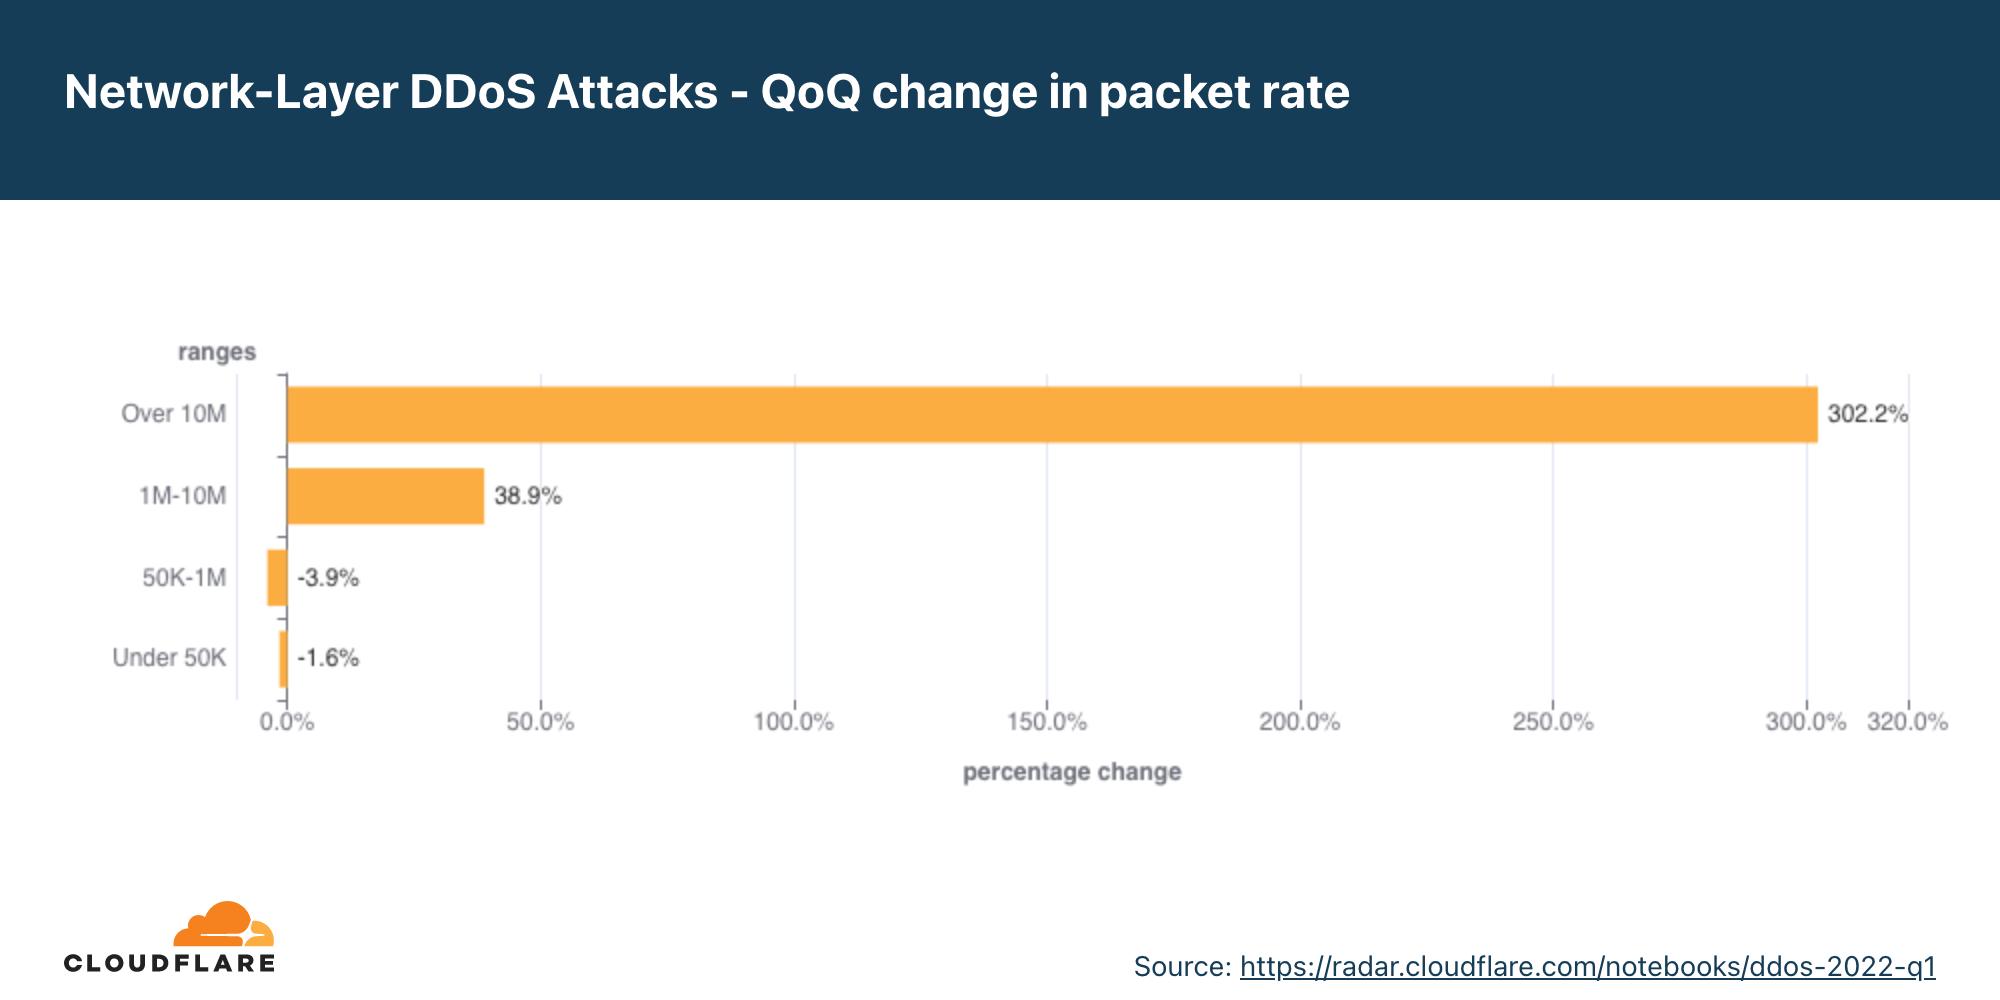
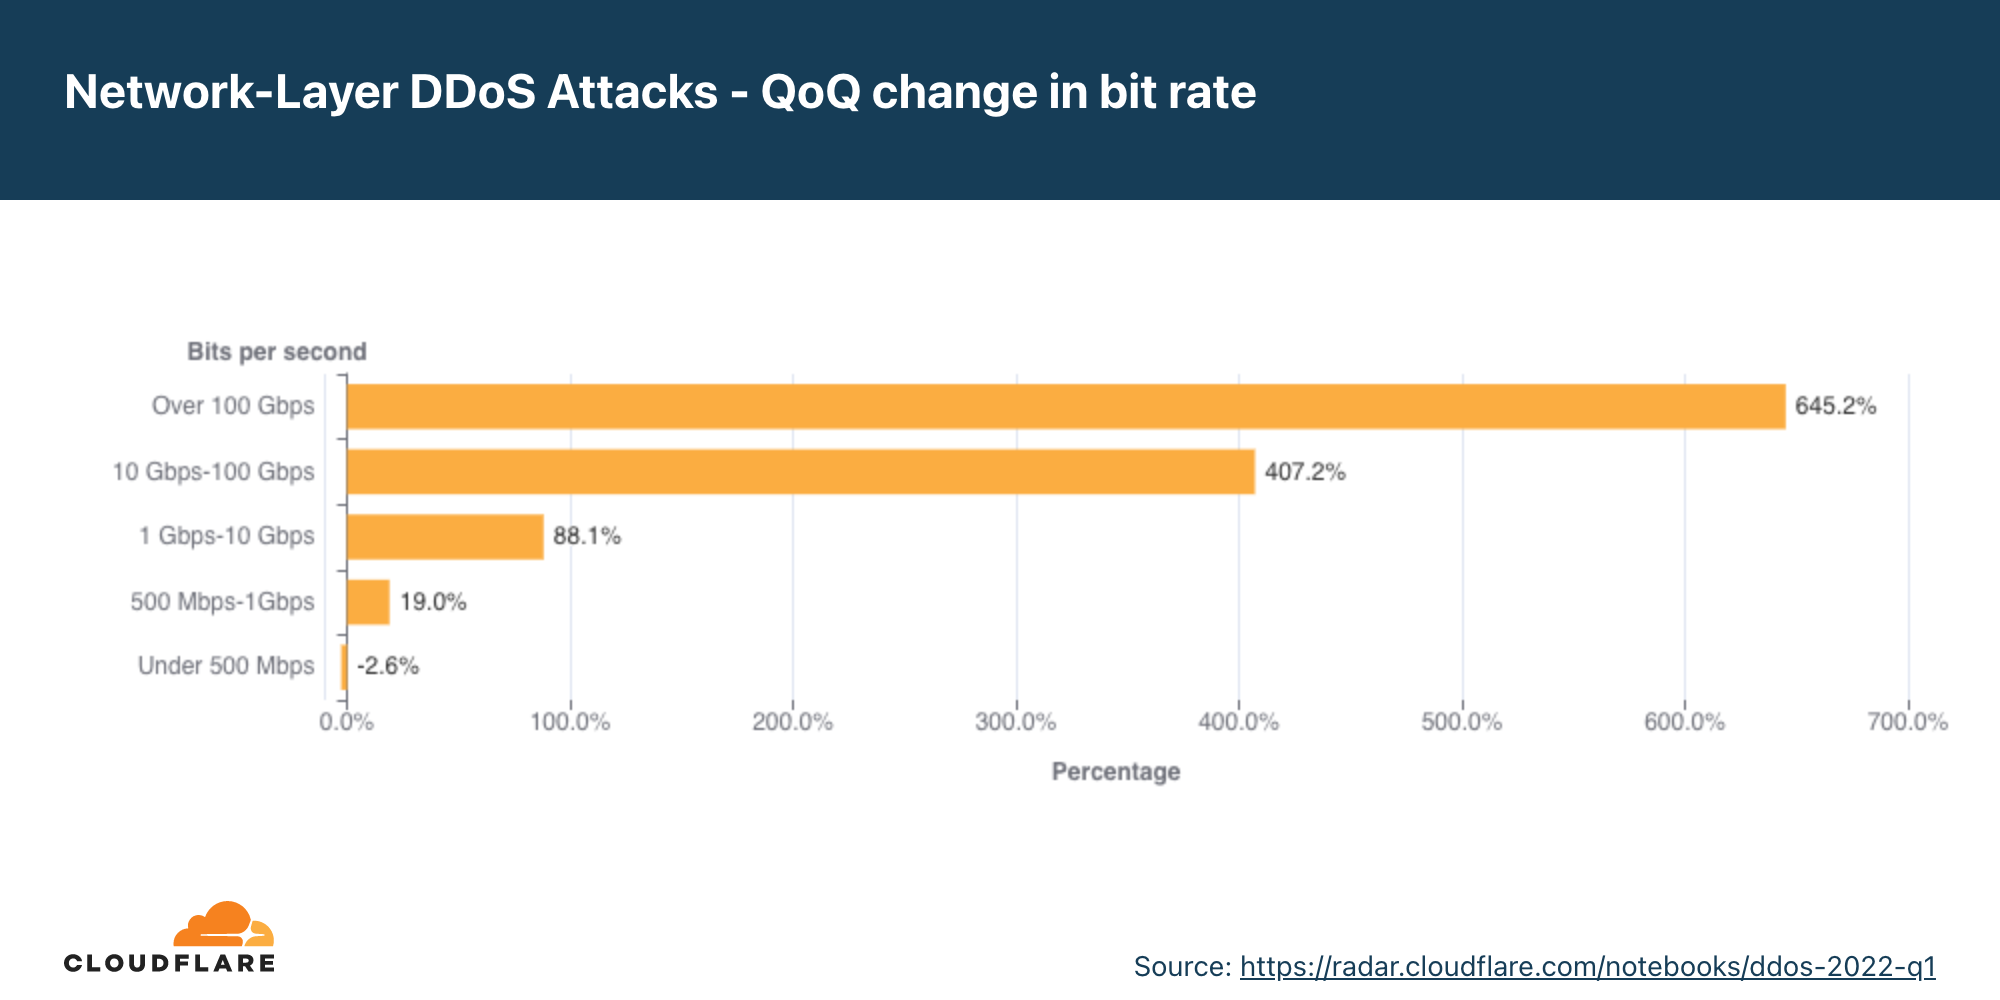
In Q1, we observed a massive uptick in volumetric DDoS attacks — both from the packet rate and bitrate perspective. Attacks over 10 Mpps grew by over 300% QoQ, and attacks over 100 Gbps grew by 645% QoQ.
There are different ways of measuring the size of an L3/4 DDoS attack. One is the volume of traffic it delivers, measured as the bit rate (specifically, terabits per second or gigabits per second). Another is the number of packets it delivers, measured as the packet rate (specifically, millions of packets per second).
Attacks with high bit rates attempt to cause a denial-of-service event by clogging the Internet link, while attacks with high packet rates attempt to overwhelm the servers, routers, or other in-line hardware appliances. These devices dedicate a certain amount of memory and computation power to process each packet. Therefore, by bombarding it with many packets, the appliance can be left with no further processing resources. In such a case, packets are “dropped,” i.e., the appliance is unable to process them. For users, this results in service disruptions and denial of service.
Distribution by packet rate
The majority of network-layer DDoS attacks remain below 50,000 packets per second. While 50 kpps is on the lower side of the spectrum at Cloudflare scale, it can still easily take down unprotected Internet properties and congest even a standard Gigabit Ethernet connection.
When we look at the changes in the attack sizes, we can see that attacks of over 10 Mpps grew by over 300% QoQ. Similarly, attacks of 1-10 Mpps grew by almost 40% QoQ.
Distribution by bitrate
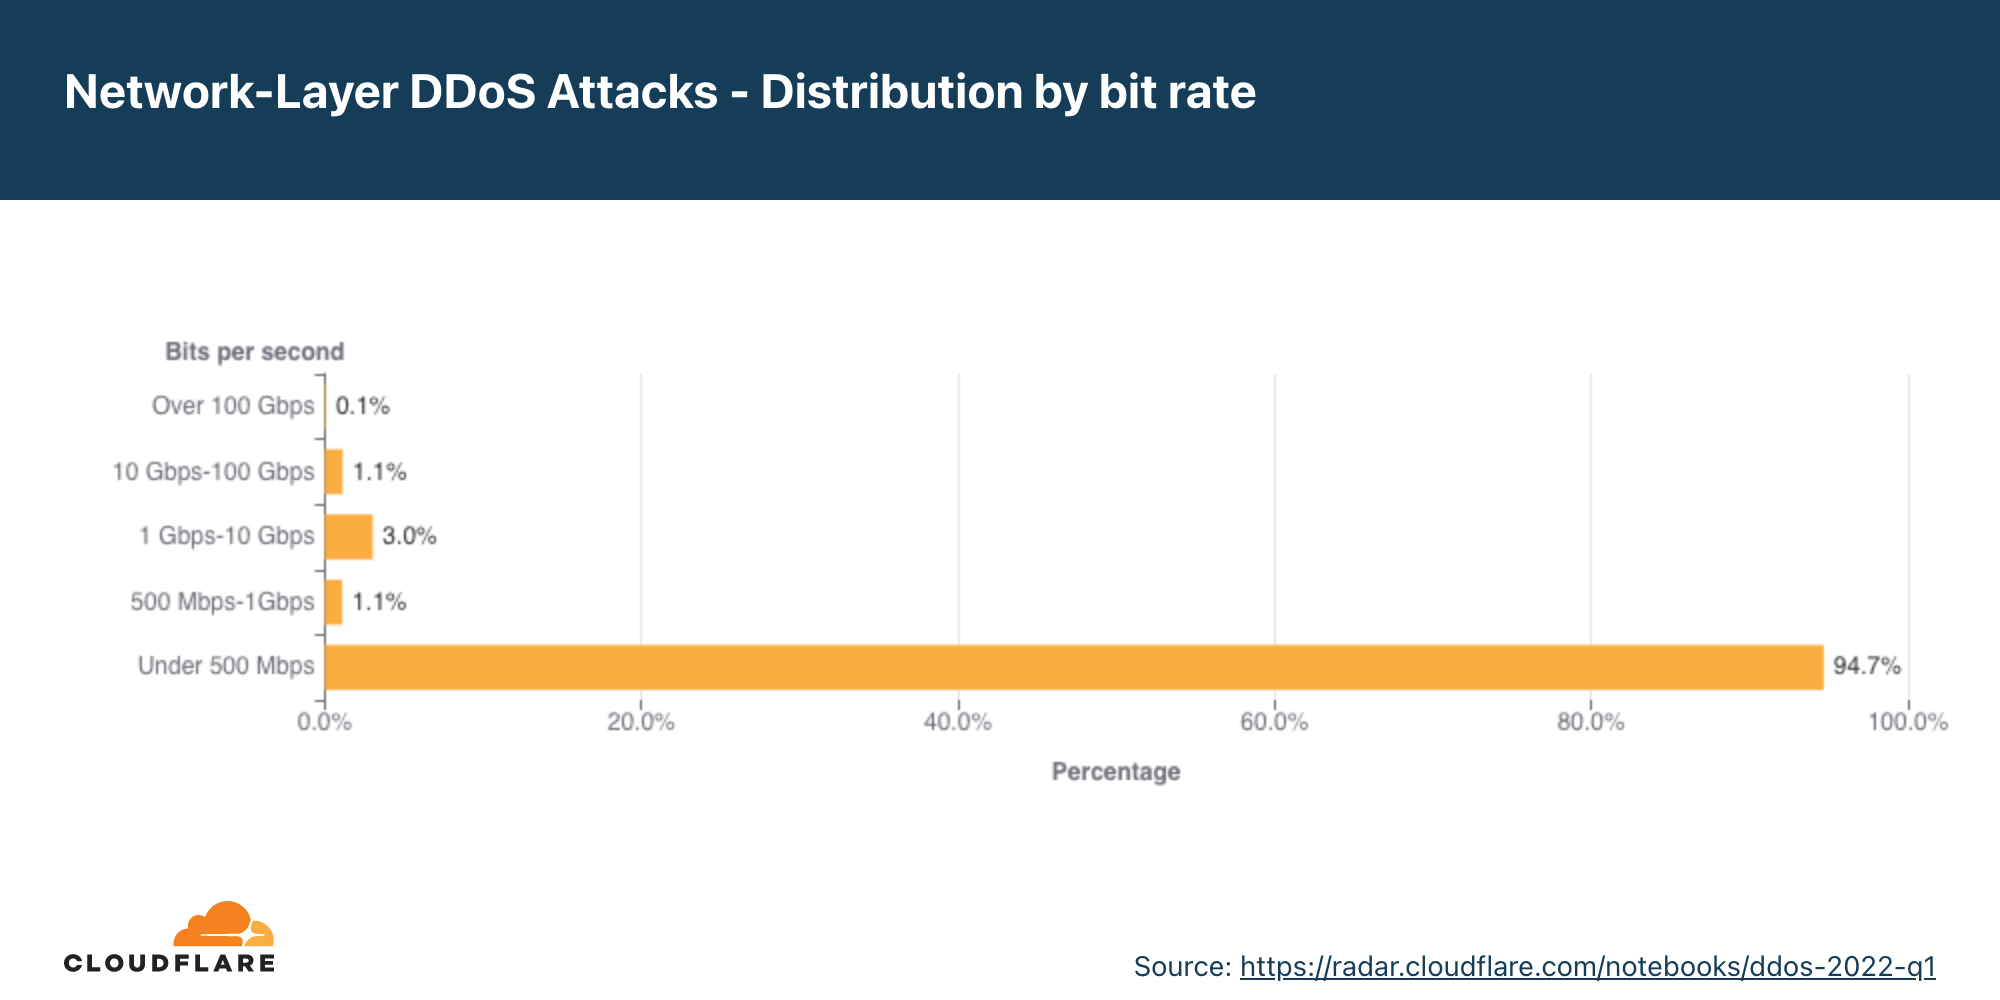
In Q1, most of the network-layer DDoS attacks remain below 500 Mbps. This too is a tiny drop in the water at Cloudflare scale, but can very quickly shut down unprotected Internet properties with less capacity or at the very least congest, even a standard Gigabit Ethernet connection.
Graph of the distribution of network-layer DDoS attacks by bit rate in 2022 Q1
Similarly to the trends observed in the packet-per-second realm, here we can also see large increases. The amount of DDoS attacks that peaked over 100 Gbps increased by 645% QoQ; attacks peaking between 10 Gbps to 100 Gbps increased by 407%; attacks peaking between 1 Gbps to 10 Gbps increased by 88%; and even attacks peaking between 500 Mbps to 1 Gbps increased by almost 20% QoQ.
Network-layer DDoS attacks by duration
Most attacks remain under one hour in duration, reiterating the need for automated always-on DDoS mitigation solutions.
We measure the duration of an attack by recording the difference between when it is first detected by our systems as an attack and the last packet we see with that attack signature towards that specific target.
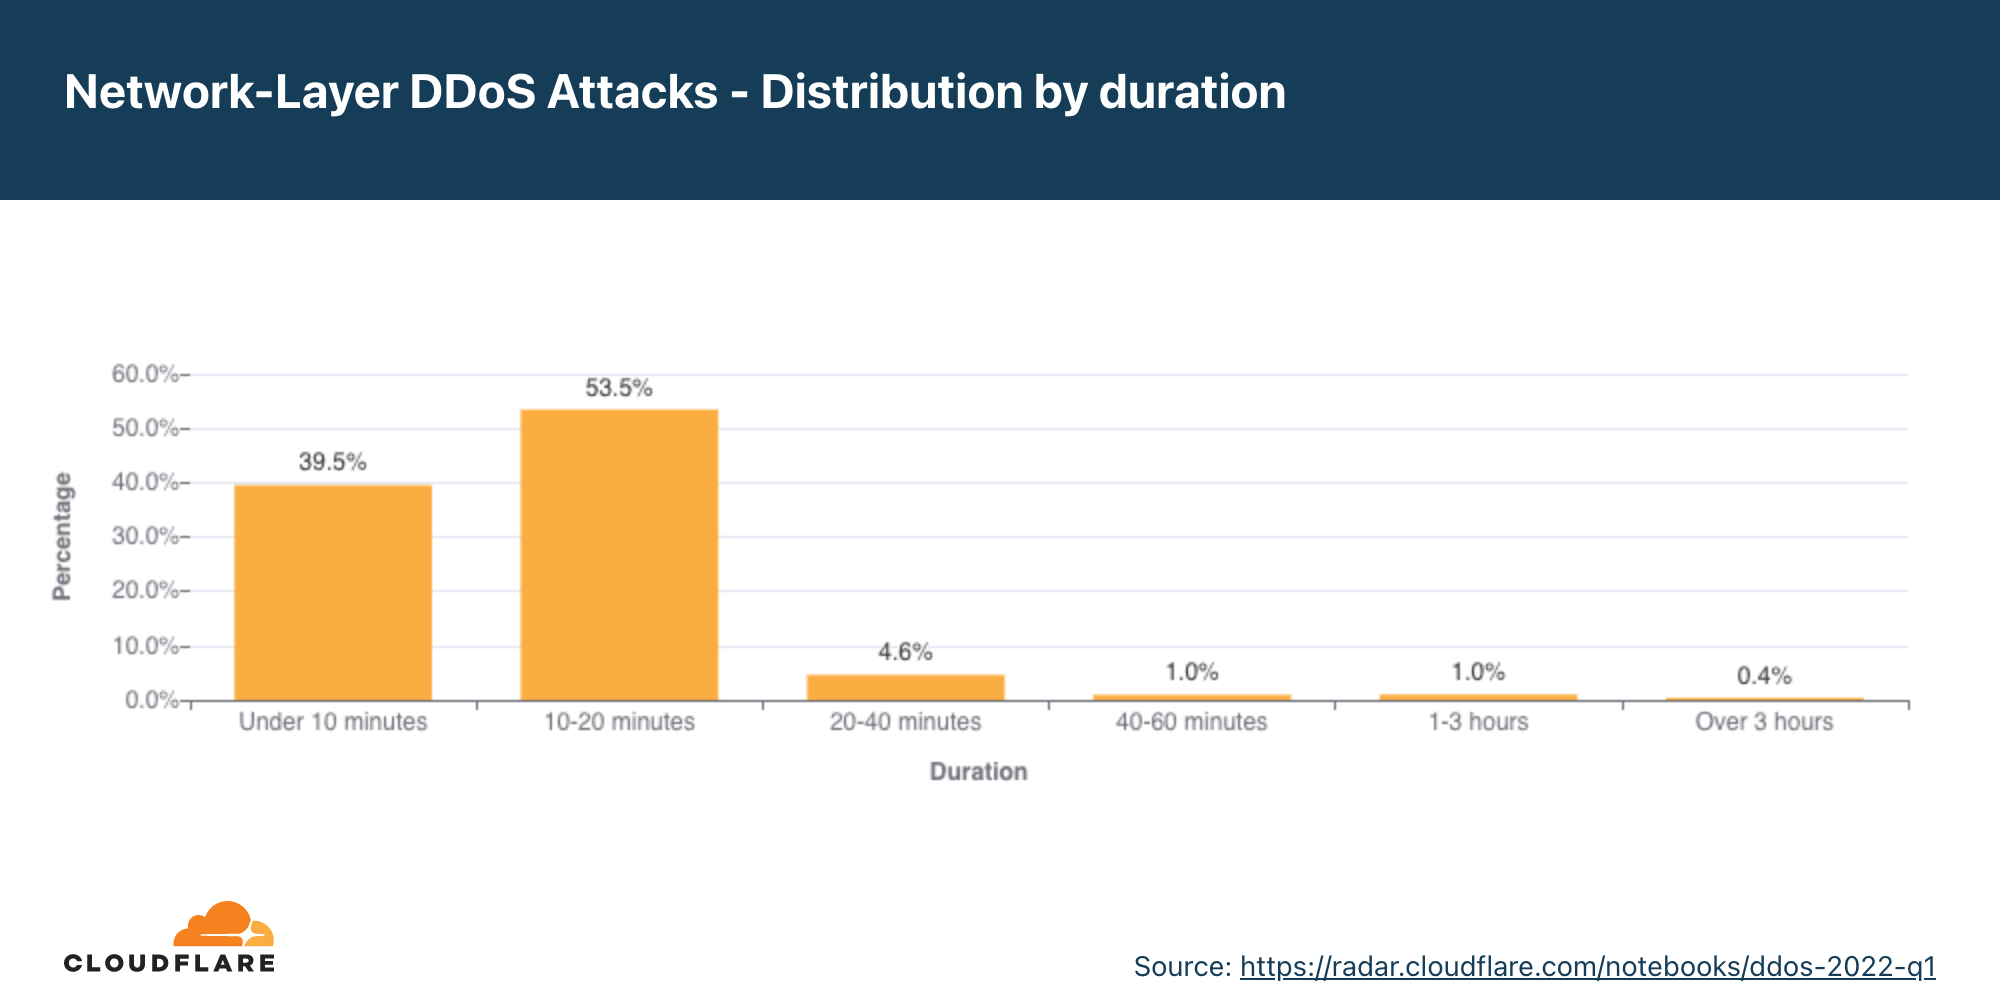
In previous reports, we provided a breakdown of ‘attacks under an hour’, and larger time ranges. However, in most cases over 90 percent of attacks last less than an hour. So starting from this report, we broke down the short attacks and grouped them by shorter time ranges to provide better granularity.
One important thing to keep in mind is that even if an attack lasts only a few minutes, if it is successful, the repercussions could last well beyond the initial attack duration. IT personnel responding to a successful attack may spend hours and even days restoring their services.
In the first quarter of 2022, more than half of the attacks lasted 10-20 minutes, approximately 40% ended within 10 minutes, another ~5% lasted 20-40 minutes, and the remaining lasted longer than 40 minutes.
Short attacks can easily go undetected, especially burst attacks that, within seconds, bombard a target with a significant number of packets, bytes, or requests. In this case, DDoS protection services that rely on manual mitigation by security analysis have no chance in mitigating the attack in time. They can only learn from it in their post-attack analysis, then deploy a new rule that filters the attack fingerprint and hope to catch it next time. Similarly, using an “on-demand” service, where the security team will redirect traffic to a DDoS provider during the attack, is also inefficient because the attack will already be over before the traffic routes to the on-demand DDoS provider.
It’s recommended that companies use automated, always-on DDoS protection services that analyze traffic and apply real-time fingerprinting fast enough to block short-lived attacks.
Summary
Cloudflare’s mission is to help build a better Internet. A better Internet is one that is more secure, faster, and reliable for everyone — even in the face of DDoS attacks. As part of our mission, since 2017, we’ve been providing unmetered and unlimited DDoS protection for free to all of our customers. Over the years, it has become increasingly easier for attackers to launch DDoS attacks. But as easy as it has become, we want to make sure that it is even easier — and free — for organizations of all sizes to protect themselves against DDoS attacks of all types.
Not using Cloudflare yet? Start now with our Free and Pro plans to protect your websites, or contact us for comprehensive DDoS protection for your entire network using Magic Transit.
This month, the Cisco Umbrella team – in conjunction with Talos – has witnessed the rise of complex cyberattacks. In today’s edition of the Cybersecurity Threat Spotlight, we unpack the tactics, techniques, and procedures used in these attacks.
Want to see how Cisco Umbrella can protect your network? Sign up for a free trial today!
BlackCat Ransomware
Threat Type: Ransomware
Attack Chain:
Description: BlackCat – also known as “ALPHV”- is a ransomware which uses ransomware-as-a-service model and double ransom schema (encrypted files and stolen file disclosure). It first appeared in November 2021 and, since then, targeted companies have been hit across the globe.
BlackCat Spotlight: BlackCat ransomware has quickly gained notoriety for being used in double ransom (encrypted files and stolen file disclosure) attacks against companies. While it targets companies across the globe, more than 30% of the compromises happened to companies based in the U.S.
There is a connection between the BlackCat, BlackMatter and DarkSide ransomware groups, recently confirmed by the BlackCat representative. Attack kill chain follows the blueprint of other human-operated ransomware attacks: initial compromise, followed by an exploration and data exfiltration phase, then attack preparation and finally, the ransomware execution. The key aspect of such attacks is that adversaries take time exploring the environment and preparing it for a successful and broad attack before launching the ransomware. Some of the attacks took up to two weeks from the initial to final stage, so it is key to have capabilities to detect such activities to counter them.
Target Geolocations: U.S., Canada, EU, China, India, Philippines, Australia Target Data: Sensitive Information, Browser Information Target Businesses: Any Exploits: N/A
Mitre ATT&CK for BlackCat
Initial Access: Valid Accounts: Local Accounts
Discovery: Account Discovery System Information Discovery Network Service Discovery File and Directory Discovery Security Software Discovery ADrecon Sofperfect Network Scanner
Which Cisco Products Can Block: Cisco Secure Endpoint Cisco Secure Firewall/Secure IPS Cisco Secure Malware Analytics Cisco Umbrella
ZingoStealer
Threat Type: Information Stealer
Attack Chain:
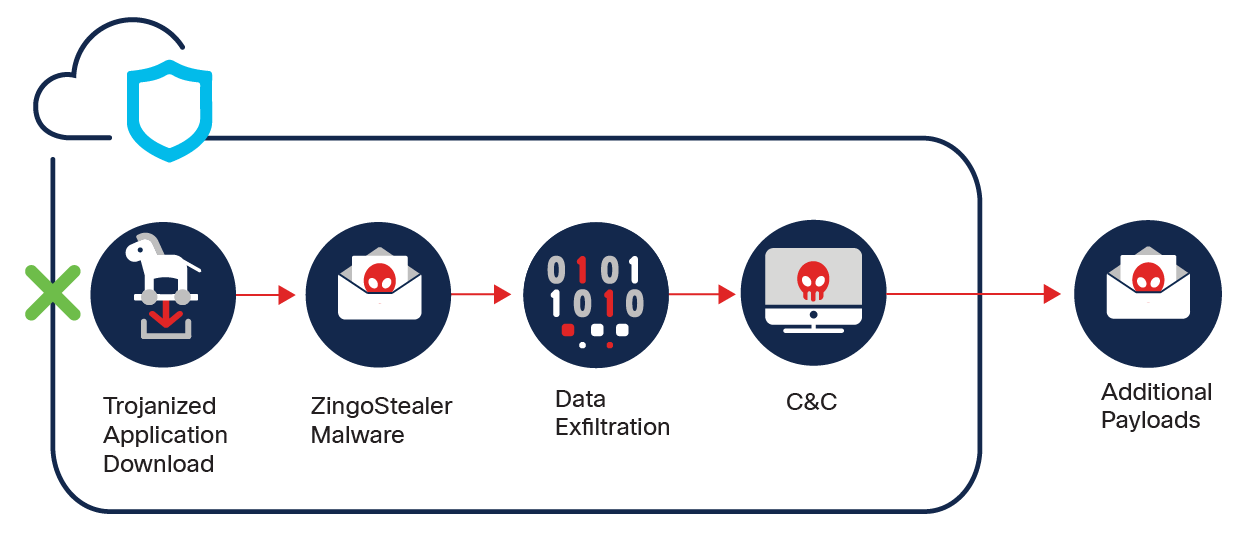
Description: ZingoStealer is an information stealer released by a threat actor known as “Haskers Gang.” The malware leverages Telegram chat features to facilitate malware executable build delivery and data exfiltration. The malware can exfiltrate sensitive information like credentials, steal cryptocurrency wallet information, and mine cryptocurrency on victims’ systems. ZingoStealer has the ability to download additional malware such as RedLine Stealer and the XMRig cryptocurrency mining malware.
ZingoStealer Spotlight: Cisco Talos recently observed a new information stealer, called “ZingoStealer” that has been released for free by a threat actor known as “Haskers Gang.” This information stealer, first introduced to the wild in March 2022, is currently undergoing active development and multiple releases of new versions have been observed recently. In many cases, ZingoStealer is being distributed under the guise of game cheats, cracks and code generators.
The stealer is an obfuscated .NET executable which downloads files providing core functionality an attacker-controlled server. The malware can exfiltrate sensitive information like credentials, steal cryptocurrency wallet information, and mine cryptocurrency on victims’ systems. The malware is also used as a loader for other malware payloads, such as RedLine Stealer and the XMRig cryptocurrency mining malware.
Target Geolocations: CIS Target Data: User Credentials, Browser Data, Financial and Personal Information, Cryptocurrency Wallets, Data From Browser Extensions Target Businesses: Any Exploits: N/A
Mitre ATT&CK for ZingoStealer
Initial Access: Trojanized Applications
Credential Access: Credentials from Password Stores Steal Web Session Cookie Unsecured Credentials Credentials from Password Stores: Credentials from Web Browsers
Discovery: Account Discovery Software Discovery Process Discovery System Time Discovery System Service Discovery System Location Discovery
Persistence: Registry Run Keys/Startup Folder Scheduled Task/Job: Scheduled Task
Privilege Escalation: N/A
Execution: User Execution Command and Scripting Interpreter: PowerShell
Evasion: Obfuscated Files or Information
Collection: Archive Collected Data: Archive via Utility Data Staged: Local Data Staging
Command and Control: Application Layer Protocol: Web Protocols
Which Cisco Products Can Block: Cisco Secure Endpoint Cisco Secure Email Cisco Secure Firewall/Secure IPS Cisco Secure Malware Analytics Cisco Umbrella Cisco Secure Web Appliance
BumbleBee Loader
Threat Type: Loader
Attack Chain:
Description: BumbleBee is a loader that has anti-virtualization checks and loader capabilities. The goal of the malware is to take a foothold in the compromised system to download and execute additional payloads. BumbleBee was observed to load Cobalt Strike, shellcode, Sliver and Meterpreter malware.
BumbleBee Spotlight: Security researchers noticed the appearance of the new malware being used by Initial Access Brokers, which previously relied on BazaLoader and IcedID malware. Dubbed BumbleBee due to presence of unique User-Agent “bumblebee” in early campaigns, this malware appears to be in active development.
It already employs complex anti-virtualization techniques, as well as uses asynchronous procedure call (APC) injection to launch the shellcode and LOLBins to avoid detections. Delivery chain relies on user interaction to follow the links and open malicious ISO or IMG file. Loader achieves persistence via scheduled task which launches Visual Basic Script to load BumbleBee DLL. Afterwards, the execution malware communicates with the Command-and-Control server and downloads additional payloads such as Cobalt Strike, shellcode, Sliver and Meterpreter. Threat actors using such payloads have been linked to ransomware campaigns.
Target Geolocations: Canada, U.S., Japan Target Data: N/A Target Businesses: Any Exploits: N/A
Mitre ATT&CK for BumbleBee
Initial Access: Malspam
Persistence: Scheduled Task/Job
Execution: Scheduled Task/Job: Scheduled Task Command and Scripting Interpreter: Virtual Basic User Execution: Malicious File
Evasion: System Binary Proxy Execution: Rundll32 Virtualization/Sandbox Evasion: System Checks Process Injection: Asynchronous Procedure Call
Discovery: System Information Discovery System Network Configuration Discovery System Network Connections Discovery


![Graph of the yearly distribution of network-layer DDoS attacks by month in the past 12 months]](https://blog.cloudflare.com/content/images/2022/04/image28.png)