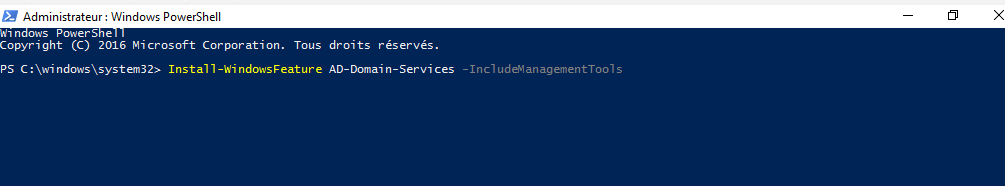
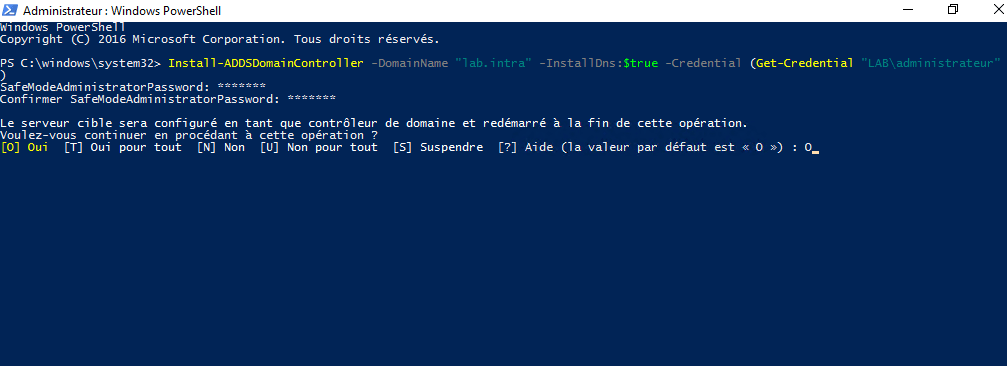
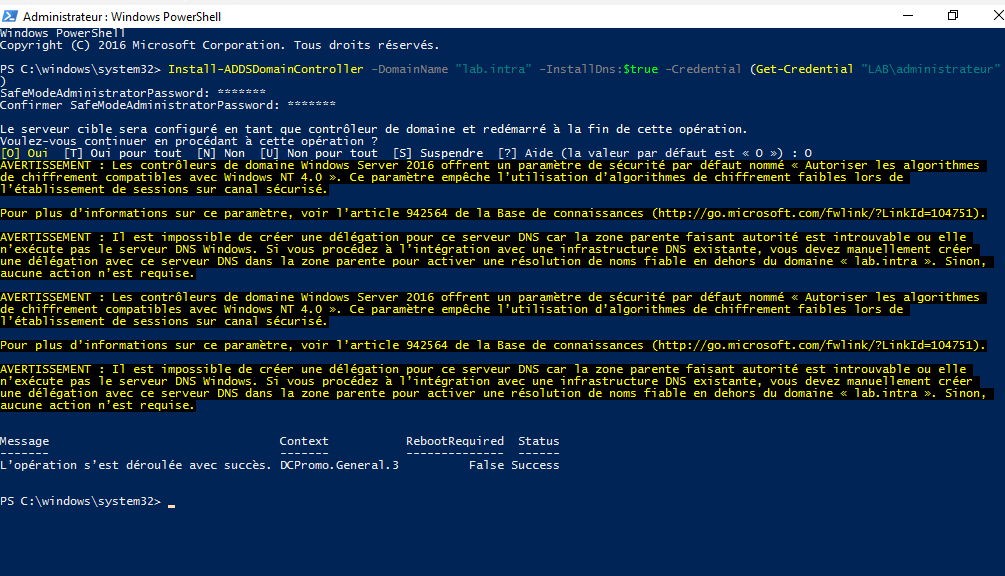
Enter the password of the account passed as a parameter in the login window, then in the Powershell console enter the password of the directory recovery mode and confirm the promotion as a domain controller.
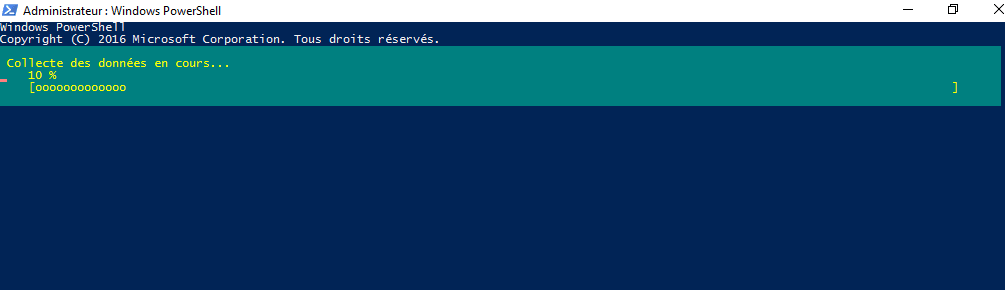
Wait during the promotion operation ….
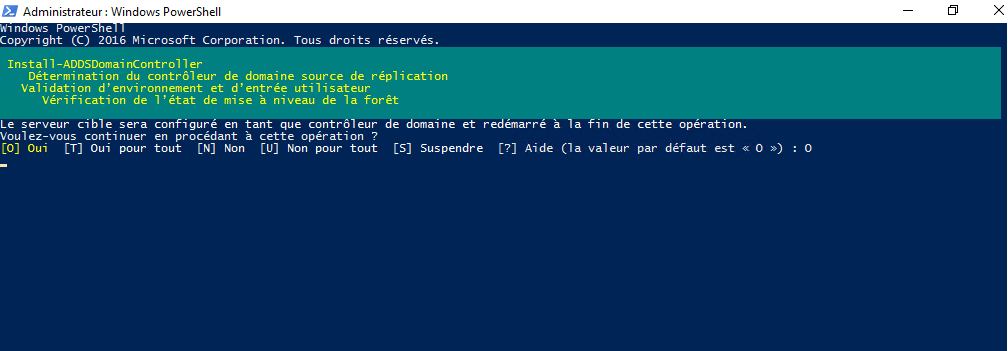
After the operation completes, the following message appears and the server restarts.
At reboot the server is domain control.
Complements
There are 3 different Powershell commands that allow promotion as a domain control. Each of the commands is to be used in a particular case:
Install-ADDSForest : which is used for creating a new Active Directory forest.
It renames a computer name to a specified new name.
Syntax:
Rename-Computer
[-ComputerName <String>]
[-PassThru]
[-DomainCredential <PSCredential>]
[-LocalCredential <PSCredential>]
[-NewName]<String>
[-Force]
[-Restart]
[-WsmanAuthentication <String>]
[-WhatIf]
[-Confirm]
[<CommonParameters>]
Parameters:
-ComputerName
Parameter renames the remote computer in PowerShell. The default is the local computer.
To rename a remote computer, specify the IP address, the domain name of the remote computer, or the NetBIOS name.
To specify the local computer name, use localhost, dot (.).
-NewName
It specifies a new name for a computer. This parameter is mandatory to rename a computer. The name may contain alphanumeric, hyphens (-).
-Restart
It specifies restart is required after the computer is renamed. Restart is required to reflect the changes.
-DomainCredential
It specifies a user account that has permission to connect to a remote computer in the domain and renames a computer joined in the domain with explicit credentials.
Use Domain\User or use the Get-Credential cmdlet to get user credentials.
-Force
The Force parameter forces the command to execute without user confirmation.
Let’s understand rename-computer cmdlet in PowerShell with examples.
Rename a Local Computer
To rename a local computer, use the rename-computer cmdlet in PowerShell as below
Rename-Computer -NewName “IN-CORP101” -Restart
In the above PowerShell, rename-computer renames a local computer name to IN-CORP101 specified by the NewName parameter. It will restart the local computer to reflect the change after the computer rename.
Rename a Remote computer
To rename a remote computer, use rename-computer cmdlet in PowerShell as below
In the above PowerShell script, rename-computer cmdlet renames a remote computer name. ComputerName parameter specify remote computer name and NewName parameter specify a new name for the computer.
After the computer is renamed, the remote computer will restart to reflect changes.
PowerShell Rename a Computer on Domain
To rename a computer on the domain, the user must have permission to connect to the domain. For explicit credentials, use Get-Credential cmdlet in PowerShell.
Let’s rename the computer on the domain using the rename-computer cmdlet in PowerShell.
In the above PowerShell script, Rename-Computer cmdlet renames a remote computer joined on a domain.
ComputerName specifies the remote computer name, NewName parameter specifies a new name for the computer.
DomainCredential parameter specify domain user ShellGeek\Admin who has permission to connect to the domain computer and rename a computer on the domain.
Conclusion
I hope the above article to rename a computer in PowerShell will help you to rename a local computer or remote computer.
Rename-Computer cmdlet in PowerShell doesn’t have a parameter that takes the input value and returns ComputerChangeInfo an object if you specify -PassThru a parameter else return does not return any value.
You can find more topics about PowerShell Active Directory commands and PowerShell basics on the ShellGeek home page.CategoriesPowerShell TipsTagsrename-computer
In a large organization, its very quite common to have many domain and child domain names. While performing task automation for set of computers in domain, its best practice to get domain name of a computer.
In this article, I will explain how to get domain name using PowerShell script and command line (CMD)
Get-WmiObject class in PowerShell management library find the domain name for computer and wmic command-line utility to get domain name using command line (cmd)
Let’s understand how to get domain name in PowerShell and command line with below examples.
In the above PowerShell script, Get-WmiObject gets the WMI classes in the root\cimv2 namespace of computer and uses Win32_ComputerSystem to get computer system information.
Second command select Name and Domain name of a computer.
Output of above command to get domain name of a computer as below
PowerShell Get Domain Name
Using Get-AdDomainController to get domain name
PowerShell Get-AdDomainController cmdlet in Active Directory get one or more domain controllers based on search criteria.
You can get domain name of a computer in active directory using PowerShell Get-AdDomainController cmdlet as below
In this guide, I’ll show you how to deploy the open source time tracking app Kimai in a Docker container. Kimai is free, browser-based (so it’ll work on mobile devices), and is extremely flexible for just about every use case.
It has a stopwatch feature where you can start/stop/pause a worklog timer. Then, it accumulates the total into daily, weekly, monthly or yearly reports, which can be exported or printed as invoices.
It supports single or multi users, so you can even track time for your entire department. All statistics are visible on a beautiful dashboard, which makes historical time-tracking a breeze.
Why use Kimai Time Tracker?
For my scenario, I am salaried at work. However, since I’m an IT Manager, I often find myself working after hours or on weekends to patch servers, reboot systems, or perform system and infrastructure upgrades. Normally, I use a pen and paper or a notetaking app to track overtime, although this is pretty inefficent. Sometimes I forget when I started or stopped, or if I’ve written down the time on a notepade at home, I can’t view that time at work.
And when it comes to managing a team of others who also perform after hours maintenance, it becomes even harder to track their total overtime hours.
Over the past few weeks, I stumbled across Kimai and really love all the features. Especially when I can spin it up in a docker or docker compose container!
In this tutorial, we will be installing Kimai for 1 user using standard Docker run commands. Other users can be added from the webui after initial setup.
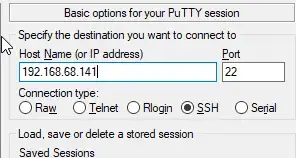
Step 1: SSH into your Docker Host
Open Putty and SSH into your server that is running docker and docker compose.
Step 2: Create Kimai Database container
Enter the command below to create a new database to use with Kimai. You can copy and paste into Putty by right-clicking after copy, or CTRL+SHIFT+V into other ssh clients.
Next, start the Kimai container using the already created database. If you look at the Kimai github page, you’ll notice that this isn’t the same command as what shows there.
Here’s the original command (which I’m not using):
And here’s my command. I had to explicitly add TRUSTED_HOSTS, the ADMINMAIL and ADMINPASS, and change the ${HOSTNAME} to the IP address of your docker host. Otherwise, I wasn’t able to access Kimai from other computers on my local network.
Green = change port here if already in use
Red = Add the IP address of your docker host
Orange = Manually specifying the admin email and password. This is what you’ll use to log in with.
Note that 8 characters is the minimum for the password.
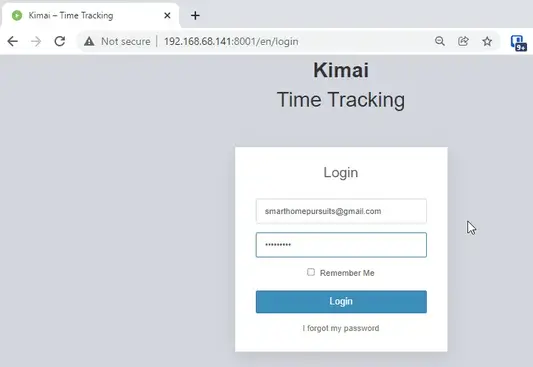
Step 4: Log In via Web Browser
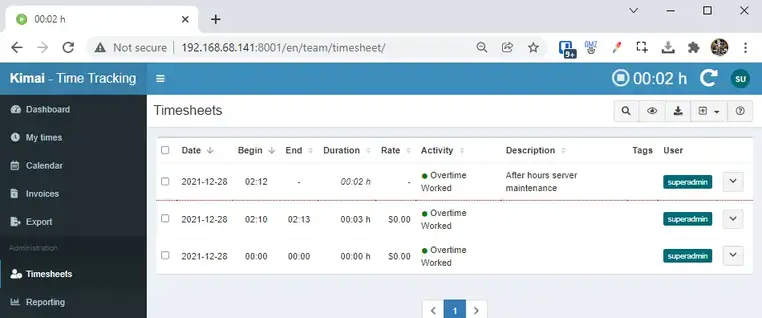
Next, Kimai should now be running!
To check, you can go to your http://dockerIP:8001 in a web browser (192.168.68.141:8001)
Then simply log in with the credentials you created.
Step 5: Basic Setup
This app is extremely powerful and customizeable, so I won’t be going over all the available options since everyone has different needs.
Like I mentioned earlier, I’m using Kimai for overtime tracking only, so the first step for me is to create a new “customer”.
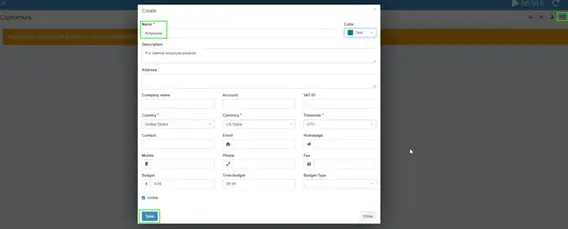
Create a Customer
This is sort of unintuitive, but you need to create a customer before you can start tracking time to a project. I’m creating a generic “Employee” customer.
Click Customers on the left sidebar, then click the + button in the top right corner.
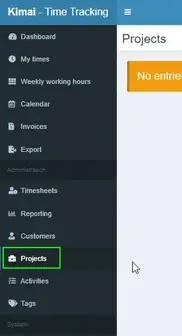
Create A Project
Click Projects on the left sidebar:
Then click the + button in the top right corner.
Add a name, choose the customer you just created, and then choose a date range.
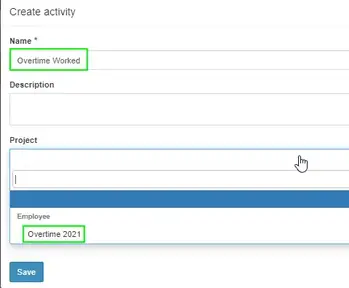
Create An Activity
Click Activity on the left, then create an activity. I’m calling mine Overtime Worked and assigning it to the Project “Overtime 2021” I just created.
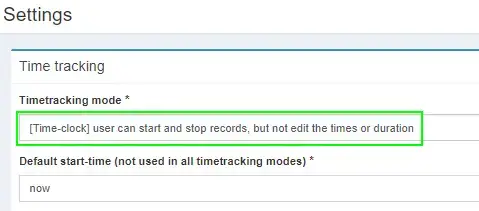
Step 6: Change “Timetracking Mode” to Time-clock
Click Settings. Under Timetracking mode, change it to Time-Clock. This will let you click the Play button to start/stop time worked vs having to manually enter start and stop times.
Step 7: Start Tracking Time!
To start tracking time, simply click the timer widget in the top right corner.
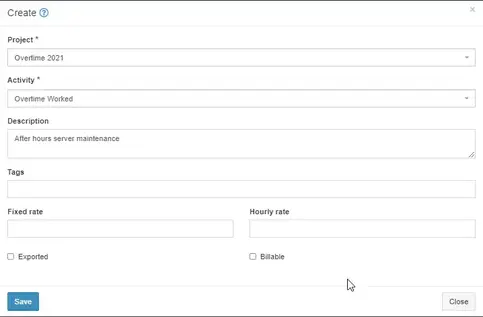
A screen will pop up asking you what project and activity you want to apply the time to.
The selfhosted stopwatch will start tracking time right after. You can then view the timesheets for yourself under the My Times section or for all users under the Timesheets or Reporting tabs.
Wrapping Up
Hopefully this guide helped you get Kimai installed and setup! If you have any questions, feel free to let me know in the comments below and I’ll do my best to help you out.
My Homelab Equipment
Here is some of the gear I use in my Homelab. I highly recommend each of them.
In this guide, I’m going to show you how to make Google Chrome the default browser using Group Policy (GPO). This guide applies to Windows Server 2012,2016,2019, 2022 as well as Windows 8/10/11.
To do this, there are several steps you’ll need to do. It’s not as simple as just creating a GPO and applying it to a target computer.
This guide assumes you’ve already implemented Google Chrome Enterprise and are already managing Google Chrome browsers at an enterprise level. If not, follow step 1 first.
Step 1: (Optional) Import Google Chrome .ADMX Template Files
Extract it once download and expand the subfolder Configuration.
In the “adm” folder, find your language (en-US) and copy the chrome.adm file to your desktop.
In the admx folder, find your language again (en-US), and copy the chrome.adml file to your desktop.
Next, RDP to your Domain Controller. Copy those two extracted files to the desktop of your DC.
Browse to C:\Windows\PolicyDefinitions and drag the chrome.admx.
In C:\Windows\PolicyDefinitions\en-US\folder, drag the chrome.adml file.
Now that you’ve copied in the necessary Group Policy files to manage your Google Chrome browsers, install Chrome Enterprise from here.
I used PDQ Deploy to push this out to all computers, but for testing you can simply install it on your PC.
Step 2: Create a new Group Policy Object
Log into your Domain Controller and open Group Policy Management. Right-click Group Policy Objects > New. Give it a helpful name like “Chrome Default Browser”.
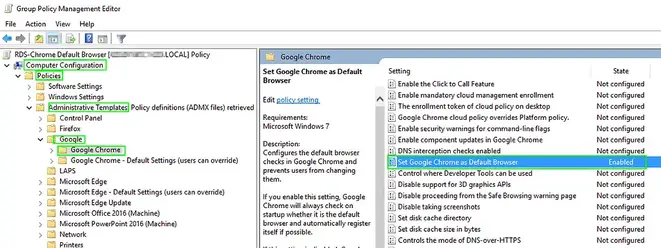
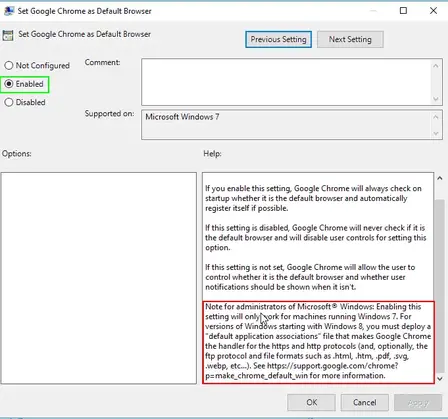
Right-click the new policy > Edit. Then expand Computer Configuration > Policies > Administrative Templates > Google > Google Chrome. Double-click that and switch to Enabled.
You’ll notice in the Help section of the GPO that this will only work for Windows 7. For Windows 8-10, you will need to define a file associates XML file.
Step 3: Deploy File Associations File
The next step is to download a “default file associations” sample file, place it on a network share, and then configure another group policy.
You can either place the file in a network share available by everyone. Or, you could also use Powershell or PDQ Deploy/SCCM to push this file to a certain location on everyone’s computer.
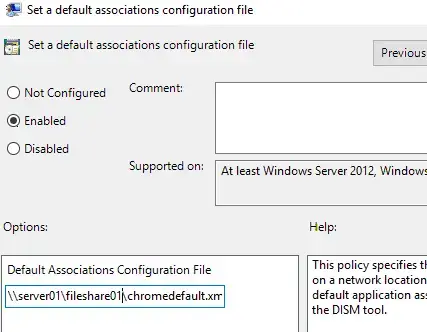
For this example, I put the file in a network share like this: \\server01\fileshare01\chromedefault.xml
Step 4: Edit Chrome Browser GPO to include path to XML
Next, open up Group Policy Management from your DC again. Edit your new “Chrome Default Browser” policy.
Navigate to Computer Configuration > Policies > Administrative Templates > Windows Components > File Explorer.
Locate the “Set a default associations configuration file” policy. Edit it, and use the path from step 3.
Click Apply and OK once complete.
Step 5: Update GPO and Test
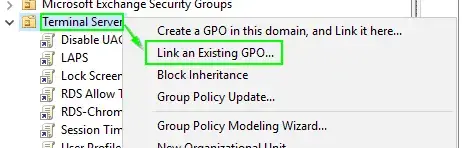
Next, you need to apply this GPO to a target OU or computer. I always recommend moving a test computer from Active Directory Users & Computers into a test OU to prevent breaking any production systems.
Locate the OU > right-click > Link an existing GPO > Choose the new “Chrome Default Browser” GPO.
Once the computer has been moved into the test OU, and you’ve applied the policy to that same OU, run the following command on the command to update the policy:
gpupdate /force
Then, sign out. The default browser will not be switched until after you log out.
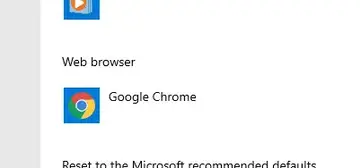
To confirm it’s working properly, search Windows for “Default Apps” on your computer and switch it to Edge. Then, sign out and sign back in. If all goes well – you can open Default Apps again and successfully see that it has switched your default web browser to Google Chrome!
Wrapping Up
Hopefully this guide helped you force change the default web browser to Google Chrome for your company!
If you’ve been looking for a Powershell script to find the most recent computers that have been joined to your Active Directory domain, then you’re in luck.
This Powershell script is super simple and is only a few lines of code long. I’ve also paired it with my Next In Line Computer Name Script. We have a standard naming convention when joining computer objects to the domain: company abbreviations, then append a number.
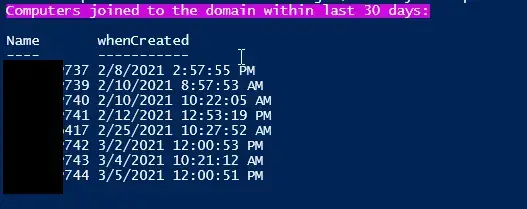
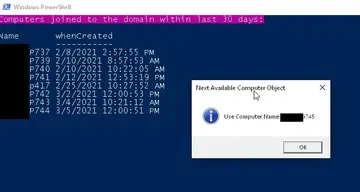
When this script runs, it will output computers that have been joined to the domain within the last 30 days. You can of course change the number to anything you like.
Powershell Script To Filter by Join Date / When Computer Account Was Created
If you have the same naming convention we do, then you could obviously just look at the last joined object and create xxxxxxx745 as the next object. However, if you’d like to take it a step further and have it display a box that visually tells you which computer name to use, then follow this guide. (It’s as simple as creating a text file called number.txt and adding the number of the last computer object you joined to the domain.)
If you’ve set that up, then here is the script you could use instead. On the last line, just append your computer prefix in place of the xxxx’s.
[void][Reflection.Assembly]::LoadWithPartialName('Microsoft.VisualBasic')

$NotifyUser = {
    [Microsoft.VisualBasic.Interaction]::MsgBox(
        ($args -join ' '), #Notification
        [Microsoft.VisualBasic.MsgBoxStyle]::Information,
        "Next Available Computer Object" #TitleBar
    )
}

[int](get-content "\\fileshare\IT\Scripts\New Hire-Computer\number.txt") + 1 | out-file "\\fileshare\IT\Scripts\New Hire-Computer\number.txt"
$Value = Get-content "\\fileshare\IT\Scripts\New Hire-Computer\number.txt"
$recently = [DateTime]::Today.AddDays(-30)
Write-Host -BackgroundColor Magenta Computers joined to the domain within last 30 days:
Get-ADComputer -Filter 'WhenCreated -ge $recently' -Properties whenCreated | Format-Table Name,whenCreated -Autosize -Wrap

&$NotifyUser Use Computer Name: xxxxxxx$Value
My Homelab Equipment
Here is some of the gear I use in my Homelab. I highly recommend each of them.
This article describes the steps involved in creating Polices using SonicOS APIs that will let you access internal devices or servers behind the SonicWall firewall.
Cause
SonicWall by default does not allow inbound traffic which not a part of a session that was initiated by an internal device on the network. This is done to protect the devices in the internal network from malicious access. If required certain parts of the network can be opened to external access, for example Webservers, Exchange servers and so on.
To open the network, we need to specify an access rule from the external network to the internal network and a NAT Policy so we direct traffic only to the intended device.
With APIs this can be achieved on scale for example you can create multiple Access Rules and NAT policies with one command and all the attributes can be specified into Json Objects.
Resolution
Manually opening Ports / enabling Port forwarding to allow traffic from the Internet to a Server behind the SonicWall using sonicos API involves the following steps:
Step1: Enabling the API Module.
Step2:Getting into Swagger.
Step3:Login to the SonicWall with API.
Step4:Create Address Objects and Service Objects with API.
Step5:Creating NAT Policy with API.
Step6: Creating Access Rules with API.
Step7:Committing all the configurational changes made with APIs.
Step8: Log out the SonicWall with API:
Scenario Overview
The following walk-through details allowing TCP 3389 From the Internet to a Terminal Server on the Local Network.Once the configuration is complete, Internet Users can RDP into the Terminal Server using the WAN IP address.Although the examples below show the LAN Zone and TCP 3389 they can apply to any Zone and any Port that is required.
Click on the Link https://sonicos-api.sonicwall.com
Swagger will prepopulate your SonicWalls’s IP, MGMT Port, Firmware so it can give you a list of applicable APIs.
NOTE: All the APIs required for configuring Port Forwarding will be listed in this Article.
Step3:Login to the SonicWall with API:
curl -k -i -u “admin:password” -X POST https://192.168.168.168:443/api/sonicos/auth
“admin:password” – Replace this with your SonicWalls username : password
https://192.168.168.168:443/– Replace this with your SonicWalls Public or private IP address
Command Output should contain a string: “success”: true
NOTE: You are free to choose Swagger, Postman, Git bash or any application that allows API calls, if you are using a Linux based operating system you can execute cURL from the terminal.For this article I am using Git bash on Windows.
Step4:Create Address Objects and Service Objects with API:
curl -k -i -X POST “https://192.168.168.168:443/api/sonicos/address-objects/ipv4” -H “accept: application/Json” -H “Content-Type: application/Json” -d “{\”address_object\”:{\”ipv4\”:{\”name\”:\”Term Server Private\”,\”zone\”:\”LAN\”,\”host\”:{\”ip\”:\”192.168.168.10\”}}}}” && curl -k -i -X POST “https://192.168.168.168:443/api/sonicos/address-objects/ipv4” -H “accept: application/Json” -H “Content-Type: application/Json” -d “{\”address_object\”:{\”ipv4\”:{\”name\”:\”Term Server Public\”,\”zone\”:\”WAN\”,\”host\”:{\”ip\”:\”1.1.1.1\”}}}}”
Output of the First command where we have parsed the address object data on the command instead of creating a separate File:
Output of the second Command where we have used a file called @add instead of specifying data on the command:
TIP: If you are creating only one Address Object then the First command should be sufficient, if you are creating multiple address objects then the second command should be used.
CAUTION: I have the add.Json file saved on to my desktop and hence I was able to call it into the command, if you have created the Json the file in a different location then make sure you are executing the command from that location.
https://192.168.168.168:443 – Replace that with the IP of the SonicWall
@serviceobj.Json is a file that contains the Attributes of the service object:
{
“service_object”: {
“name”: “Terminal Server 3389”,
“TCP”: {
“begin”: 3389,
“end”: 3389
}
}
}
Output of the command:
3. Committing the changes made to the SonicWall: We need to do this to be able to use the Address Objects and service objects that we just created to make a NAT Policy and an Access Rule.
curl -k -X POST “https://192.168.168.168:443/api/sonicos/config/pending” -H “accept: application/Json”
https://192.168.168.168:443 – Replace that with the IP of the SonicWall
https://192.168.168.168:443 – Replace that with the IP of the SonicWall
@accessrule.Json is a file that contains the Attributes of the access rule:
{
“access_rules”: [
{
“ipv4”: {
“name”: “Inbound 3389”,
“enable”: true,
“from”: “WAN”,
“to”: “LAN”,
“action”: “allow”,
“source”: {
“address”: {
“any”: true
},
“port”: {
“any”: true
}
},
“service”: {
“name”: “Terminal Server 3389”
},
“destination”: {
“address”: {
“name”: “Term Server Public”
}
}
}
}
]
}
Output of the command:
Step7: Committing all the configurational changes made with APIs:
1. We have already committed Address objects and Service Objects in Step 4, In this step we are committing the NAT Policy and the Access Rule to the SonicWalls configuration:
curl -k -X POST “https://192.168.168.168:443/api/sonicos/config/pending” -H “accept: application/Json”
https://192.168.168.168:443 – Replace that with the IP of the SonicWall
We have Only used the POST method in most of the API calls for this Article because we are only Adding things into the configuration, there are other methods Like GET,DELETE,PUT and etc. I recommend that you go through https://sonicos-api.sonicwall.com for more API commands.
Step8: Log out the SonicWall with API:
1. It is recommended to log out from the SonicWall via API once the desired configuration is committed.
https://192.168.168.168:443 – Replace that with the IP of the SonicWall
“admin:password” – is the actual username and password for the SonicWall.
Output of the command:
CAUTION: Caution: If you miss to perform the action in Step 7 and Execute the command in Step 8 you will lose all the configuration changes made in the current session.
Summary:We have successfully configured a Port Forwarding for a user in the Internet to access a Term Server that is behind a Firewall on port 3389 using sonicos API.
NOTE: It is always recommended to use Client VPN for RDP connections this article here is just an example.
FQDN: cloudgmsams.sonicwall.com Zero Touch FQDN: cloudttams.global.sonicwall.com IP: 213.244.188.168, 213.244.188.188
For AWS-FRA Colo
FQDN: cscmafra.sonicwall.com Zero Touch FQDN: cscmafratt.global.sonicwall.com, cscmafratta.global.sonicwall.com IP: 18.197.234.66, 18.197.234.59
SonicWall NSM:
For Oregon AWS Colo
FQDN: nsm-uswest.sonicwall.com (Use it in GMS settings under Administration Page) Zero Touch FQDN: nsm-uswest-zt.sonicwall.com (Use it in ZeroTouch Settings under Diag page) IP: 13.227.130.81, 13.227.130.63, 3.227.130.69, 13.227.130.12, 52.39.29.75, 44.233.105.101, 44.227.248.206
For AWS-FRA Colo
FQDN: nsm-eucentral.sonicwall.com (Use it in GMS settings under Administration Page) Zero Touch FQDN: nsm-eucentral-zt.sonicwall.com (Use it in ZeroTouch Settings under Diag page) IP: 13.227.130.70, 13.227.130.69, 13.227.130.15, 13.227.130.92, 18.156.16.24, 18.157.240.148, 3.127.176.56
And that’s a wrap! Impact Week 2022 has come to a close. Over the last week, Cloudflare announced new commitments in our mission to help build a better Internet, including delivering Zero Trust services for the most vulnerable voices and for critical infrastructure providers. We also announced new products and services, and shared technical deep dives.
Were you able to keep up with everything that was announced? Watch the Impact Week 2022 wrap-up video on Cloudflare TV, or read our recap below for anything you may have missed.
We are making the Cloudflare One Zero Trust suite available to teams that qualify for Project Galileo or Athenian at no cost. Cloudflare One includes the same Zero Trust security and connectivity solutions used by over 10,000 customers today to connect their users and safeguard their data.
Under-resourced organizations that are vital to the basic functioning of our global communities (such as community hospitals, water treatment facilities, and local energy providers) face relentless cyber attacks, threatening basic needs for health, safety and security. Cloudflare’s mission is to help make a better Internet. We will help support these vulnerable infrastructure by providing our enterprise-level Zero Trust cybersecurity solution to them at no cost, with no time limit.
We are excited to announce our public sector suite of services, Cloudflare for Government, has achieved FedRAMP Moderate Authorization. The Federal Risk and Authorization Management Program (“FedRAMP”) is a US-government-wide program that provides a standardized approach to security assessment, authorization, and continuous monitoring for cloud products and services.
At Cloudflare, we want to give our customers tools that allow them to maintain compliance in this ever-changing environment. That’s why we’re excited to announce a new version of Geo Key Manager — one that allows customers to define boundaries by country, by region, or by standard.
Cloudflare is participating in the AS112 project, becoming an operator of the loosely coordinated, distributed sink of the reverse lookup (PTR) queries for RFC 1918 addresses, dynamic DNS updates and other ambiguous addresses.
The Border Gateway Protocol (BGP) is the glue that keeps the entire Internet together. However, despite its vital function, BGP wasn’t originally designed to protect against malicious actors or routing mishaps. It has since been updated to account for this shortcoming with the Resource Public Key Infrastructure (RPKI) framework, but can we declare it to be safe yet?
We are excited to share that we have grown our offering under the Athenian Project to include Cloudflare’s Area 1 email security suite to help state and local governments protect against a broad spectrum of phishing attacks to keep voter data safe and secure.
Large-scale cyber attacks on enterprises and governments make the headlines, but the impacts of cyber conflicts can be felt more profoundly and acutely by small businesses that struggle to keep the lights on during normal times. In this blog, we’ll share new research on how small businesses, including those using our free services, have leveraged Cloudflare services to make their businesses more secure and resistant to disruption.
A year and a half ago, Cloudflare launched Project Pangea to help provide Internet services to underserved communities. Today, we’re sharing what we’ve learned by partnering with community networks, and announcing an expansion of the project.
We want to tell you more about how we work with civil society organizations to provide tools to track and document the scope of these disruptions. We want to support their critical work and provide the tools they need so they can demand accountability and condemn the use of shutdowns to silence dissent.
At Cloudflare, part of our role is to make sure every person on the planet with an Internet connection has a good experience, whether they’re in a next-generation market or a current-gen market. In this blog we talk about how we define next-generation markets, how we help people in these markets get faster access to the websites and applications they use on a daily basis, and how we make it easy for developers to deploy services geographically close to users in next-generation markets.
We didn’t start out with the goal to reduce the Internet’s environmental impact. But as the Internet has become an ever larger part of our lives, that has changed. Our mission is to help build a better Internet — and a better Internet needs to be a sustainable one.
We’re excited to announce an opportunity for Cloudflare customers to make it easier to decommission and dispose of their used hardware appliances in a sustainable way. We’re partnering with Iron Mountain to offer preferred pricing and value-back for Cloudflare customers that recycle or remarket legacy hardware through their service.
With the incredible growth of the Internet, and the increased usage of Cloudflare’s network, even linear improvements to sustainability in our hardware today will result in exponential gains in the future. We want to use this post to outline how we think about the sustainability impact of the hardware in our network, and what we’re doing to continually mitigate that impact.
Last year, Cloudflare committed to removing or offsetting the historical emissions associated with powering our network by 2025. We are excited to announce our first step toward offsetting our historical emissions by investing in 6,060 MTs’ worth of reforestation carbon offsets as part of the Pacajai Reduction of Emissions from Deforestation and forest Degradation (REDD+) Project in the State of Para, Brazil.
Cloudflare is working hard to ensure that we’re making a positive impact on the environment around us, with the goal of building the most sustainable network. At the same time, we want to make sure that the positive changes that we are making are also something that our local Cloudflare team members can touch and feel, and know that in each of our actions we are having a positive impact on the environment around us. This is why we make sustainability one of the underlying goals of the design, construction, and operations of our global office spaces.
Once a year, we pull data from our Bot Fight Mode to determine the number of trees we can donate to our partners at One Tree Planted. It’s part of the commitment we made in 2019 to deter malicious bots online by redirecting them to a challenge page that requires them to perform computationally intensive, but meaningless tasks. While we use these tasks to drive up the bill for bot operators, we account for the carbon cost by planting trees.
As governments continue to use sanctions as a foreign policy tool, we think it’s important that policymakers continue to hear from Internet infrastructure companies about how the legal framework is impacting their ability to support a global Internet. Here are some of the key issues we’ve identified and ways that regulators can help balance the policy goals of sanctions with the need to support the free flow of communications for ordinary citizens around the world.
On February 24, 2022, when Russia invaded Ukraine, Cloudflare jumped into action to provide services that could help prevent potentially destructive cyber attacks and keep the global Internet flowing. During Impact Week, we want to provide an update on where things currently stand, the role of security companies like Cloudflare, and some of our takeaways from the conflict so far.
A series of protests began in Iran on September 16, following the death in custody of Mahsa Amini — a 22 year old who had been arrested for violating Iran’s mandatory hijab law. The protests and civil unrest have continued to this day. But the impact hasn’t just been on the ground in Iran — the impact of the civil unrest can be seen in Internet usage inside the country, as well.
We thought this week would be a great opportunity to share Cloudflare’s principles and our theories behind policy engagement. Because at its core, a public policy approach needs to reflect who the company is through their actions and rhetoric. And as a company, we believe there is real value in helping governments understand how companies work, and helping our employees understand how governments and law-makers work.
What does it mean to apply human rights frameworks to our response to abuse? As we’ll talk about in more detail, we use human rights concepts like access to fair process, proportionality (the idea that actions should be carefully calibrated to minimize any effect on rights), and transparency.
This blog dives into a discussion of IP blocking: why we see it, what it is, what it does, who it affects, and why it’s such a problematic way to address content online.
Our Impact Report is an annual summary highlighting how we are trying to build a better Internet and the progress we are making on our environmental, social, and governance priorities.
Cloudflare is on a mission to help build a better Internet, and we are committed to doing this with ethics and integrity in everything that we do. This commitment extends beyond our own actions, to third parties acting on our behalf. We are excited to share our Third Party Code of Conduct, specifically formulated with our suppliers, resellers and other partners in mind.
Visit 1.1.1.1 from any device to get started with our free app that makes your Internet faster and safer.
To learn more about our mission to help build a better Internet, start here. If you’re looking for a new career direction, check out our open positions.
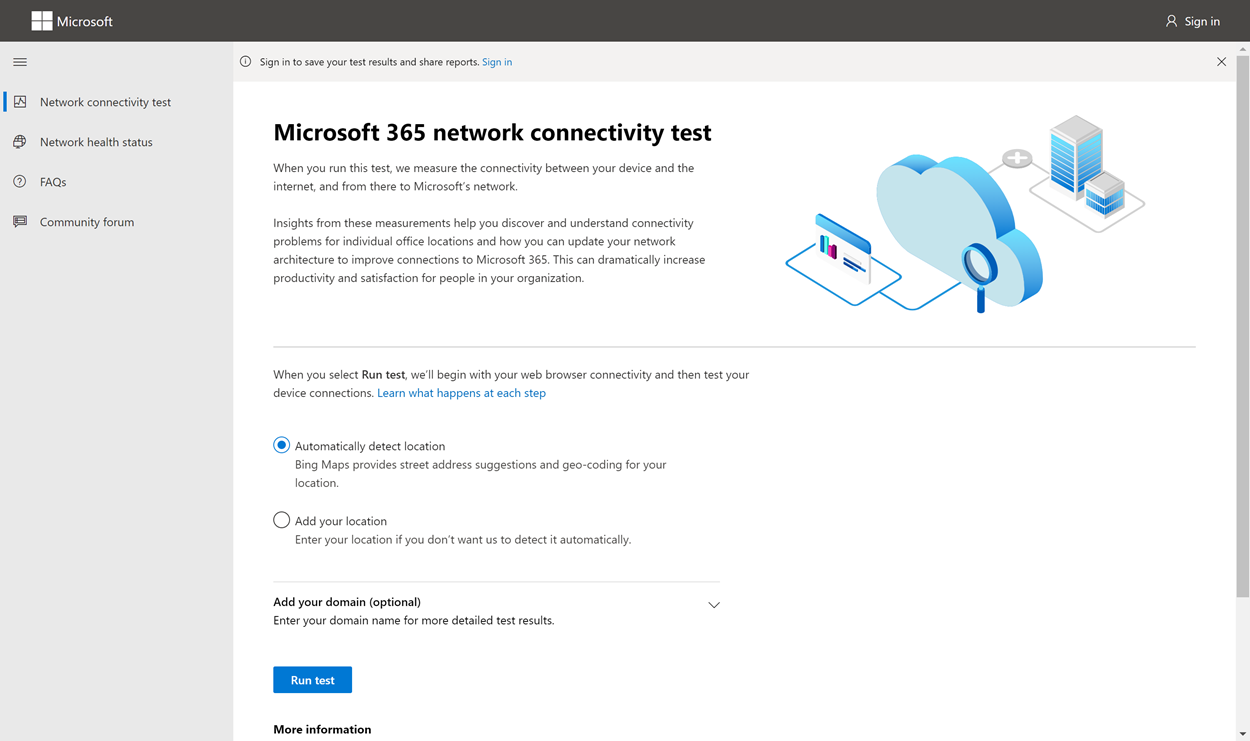
The Microsoft 365 network connectivity test tool is located at https://connectivity.office.com. It’s an adjunct tool to the network assessment and network insights available in the Microsoft 365 admin center under the Health | Connectivity menu.
Important
It’s important to sign in to your Microsoft 365 tenant as all test reports are shared with your administrator and uploaded to the tenant while you are signed in.
Note
The network connectivity test tool supports tenants in WW Commercial but not GCC Moderate, GCC High, DoD or China.
Network insights in the Microsoft 365 Admin Center are based on regular in-product measurements for your Microsoft 365 tenant, aggregated each day. In comparison, network insights from the Microsoft 365 network connectivity test are run locally in the tool.
In-product testing is limited, and running tests local to the user collects more data resulting in deeper insights. Network insights in the Microsoft 365 Admin Center will show that there’s a networking problem at a specific office location. The Microsoft 365 connectivity test can help to identify the root cause of that problem and provide a targeted performance improvement action.
We recommend that these insights be used together where networking quality status can be assessed for each office location in the Microsoft 365 Admin Center and more specifics can be found after deployment of testing based on the Microsoft 365 connectivity test.
What happens at each test step
Office location identification
When you click the Run test button, we show the running test page and identify the office location. You can type in your location by city, state, and country or choose to have it detected for you. If you detect the office location, the tool requests the latitude and longitude from the web browser and limits the accuracy to 300 meters by 300 meters before use. It’s not necessary to identify the location more accurately than the building to measure network performance.
JavaScript tests
After office location identification, we run a TCP latency test in JavaScript and we request data from the service about in-use and recommended Microsoft 365 service front door servers. When these tests are completed, we show them on the map and in the details tab where they can be viewed before the next step.
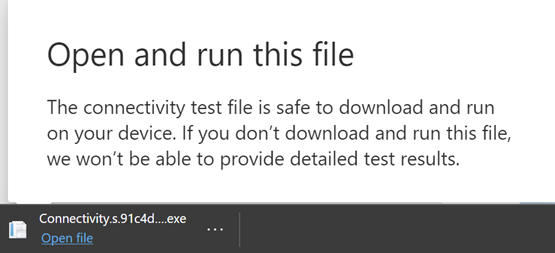
Download the advanced tests client application
Next, we start the download of the advanced tests client application. We rely on the user to launch the client application and they must also have .NET 6.0 Runtime installed.
There are two parts to the Microsoft 365 network connectivity test: the web site https://connectivity.office.com and a downloadable Windows client application that runs advanced network connectivity tests. Most of the tests require the application to be run. It will populate results back into the web page as it runs.
You’ll be prompted to download the advanced client test application from the web site after the web browser tests have completed. Open and run the file when prompted.
Start the advanced tests client application
Once the client application starts, the web page will update to show this result. Test data will start to be received to the web page. The page updates each time new-data is received and you can review the data as it arrives.
Advanced tests completed and test report upload
When the tests are completed, the web page and the advanced tests client will both show that. If the user is signed in, the test report will be uploaded to the customer’s tenant.
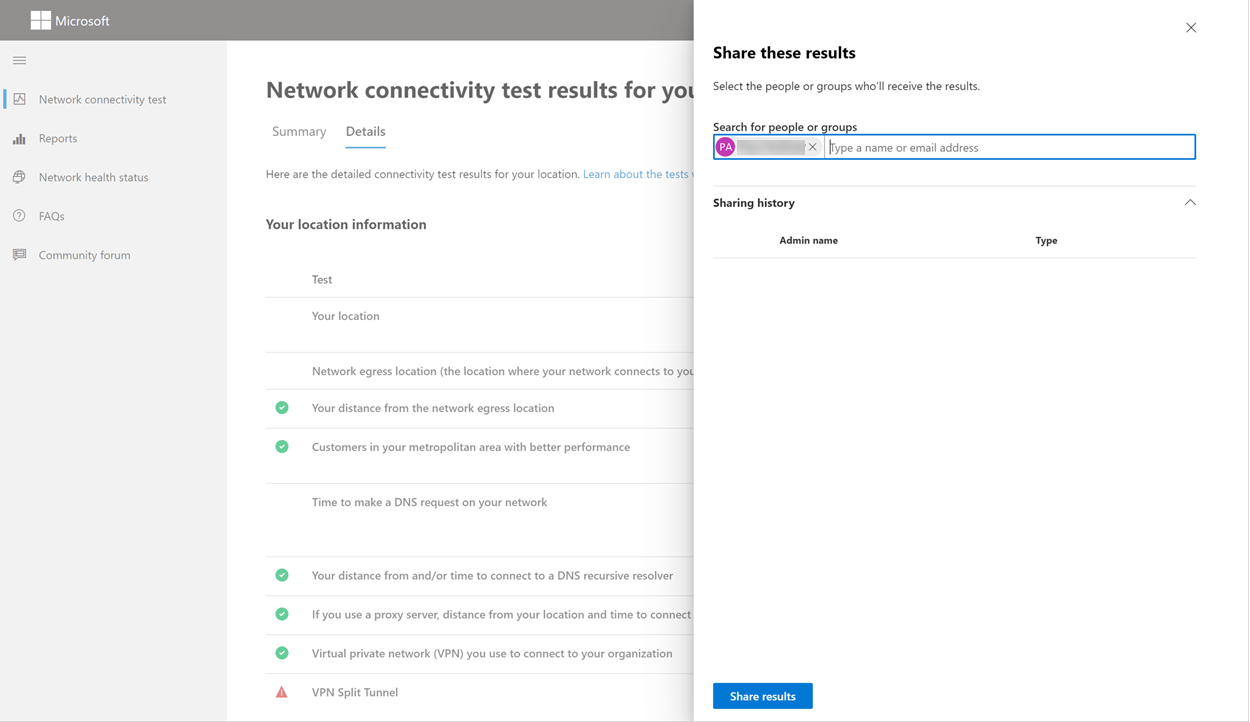
Sharing your test report
The test report requires authentication to your Microsoft 365 account. Your administrator selects how you can share your test report. The default settings allow for sharing of your reports with other user within your organization and the ReportID link is not available. Reports will expire by default after 90 days.
Sharing your report with your administrator
If you’re signed in when a test report occurs, the report is shared with your administrator.
Sharing with your Microsoft account team, support or other personnel
Test reports (excluding any personal identification) are shared with Microsoft employees. This sharing is enabled by default and can be disabled by your administrator in the Health | Network Connectivity page in the Microsoft 365 Admin Center.
Sharing with other users who sign in to the same Microsoft 365 tenant
You can choose users to share your report with. Being able to choose is enabled by default, but it can be disabled by your administrator.
Sharing with anyone using a ReportID link
You can share your test report with anyone by providing access to a ReportID link. This link generates a URL that you can send to someone so that they can bring up the test report without signing in. This sharing is disabled by default and must be enabled by your administrator.
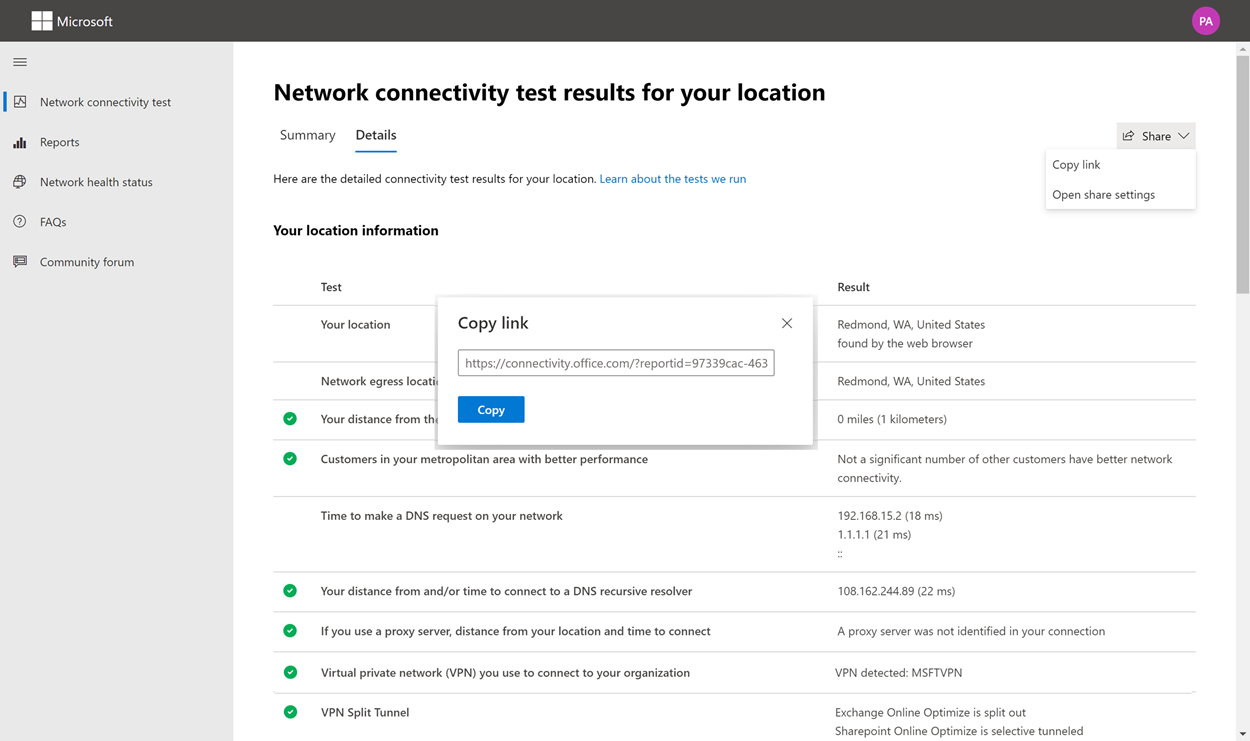
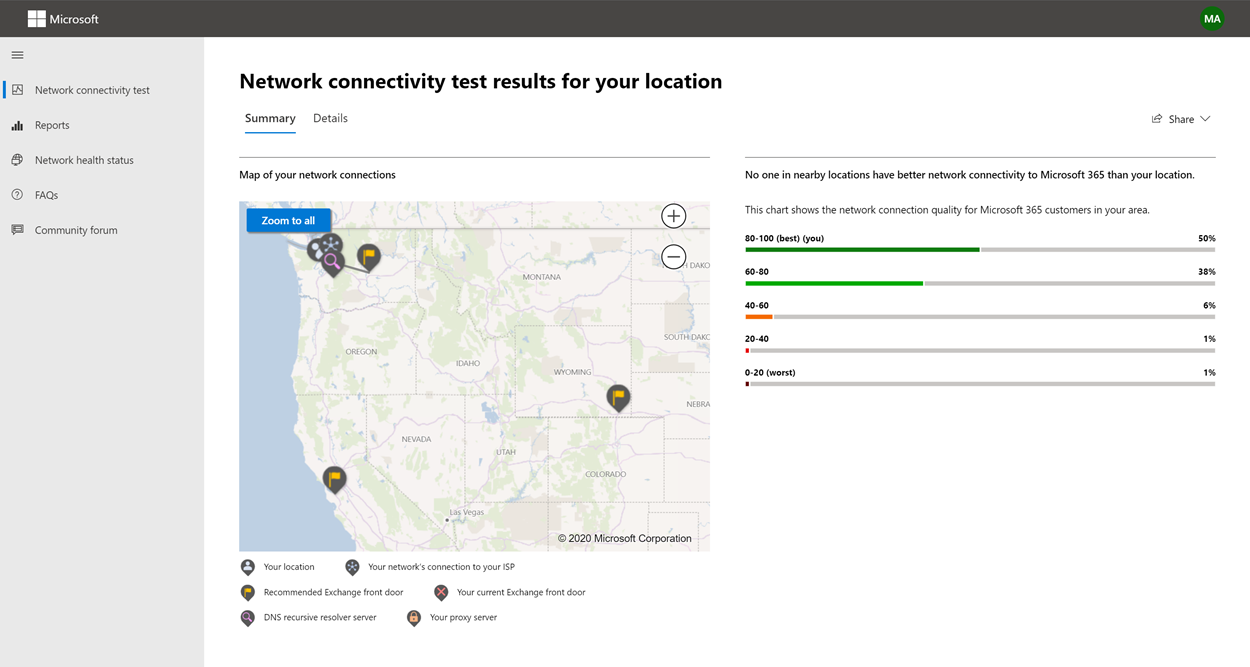
Network Connectivity Test Results
The results are shown in the Summary and Details tabs. The summary tab shows a map of the detected network perimeter and a comparison of the network assessment to other Microsoft 365 customers nearby. It also allows for sharing of the test report. Here’s what the summary results view looks like:
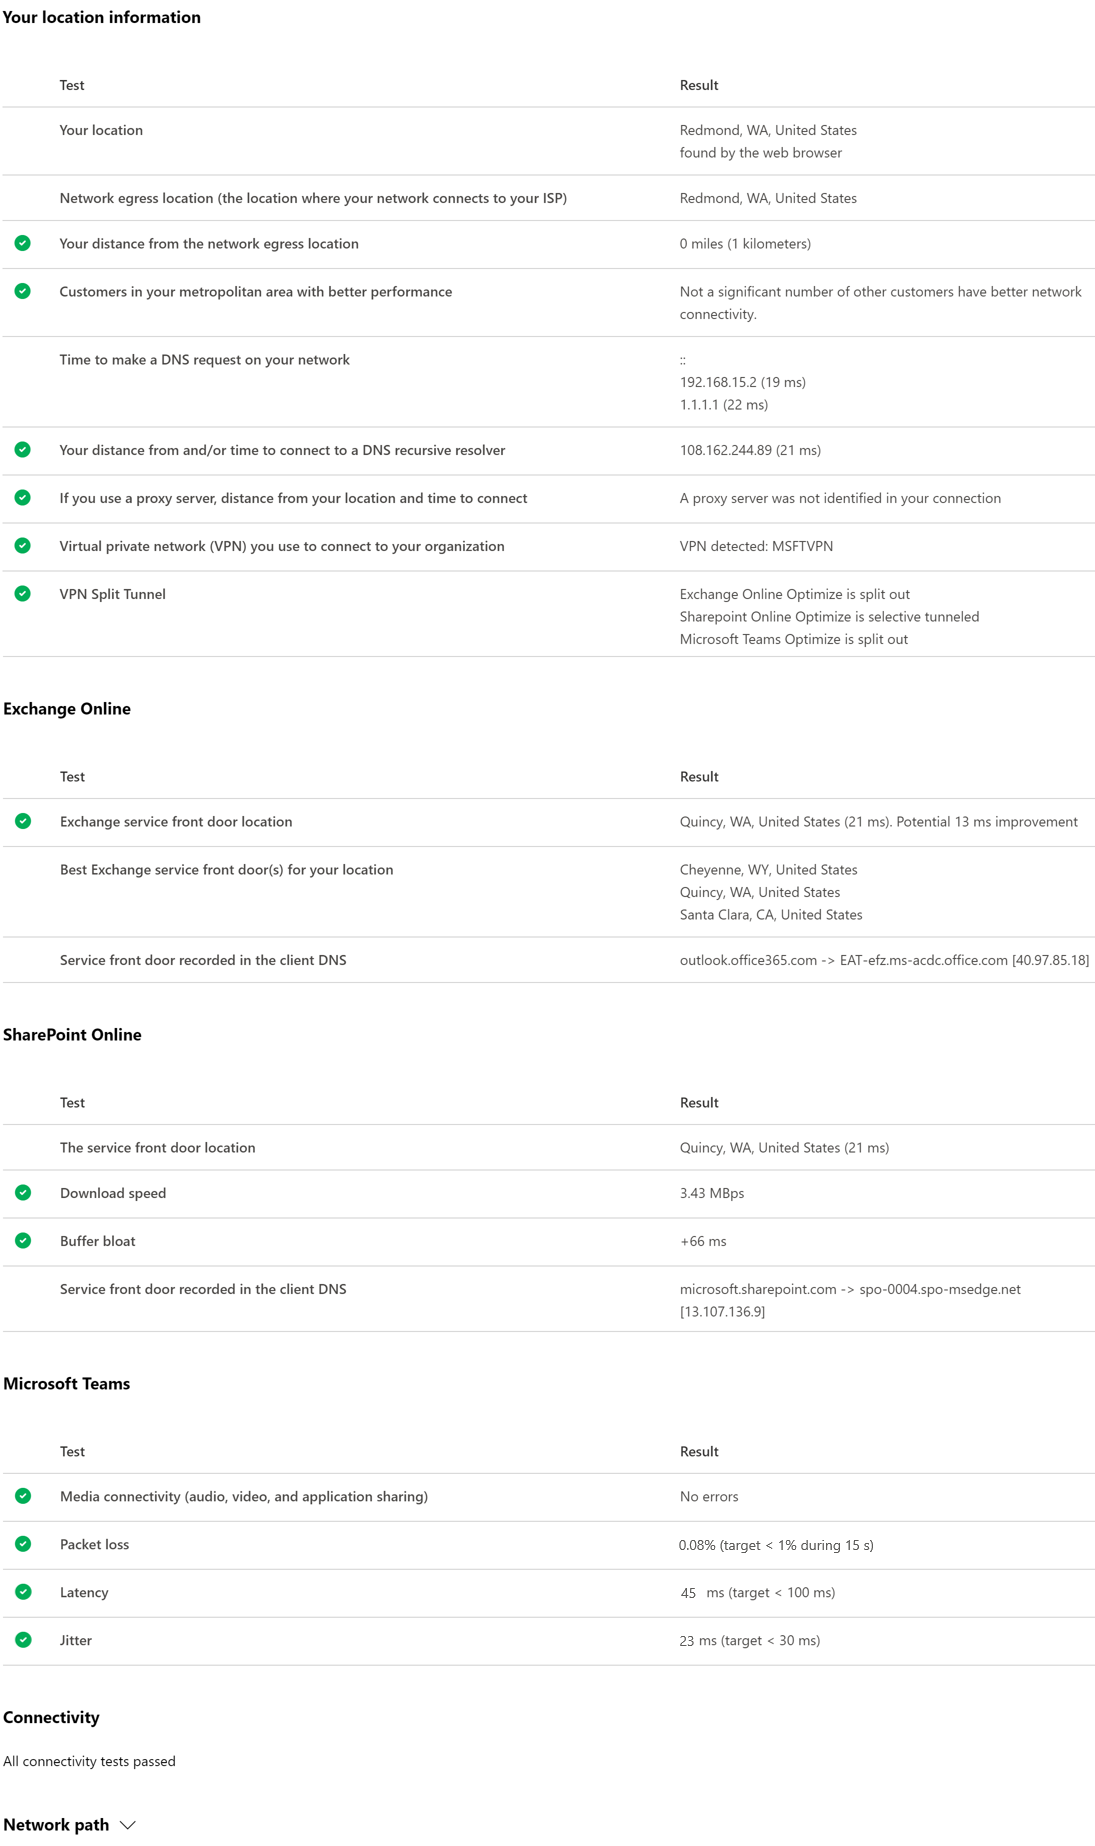
Here’s an example of the details tab output. On the details tab we show a green circle check mark if the result was compared favorably. We show a red triangle exclamation point if the result exceeded a threshold indicating a network insight. The following sections describe each of the details tab results rows and explain the thresholds used for network insights.
Your location information
This section shows test results related to your location.
Your location
The user location is detected from the users web browser. It can also be typed in at the user’s choice. It’s used to identify network distances to specific parts of the enterprise network perimeter. Only the city from this location detection and the distance to other network points are saved in the report.
The user office location is shown on the map view.
Network egress location (the location where your network connects to your ISP)
We identify the network egress IP address on the server side. Location databases are used to look up the approximate location for the network egress. These databases typically have an accuracy of about 90% of IP addresses. If the location looked up from the network egress IP address isn’t accurate, this would lead to a false result. To validate if this error is occurring for a specific IP address, you can use publicly accessible network IP address location web sites to compare against your actual location.
Your distance from the network egress location
We determine the distance from that location to the office location. This is shown as a network insight if the distance is greater than 500 miles (800 kilometers) since that is likely to increase the TCP latency by more than 25 ms and may affect user experience.
The map shows the network egress location in relation to the user office location indicating the network backhaul inside of the enterprise WAN.
Implement local and direct network egress from user office locations to the Internet for optimal Microsoft 365 network connectivity. Improvements to local and direct egress are the best way to address this network insight.
Proxy server information
We identify whether proxy server(s) are configured on the local machine to pass Microsoft 365 network traffic in the Optimize category. We identify the distance from the user office location to the proxy servers.
The distance is tested first by ICMP ping. If that fails, we test with TCP ping and finally we look up the proxy server IP address in an IP address location database. We show a network insight if the proxy server is further than 500 miles (800 kilometers) away from the user office location.
Virtual private network (VPN) you use to connect to your organization
This test detects if you’re using a VPN to connect to Microsoft 365. A passing result will show if you have no VPN, or if you have a VPN with recommended split tunnel configuration for Microsoft 365.
VPN Split Tunnel
Each Optimize category route for Exchange Online, SharePoint Online, and Microsoft Teams is tested to see if It’s tunneled on the VPN. A split out workload avoids the VPN entirely. A tunneled workload is sent over the VPN. A selective tunneled workload has some routes sent over the VPN and some split out. A passing result will show if all workloads are split out or selective tunneled.
Customers in your metropolitan area with better performance
Network latency between the user office location and the Exchange Online service is compared to other Microsoft 365 customers in the same metro area. A network insight is shown if 10% or more of customers in the same metro area have better performance. This means their users will have better performance in the Microsoft 365 user interface.
This network insight is generated on the basis that all users in a city have access to the same telecommunications infrastructure and the same proximity to Internet circuits and Microsoft’s network.
Time to make a DNS request on your network
This shows the DNS server configured on the client machine that ran the tests. It might be a DNS Recursive Resolver server however this is uncommon. It’s more likely to be a DNS forwarder server, which caches DNS results and forwards any uncached DNS requests to another DNS server.
This is provided for information only and does not contribute to any network insight.
Your distance from and/or time to connect to a DNS recursive resolver
The in-use DNS Recursive Resolver is identified by making a specific DNS request and then asking the DNS Name Server for the IP Address that it received the same request from. This IP Address is the DNS Recursive Resolver and it will be looked up in IP Address location databases to find the location. The distance from the user office location to the DNS Recursive Resolver server location is then calculated. This is shown as a network insight if the distance is greater than 500 miles (800 kilometers).
The location looked up from the network egress IP Address may not be accurate and this would lead to a false result from this test. To validate if this error is occurring for a specific IP Address, you can use publicly accessible network IP Address location web sites.
This network insight will specifically impact the selection of the Exchange Online service front door. To address this insight local and direct network egress should be a pre-requisite and then DNS Recursive Resolver should be located close to that network egress.
Exchange Online
This section shows test results related to Exchange Online.
Exchange service front door location
The in-use Exchange service front door is identified in the same way that Outlook does this and we measure the network TCP latency from the user location to it. The TCP latency is shown and the in-use Exchange service front door is compared to the list of best service front doors for the current location. This is shown as a network insight if one of the best Exchange service front door(s) isn’t in use.
Not using one of the best Exchange service front door(s) could be caused by network backhaul before the corporate network egress in which case we recommend local and direct network egress. It could also be caused by use of a remote DNS recursive resolver server in which case we recommend aligning the DNS recursive resolver server with the network egress.
We calculate a potential improvement in TCP latency (ms) to the Exchange service front door. This is done by looking at the tested user office location network latency and subtracting the network latency from the current location to the closets Exchange service front door. The difference represents the potential opportunity for improvement.
Best Exchange service front door(s) for your location
This lists the best Exchange service front door locations by city for your location.
Service front door recorded in the client DNS
This shows the DNS name and IP Address of the Exchange service front door server that you were directed to. It’s provided for information only and there’s no associated network insight.
SharePoint Online
This section shows test results related to SharePoint Online and OneDrive.
The service front door location
The in-use SharePoint service front door is identified in the same way that the OneDrive client does and we measure the network TCP latency from the user office location to it.
Download speed
We measure the download speed for a 15 Mb file from the SharePoint service front door. The result is shown in megabytes per second to indicate what size file in megabytes can be downloaded from SharePoint or OneDrive in one second. The number should be similar to one tenth of the minimum circuit bandwidth in megabits per second. For example if you have a 100mbps internet connection, you may expect 10 megabytes per second (10 MBps).
Buffer bloat
During the 15Mb download we measure the TCP latency to the SharePoint service front door. This is the latency under load and it’s compared to the latency when not under load. The increase in latency when under load is often attributable to consumer network device buffers being loaded (or bloated). A network insight is shown for any bloat of 100ms or more.
Service front door recorded in the client DNS
This shows the DNS name and IP Address of the SharePoint service front door server that you were directed to. It’s provided for information only and there’s no associated network insight.
Microsoft Teams
This section shows test results related to Microsoft Teams.
Media connectivity (audio, video, and application sharing)
This tests for UDP connectivity to the Microsoft Teams service front door. If this is blocked, then Microsoft Teams may still work using TCP, but audio and video will be impaired. Read more about these UDP network measurements, which also apply to Microsoft Teams at Media Quality and Network Connectivity Performance in Skype for Business Online.
Packet loss
Shows the UDP packet loss measured in a 10-second test audio call from the client to the Microsoft Teams service front door. This should be lower than 1.00% for a pass.
Latency
Shows the measured UDP latency, which should be lower than 100ms.
Jitter
Shows the measured UDP jitter, which should be lower than 30ms.
Connectivity
We test for HTTP connectivity from the user office location to all of the required Microsoft 365 network endpoints. These are published at https://aka.ms/o365ip. A network insight is shown for any required network endpoints, which cannot be connected to.
Connectivity may be blocked by a proxy server, a firewall, or another network security device on the enterprise network perimeter. Connectivity to TCP port 80 is tested with an HTTP request and connectivity to TCP port 443 is tested with an HTTPS request. If there’s no response the FQDN is marked as a failure. If there’s an HTTP response code 407 the FQDN is marked as a failure. If there’s an HTTP response code 403 then we check the Server attribute of the response and if it appears to be a proxy server we mark this as a failure. You can simulate the tests we perform with the Windows command-line tool curl.exe.
We test the SSL certificate at each required Microsoft 365 network endpoint that is in the optimize or allow category as defined at https://aka.ms/o365ip. If any tests do not find a Microsoft SSL certificate, then the encrypted network connected must have been intercepted by an intermediary network device. A network insight is shown on any intercepted encrypted network endpoints.
Where an SSL certificate is found that isn’t provided by Microsoft, we show the FQDN for the test and the in-use SSL certificate owner. This SSL certificate owner may be a proxy server vendor, or it may be an enterprise self-signed certificate.
Network path
This section shows the results of an ICMP traceroute to the Exchange Online service front door, the SharePoint Online service front door, and the Microsoft Teams service front door. It’s provided for information only and there’s no associated network insight. There are three traceroutes provided. A traceroute to outlook.office365.com, a traceroute to the customers SharePoint front end or to microsoft.sharepoint.com if one was not provided, and a traceroute to world.tr.teams.microsoft.com.
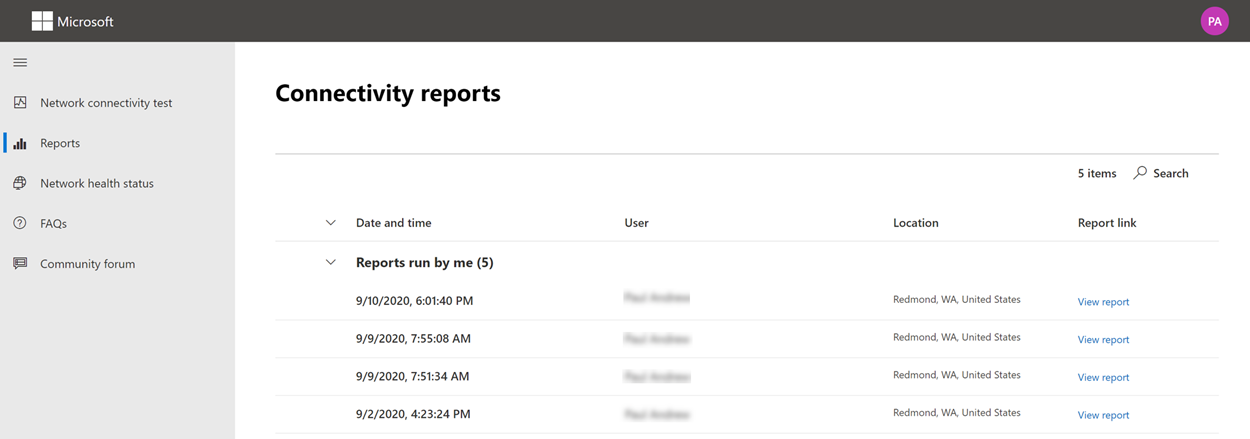
Connectivity reports
When you are signed in you can review previous reports that you have run. You can also share them or delete them from the list.
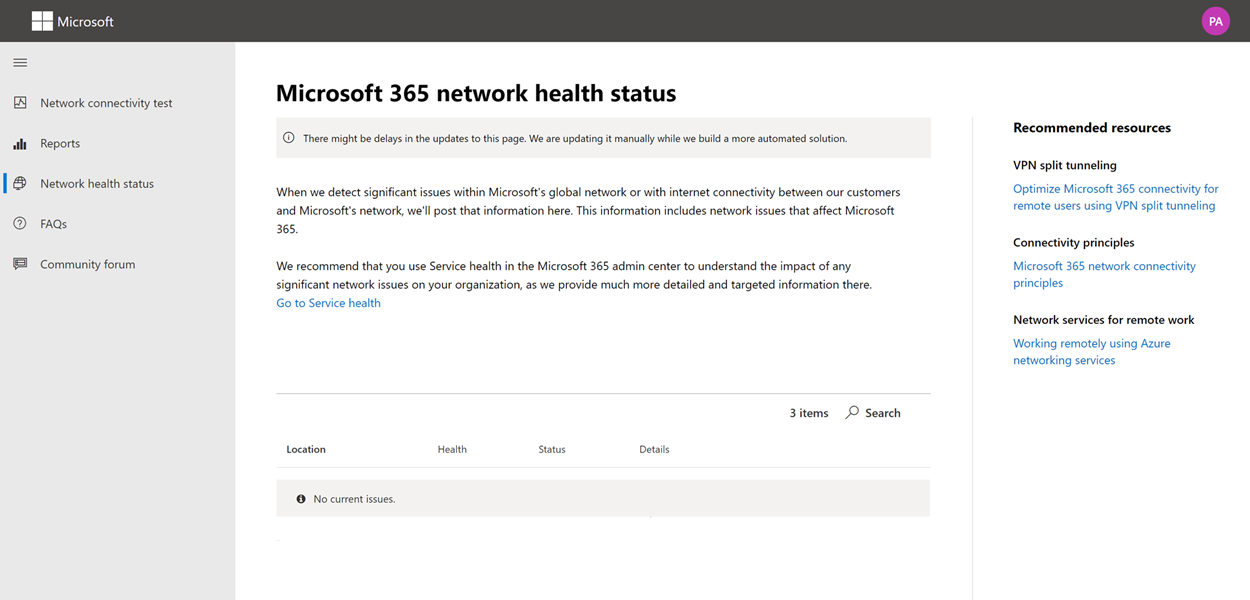
Network health status
This shows any significant health issues with Microsoft’s global network, which might impact Microsoft 365 customers.
Testing from the Command Line
We provide a command line executable that can be used by your remote deployment and execution tools and run the same tests as are available in the Microsoft 365 network connectivity test tool web site.
The command line test tool can be downloaded here: Command Line Tool
You can run it by double clicking the executable in Windows File Explorer, or you can start it from a command prompt, or you can schedule it with task scheduler.
The first time you launch the executable you will be prompted to accept the end user license agreement (EULA) before testing is performed. If you have already read and accepted the EULA you can create an empty file called Microsoft-365-Network-Connectivity-Test-EULA-accepted.txt in the current working directory for the executable process when it is launched. To accept the EULA you can type ‘y’ and press enter in the command line window when prompted.
The executable accepts the following command line parameters:
-h to show a link to this help documentation
-testlist <test> Specifies tests to run. By default only basic tests are run. Valid test names include: all, dnsConnectivityPerf, dnsResolverIdentification, bufferBloat, traceroute, proxy, vpn, skype, connectivity, networkInterface
-filepath <filedir> Directory path of test result files. Allowed value is absolute or relative path of an accessible directory
-city <city> For the city, state, and country fields the specified value will be used if provided. If not provided then Windows Location Services (WLS) will be queried. If WLS fails the location will be detected fromthe machines network egress
-state <state>
-country <country>
-proxy <account> <password> Proxy account name and password can be provided if you require a proxy to access the Internet
Results
Output of results are written to a JSON file in a folder called TestResults which is created in the current working directory of the process unless it already exists. The filename format for the output is connectivity_test_result_YYYY-MM-DD-HH-MM-SS.json. The results are in JSON nodes that match the output shown on the web page for the Microsoft 365 network connectivity test tool web site. A new result file is created each time you run it and the standalone executable does not upload results to your Microsoft tenant for viewing in the Admin Center Network Connectivity pages. Front door codes, longitudes, and latitudes are not included in the result file.
Launching from Windows File Explorer
You can simply double click on the executable to start the testing and a command prompt window will appear.
Launching from the Command Prompt
On a CMD.EXE command prompt window you can type the path and name of the executable to run it. The filename is Microsoft.Connectivity.Test.exe
Launching from Windows Task Scheduler
In Windows Task Scheduler you can add a task to launch the standalone test executable. You should specify the current working directory of the task to be where you have created the EULA accepted file since the executable will block until the EULA is accepted. You cannot interactively accept the EULA if the process is started in the background with no console.
More details on the standalone executable
The commandline tool uses Windows Location Services to find the users City State Country information for determining some distances. If Windows Location Services is disabled in the control panel then user location based assessments will be blank. In Windows Settings “Location services” must be on and “Let desktop apps access your location” must also be on.
The commandline tool will attempt to install the .NET Framework if it is not already installed. It will also download the main testing executable from the Microsoft 365 network connectivity test tool and launch that.
Test using the Microsoft Support and Recovery Assistant
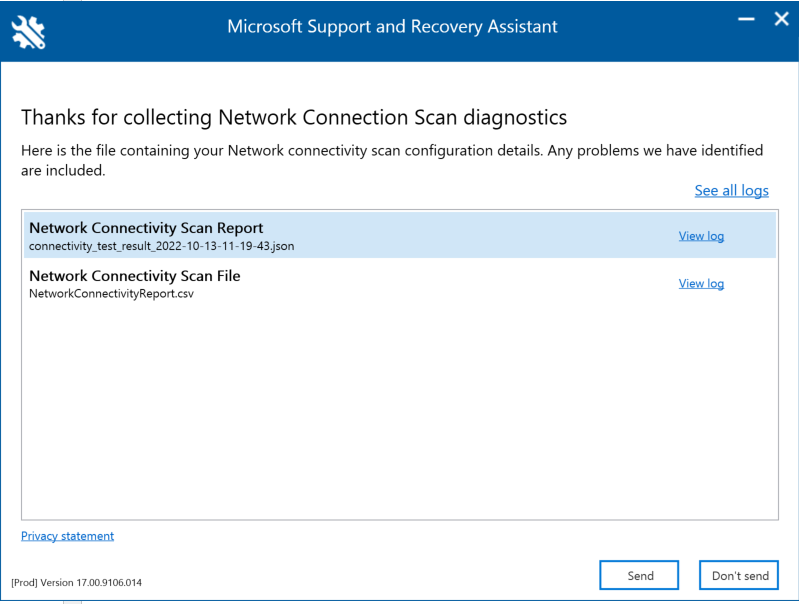
Microsoft Support and Recovery Assistant (Assistant) automates all the steps required to execute the command-line version of the Microsoft 365 network connectivity test tool on a user’s machine and creates a report similar to the one created by the web version of the connectivity test tool. Note, the Assistant runs the command line version of Microsoft 365 network connectivity test tool to produce the same JSON result file, but the JSON file is converted into .CSV file format.
The reports will be available on the below screen once the Assistant has finished scanning the user’s machine. To access these reports, simply click on the “View log” option to view them.
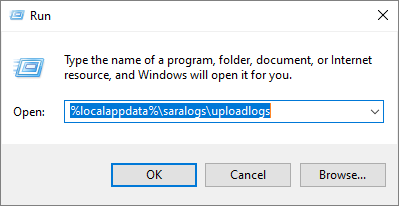
Connectivity test results and Telemetry data are collected and uploaded to the uploadlogs folder. To access this folder, use one of the following methods:
Open Run (Windows logo key + R), and run the %localappdata%/saralogs/uploadlogs command as follows:
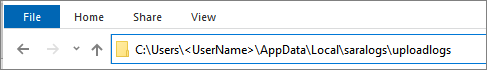
In File Explorer, type C:\Users<UserName>\AppData\Local\saralogs\uploadlogs and press Enter as follows:
Note: <UserName> is the user’s Windows profile name. To view the information about the test results and telemetry, double-click and open the files.
Types of result files
Microsoft Support and Recovery Assistant creates 2 files:
Network Connectivity Report (CSV) This report runs the raw JSON file against a rule engine to make sure defined thresholds are being met and if they are not met a “warning” or “error” is displayed in the output column of the CSV file. You can view the NetworkConnectivityReport.csv file to be informed about any detected issues or defects. Please see What happens at each test step for details on each test and the thresholds for warnings.
Network Connectivity Scan Report (JSON) This file provides the raw output test results from the command-line version of the Microsoft 365 network connectivity test tool (MicrosoftConnectivityTest.exe).
FAQ
Here are answers to some of our frequently asked questions.
What is required to run the advanced test client?
The advanced test client requires .NET 6.0 Runtime. If you run the advanced test client without that installed you will be directed to the .NET 6.0 installer page. Be sure to install from the Run desktop apps column for Windows. Administrator permissions on the machine are required to install .NET 6.0 Runtime.
The advanced test client uses SignalR to communicate to the web page. For this you must ensure that TCP port 443 connectivity to connectivity.service.signalr.net is open. This URL isn’t published in the https://aka.ms/o365ip because that connectivity isn’t required for a Microsoft 365 client application user.
What is Microsoft 365 service front door?
The Microsoft 365 service front door is an entry point on Microsoft’s global network where Office clients and services terminate their network connection. For an optimal network connection to Microsoft 365, It’s recommended that your network connection is terminated into the closest Microsoft 365 front door in your city or metro.
Note
Microsoft 365 service front door has no direct relationship to the Azure Front Door Service product available in the Azure marketplace.
What is the best Microsoft 365 service front door?
A best Microsoft 365 service front door (formerly known as an optimal service front door) is one that is closest to your network egress, generally in your city or metro area. Use the Microsoft 365 network performance tool to determine location of your in-use Microsoft 365 service front door and the best service front door(s). If the tool determines your in-use front door is one of the best ones, then you should expect great connectivity into Microsoft’s global network.
What is an internet egress location?
The internet egress Location is the location where your network traffic exits your enterprise network and connects to the Internet. This is also identified as the location where you have a Network Address Translation (NAT) device and usually where you connect with an Internet Service Provider (ISP). If you see a long distance between your location and your internet egress location, then this may identify a significant WAN backhaul.


 NOTE: All the APIs required for configuring Port Forwarding will be listed in this Article.


 TIP: If you are creating only one Address Object then the First command should be sufficient, if you are creating multiple address objects then the second command should be used.
 CAUTION: I have the add.Json file saved on to my desktop and hence I was able to call it into the command, if you have created the Json the file in a different location then make sure you are executing the command from that location.