You can configure UniFi Protect location-based activity notifications so you are only notified when the user(s) are off-site. This article outlines the steps needed to set this up for your account.
In the UniFi OS settings, go to Console Settings > Time Zone / Location>Edit Location on Map.
Search for the Address or drag your UOS Console to the correct location.
Adjust the Geofencing Radius slider to define your console’s on-site radius (i.e, “geofence”).
Click Apply Changes when you’ve set the desired geofence.
If you experience unexpected status changes while on site, increase the geofence’s radius.
Configure your primary mobile device
Your primary mobile device will be the one used to determine whether you are on or off-site (i.e., within the geofence).
To configure your primary mobile device:
Make sure cellular data is enabled on your mobile device.
Make sure that the UniFi Protect mobile app has proper location permissions:
For iOS devices, set the Protect mobile app’s Location Setting permission to Always. Precise Location should also be enabled.
For Android devices, make sure that Protect mobile app’s location access is set to Allow all the time.
Open the Protect mobile app, tap the Settings icon on the bottom-left corner of the screen followed by Primary Device; then, select the desired mobile device from the list.
To activate your UniFi OS Console’s geofence, use the Protect mobile app to go to Settings > UniFi OS Console > Network and enable the Geofencing toggle.
Configure location-based activity notifications
After you’ve configured the locations of your UniFi OS Console and primary mobile device, you can create activity notifications using your UniFi Protect web application or mobile app.
To create activity notifications using the UniFi Protect mobile app:
Go to Settings > Notificationsto create a new activity notification or edit an existing one.
Select from Off, Default, or Custom.
If you choose Custom, click the Activity tab to customize the notification for each camera.
To create or edit activity notifications using the Protect web application:
Log in and go to Settings > Notifications > Activity.
Adjust When to Send> Location Based to receive notifications when you are off site (When I’m Away) or when all users are off site (When Everyone is Away).
Go back and customize the notifications for your cameras.
Troubleshooting inaccurate location tracking
The Protect mobile app uses GPS and communication with the UniFi OS Console to provide an accurate location.
If you are experiencing location inaccuracies, follow the device-specific steps below to improve the mobile app’s location tracking:
For iOS / iPadOS devices:
Disable Low Power mode, as it may prevent the app from sending location status updates.
Enable Background App Refresh and Cellular Data for the UniFi Protect mobile app.
Disable VPN or Mobile Hotspot if they interfere with location accuracy.
For Android devices:
Select High Accuracy mode for mobile phone location tracking, if available.
Disable data saving settings.
Disable battery optimization for the UniFi Protect mobile app by tapping Settings > Battery > Battery Optimization > Don’t Optimize.
Disable power saving mode to ensure it isn’t auto-enabled once your phone battery is low.
If your mobile has a Deep Sleep feature, disable it for the UniFi Protect mobile app to make sure you don’t receive location status updates after opening it.
There are three different types of camera zone settings you can use:
MotionZones, which tell the camera to recognize motion in specific zones and trigger certain actions, e.g. record footage and create Motion Detections for you to review later
PrivacyZones, which let you block out certain areas on the video recordings
SmartDetection (AI and G4 camera series), which let you create Events for certain types of motion, e.g. when the camera detects a person
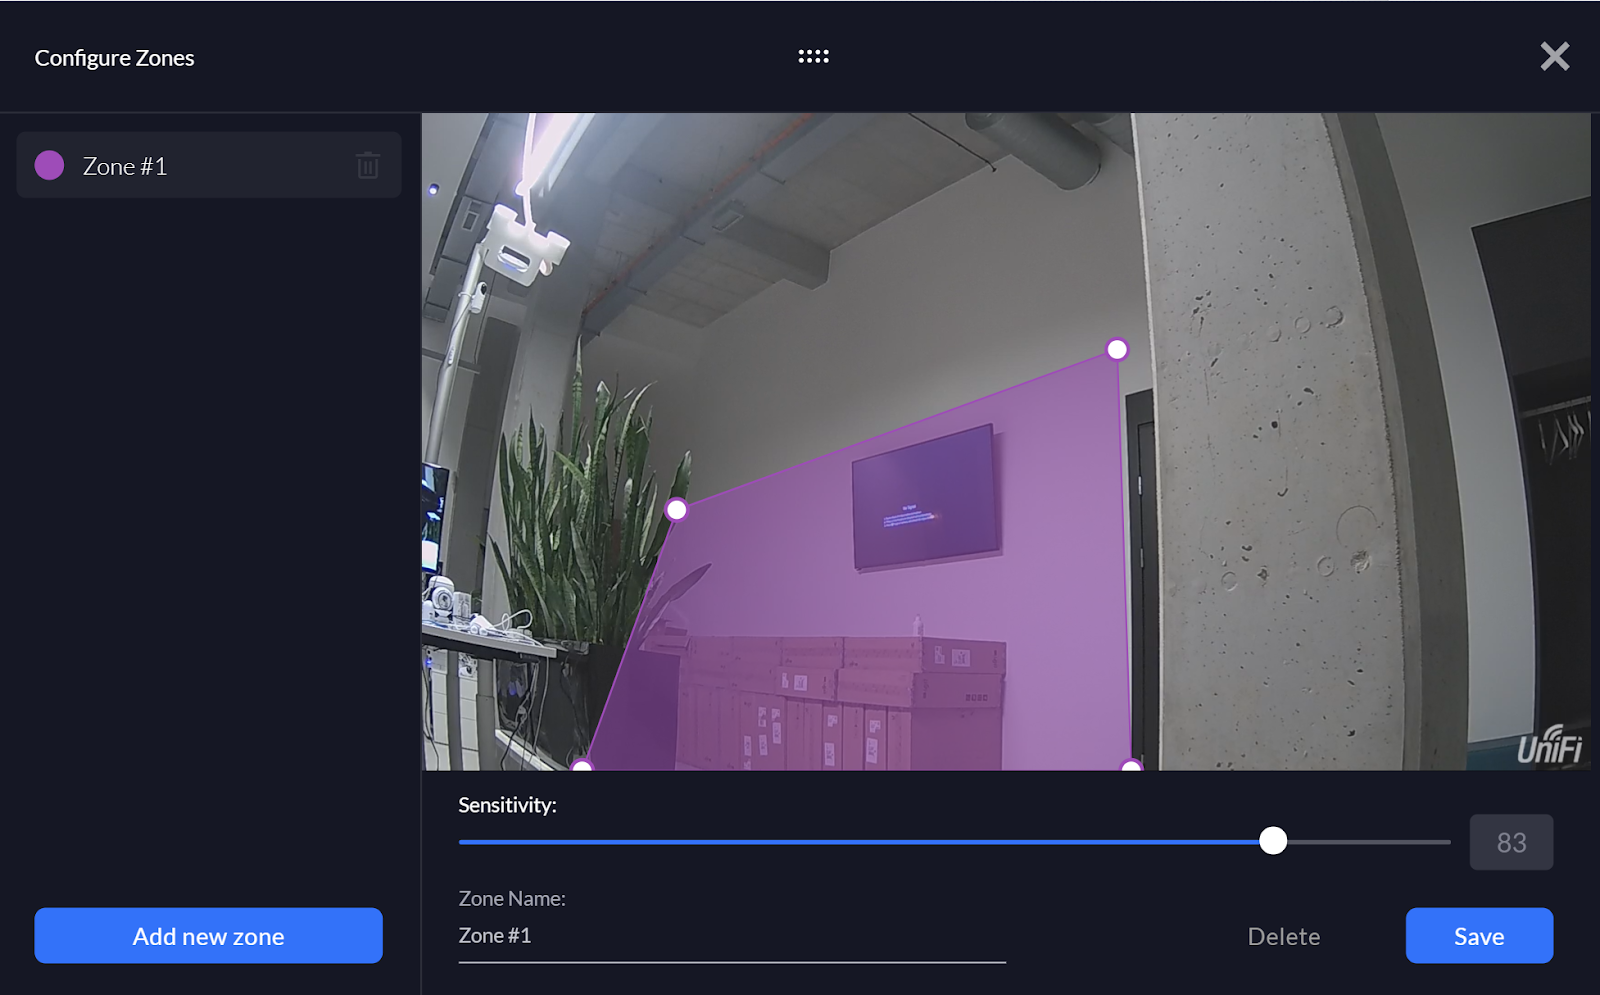
Set up motion zones
Motion zones are specific zones where the camera will detect and record motion.
To trigger and record motion events and also trigger motion alerts, the camera recording settings must be set to Always or Detections.
Go to the Devices section and select the desired camera.
On the right side panel, select Zones > Expand Motion Zones > Add Motion Zone.
Create the Motion Zone by clicking on the four corners of its perimeter. You can further adjust the corners by dragging them with your cursor.
Adjust the zone’s detection sensitivity based on your camera’s surroundings using the slider node below the feed window.”
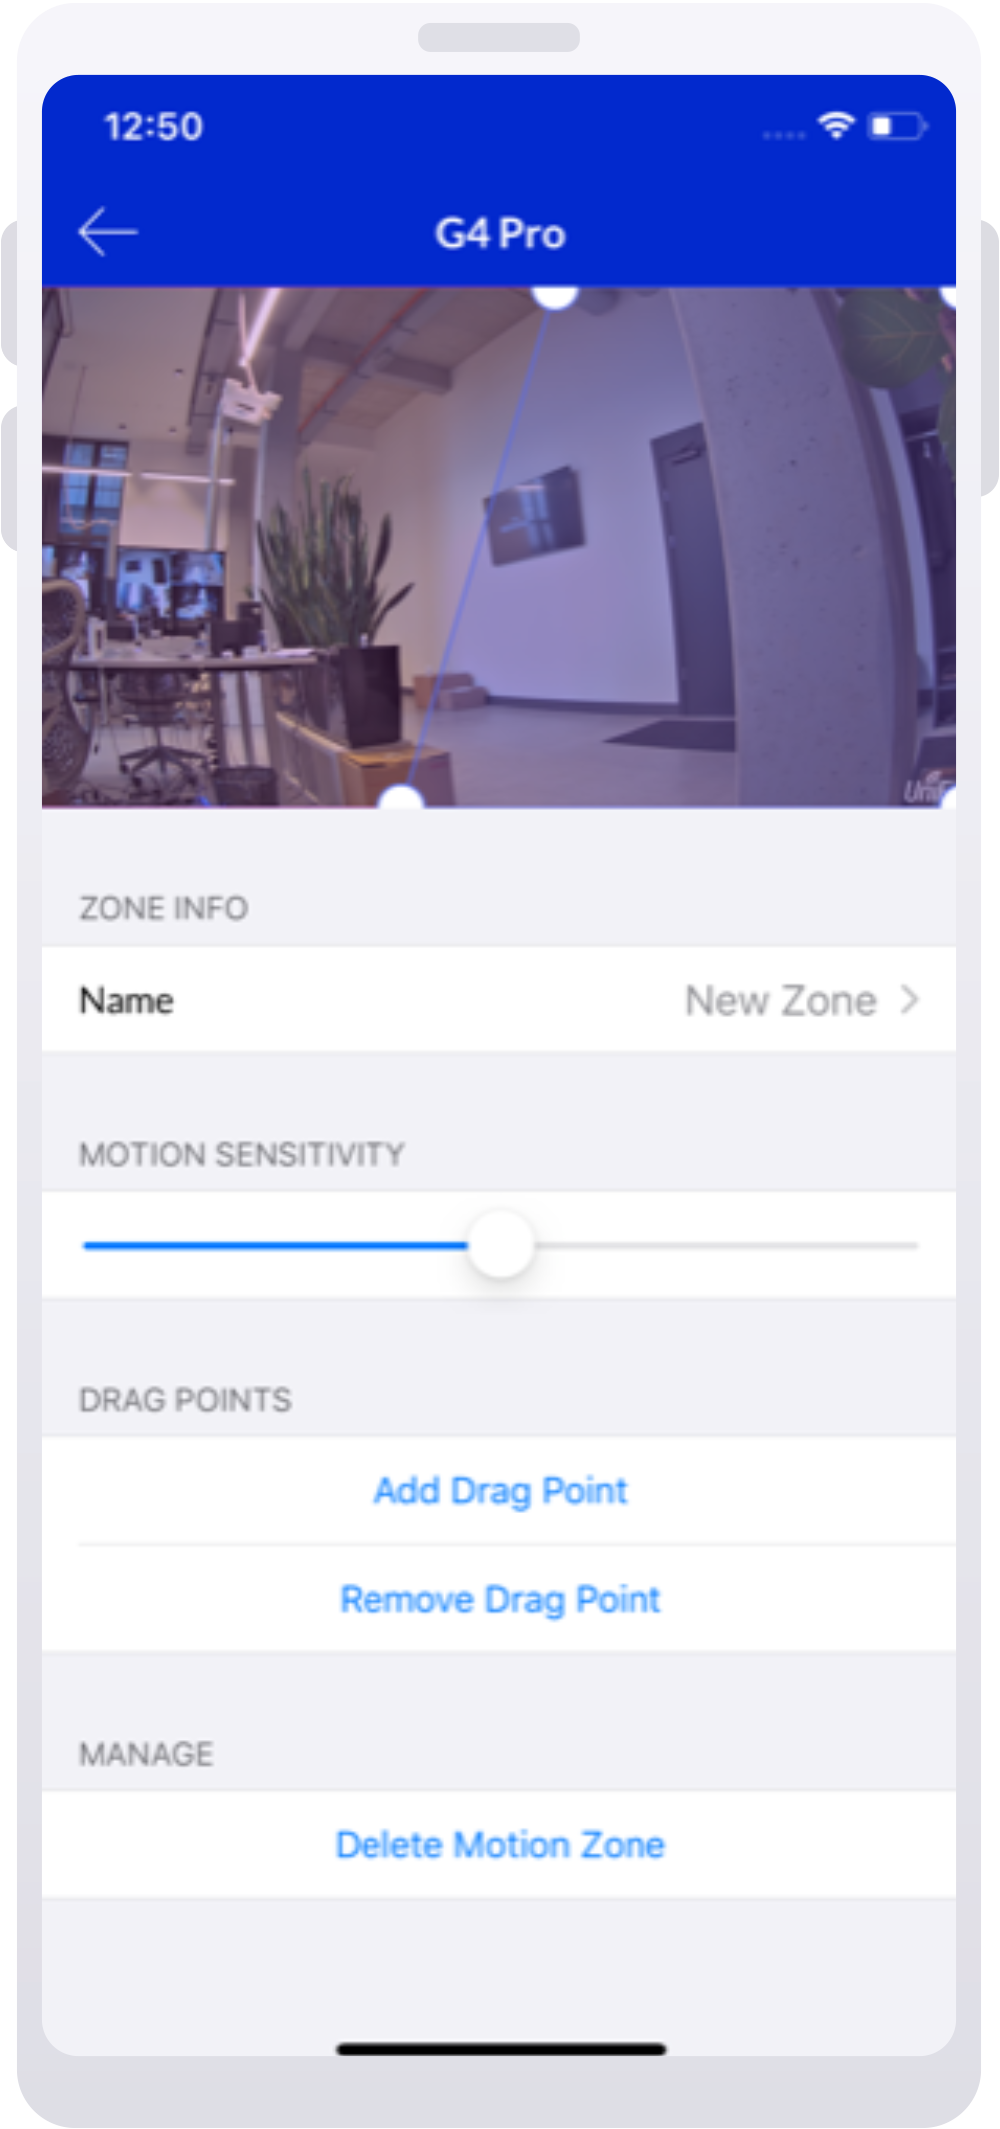
To set up a motion zone on the mobile app:
Select the desired camera on the home screen.
Tap on the Settings icon in the upper-right corner of your screen, then select Motion Zones > Add Motion Zone.
Create the Motion Zone by clicking on the four corners of its perimeter. You can further adjust the corners by dragging them with your cursor.
Adjust the zone’s detection sensitivity based on your camera’s surroundings using the slider node below the feed window.
Please note that adjusting the recording setting to Never disables motion detection recording and alerts.
When setting up zones, you can adjust the zone sensitivity. Setting a higher value will make your camera more sensitive, making it more likely to detect and log more subtle motions (e.g., small object movements).
If you’re getting an increased amount of motion events due to minor movements such as moving branches, decrease zone sensitivity to prevent excessive minor motion event logging.
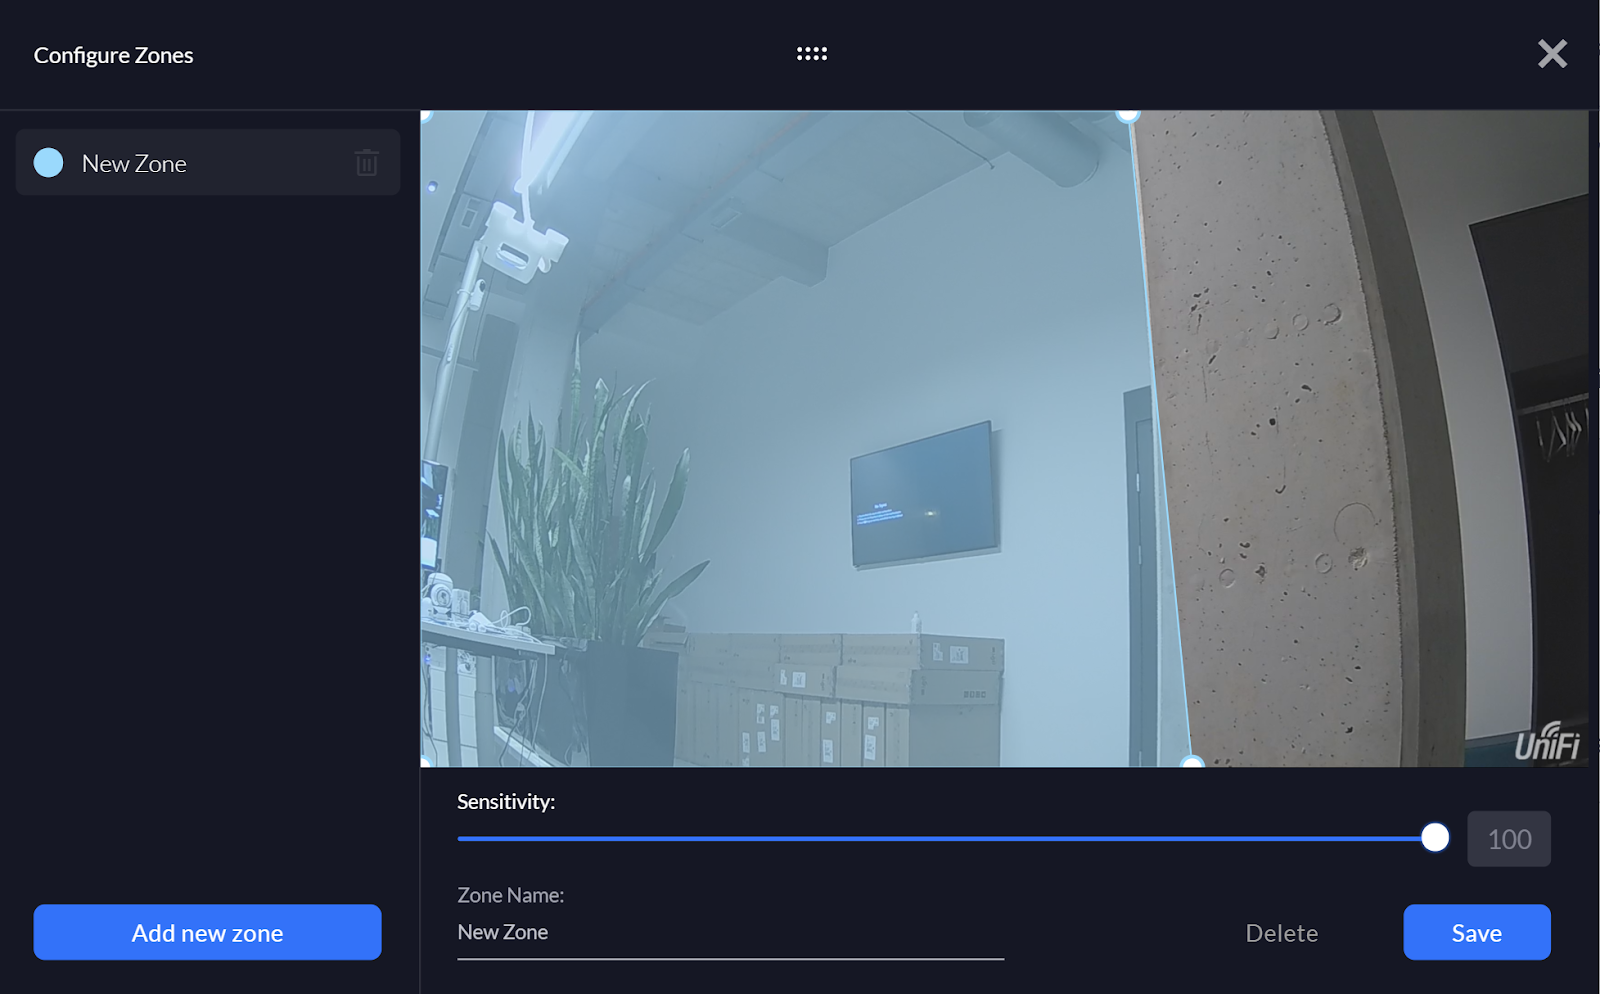
Set up Smart Detection zones
Smart Detection Zones create events when specific motions are detected (e.g., a person’s movement).
Currently Smart Detection zones only supports person detection, meaning that you will only be notified when this specific motion event occurs.
The Smart Detection feature is only available for G4 and AI series cameras, except for G4 Instant.
To set up Smart Detection zones:
Go to Devices > Propertiespanel > Recordings and enable Person detection.
Go to the Zones section, click Add new zone, and name it.
Create the Smart Detection Zone by clicking on the four corners of its perimeter. You can further adjust the corners by dragging them with your cursor.
Adjust the zone’s detection sensitivity based on your camera’s surroundings using the slider node below the feed window.
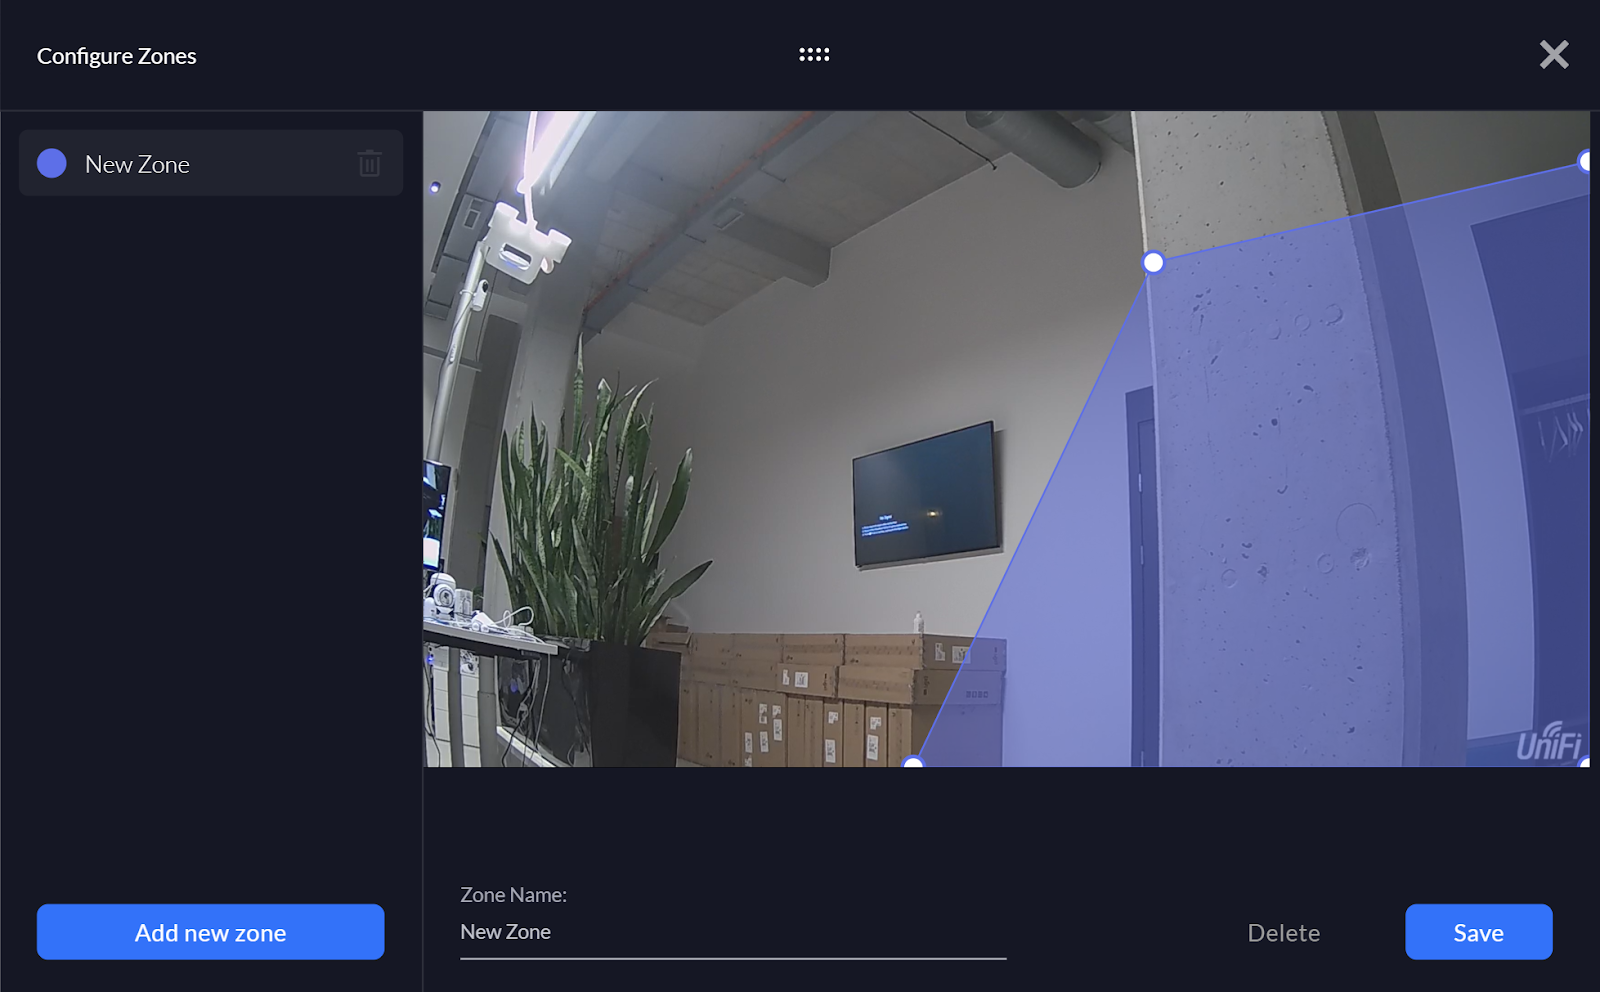
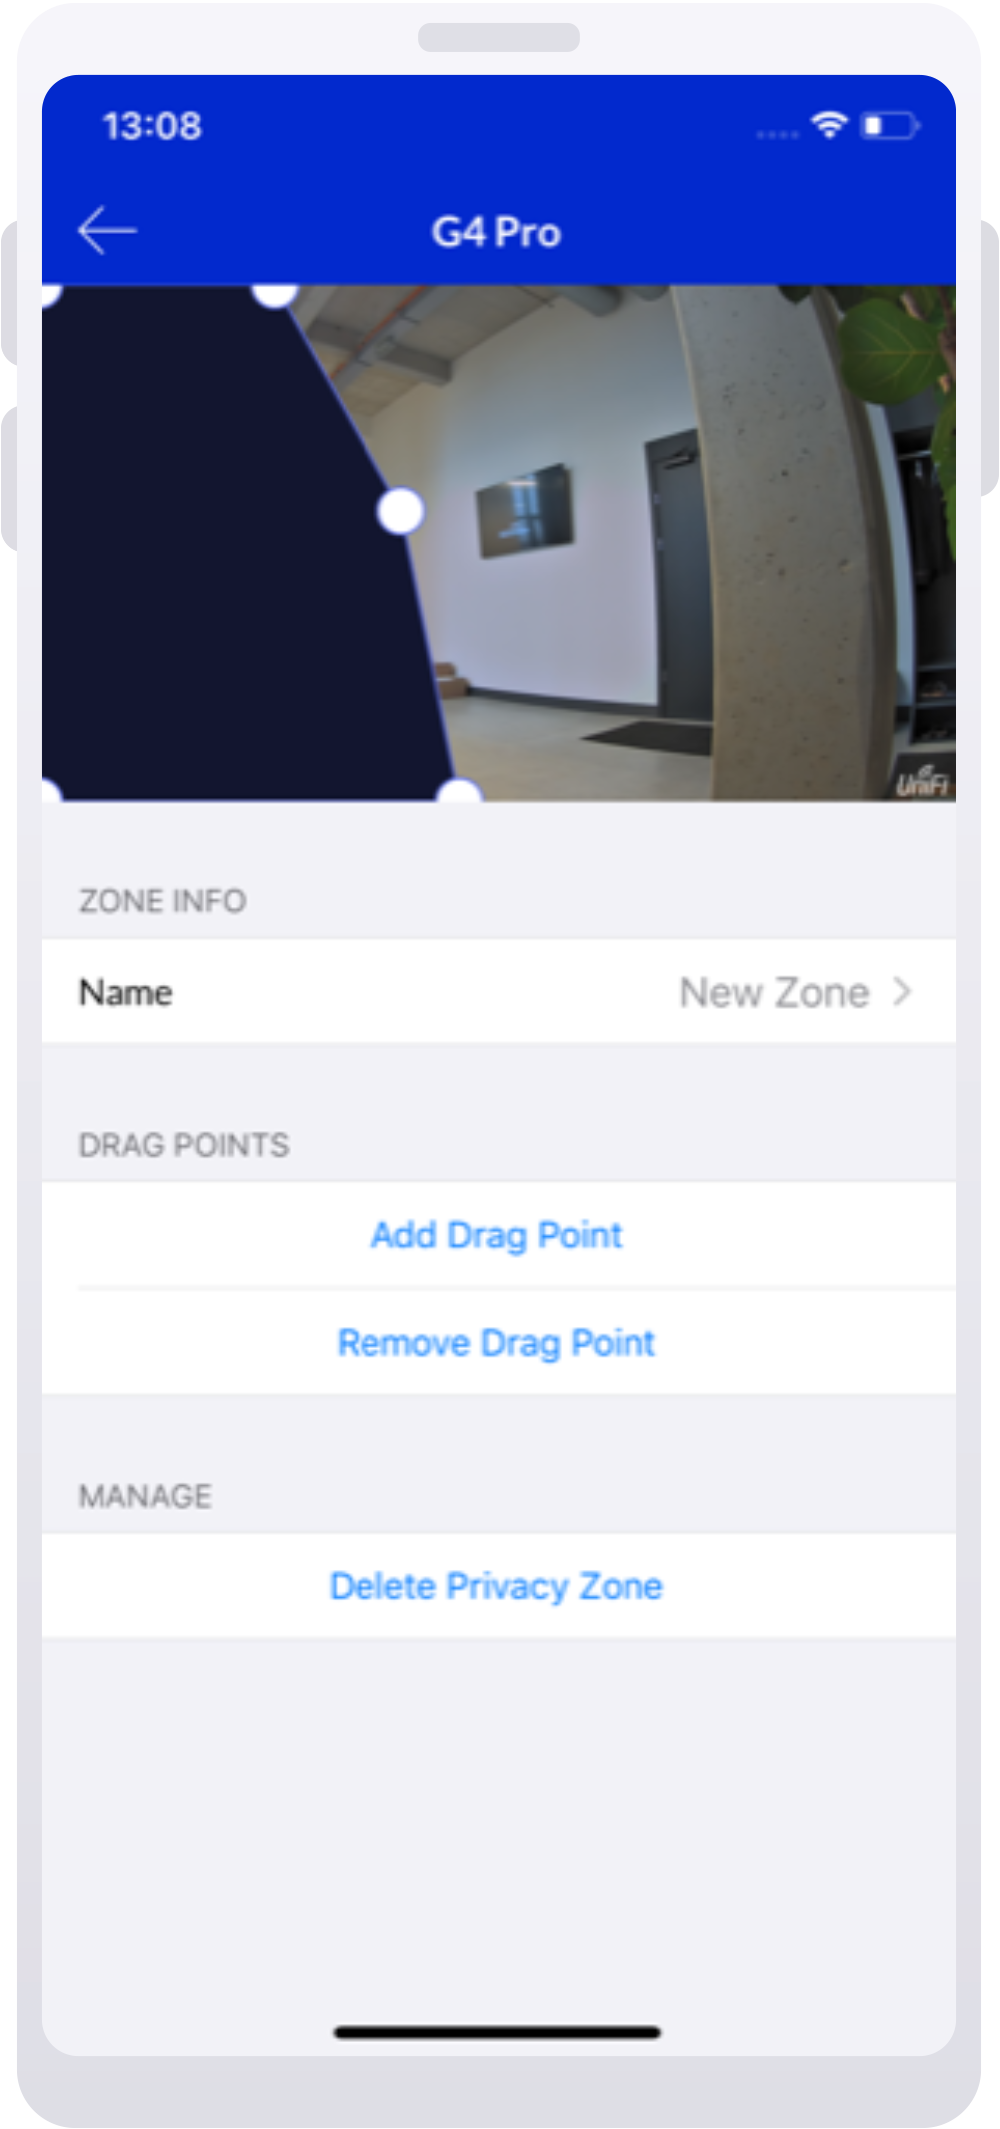
Set up privacy zones
You can set privacy zones for each of your cameras, which block live playback and recordings of content within the specified area. Instead, you will see a blacked-out image.
To set up a privacy zone on the web application:
Go to the Devices section and select the desired camera.
On the right side panel, select Zones > Expand Privacy Zones > Add Privacy Zone.
Create the Privacy Zone by clicking on the four corners of its perimeter. You can further adjust the corners by dragging them with your cursor.
To set up a privacy zone on the mobile app:
Select the desired camera on the home screen.
Tap on the Settings icon in the upper-right corner of your screen, then select Privacy Zones > Add Privacy Zone.
Create the Privacy Zone by clicking on the four corners of its perimeter. You can further adjust the corners by dragging them with your cursor.
The UniFi Protect mobile and web applications allow you to view live and recorded footage as well as adjust the image and video playback quality.
Live View
By default, the video bitrate of your cameras is automatically reduced during prolonged periods of low motion frequency in order to reduce storage utilization. You may choose a specific resolution by changing the Viewer Quality to Low or High on the Protect web application by hovering over the Live View, or on the mobile app within the Live View’s specific settings.
Note: If your bandwidth is limited, you may experience unstable playback while viewing a high quality live feed.
Recordings and Detections
Your recording’s duration and quality will depend on the camera’s Recording Mode. The When to Record setting can be set to Always, Never or Detections. Image quality and frame rate can be adjusted using the Recording Quality setting.
Note that:
A higher frame rate will give you smoother video playback while a lower frame rate will ensure better picture quality.
Recording with higher image quality will require more storage space than lower quality ones.
You can download the Detection clips from the mobile app by tapping the Share icon > Export clip, or from the web application by selecting the detection and clicking the Download icon.
Adjust the Camera Picture Settings
Most image quality issues can be resolved by adjusting the camera picture settings, which are specific to each camera and found within Devices > select a camera > Settings.
The camera’s image is dull, dark, or distorted
To correct imagery that appears dark, dull, or distorted:
Open the camera’s settings and select Adjust Camera Picture.
Adjust the Brightness, Contrast, and Hue settings for the camera.
Note: There is no definite way of setting this for all cameras in any environment. Try adjusting these settings to achieve the desired image quality outcome.
The camera recording quality is low
To improve a camera’s recording quality, open its Recording Mode settings and increase the Frame Rate and Image Quality settings as described above.
The camera’s image is harshly lit
Harsh lighting creates a strong contrast that can make it difficult to see smaller, finer details in your live feeds and recordings. To resolve this, try enabling the HDR feature (or WDR depending on the camera model) in the Camera Picture settings.
The camera is out of focus (G3 Pro, G4 Pro, G4 PTZ cameras only)
If your G3 Pro, G4 Pro, or G4 PTZ cameras appear to be out of focus:
Make sure there are no objects between the camera and its focal point that may affect its ability to auto-focus.
Try manually setting the focal point with the Focus Camera Picture setting.
The camera isn’t switching to Night (IR) Mode
If your cameras are not switching to Night (IR) mode, or are rapidly alternating between Night and Day Mode, verify that:
Each camera’s infrared setting is set to Auto.
There are no external light sources, such as ambient lights in front of a camera, affecting integrated light sensors.
There are no obstructions near the front of the camera. Obstructions can cause the camera’s infrared light to reflect back at its sensor, causing it to switch back and forth between Night and Day Modes.
Night (IR) Mode imagery is blurry
If your Night (IR) Mode imagery is blurry:
Carefully clean your camera’s lens or dome using a soft cloth and isopropyl alcohol. The alcohol’s concentration should not exceed 70%; otherwise, you risk damaging its surface. Be sure to remove all residue to prevent unwanted reflections.
Ensure that no obstructions near the camera’s lens are causing IR reflections.
(For Dome cameras) Make sure that the dome cover is tightly secured to the lens housing. The rubber gasket should be firmly fastened to the dome’s surface and the dome should be in the locked position.
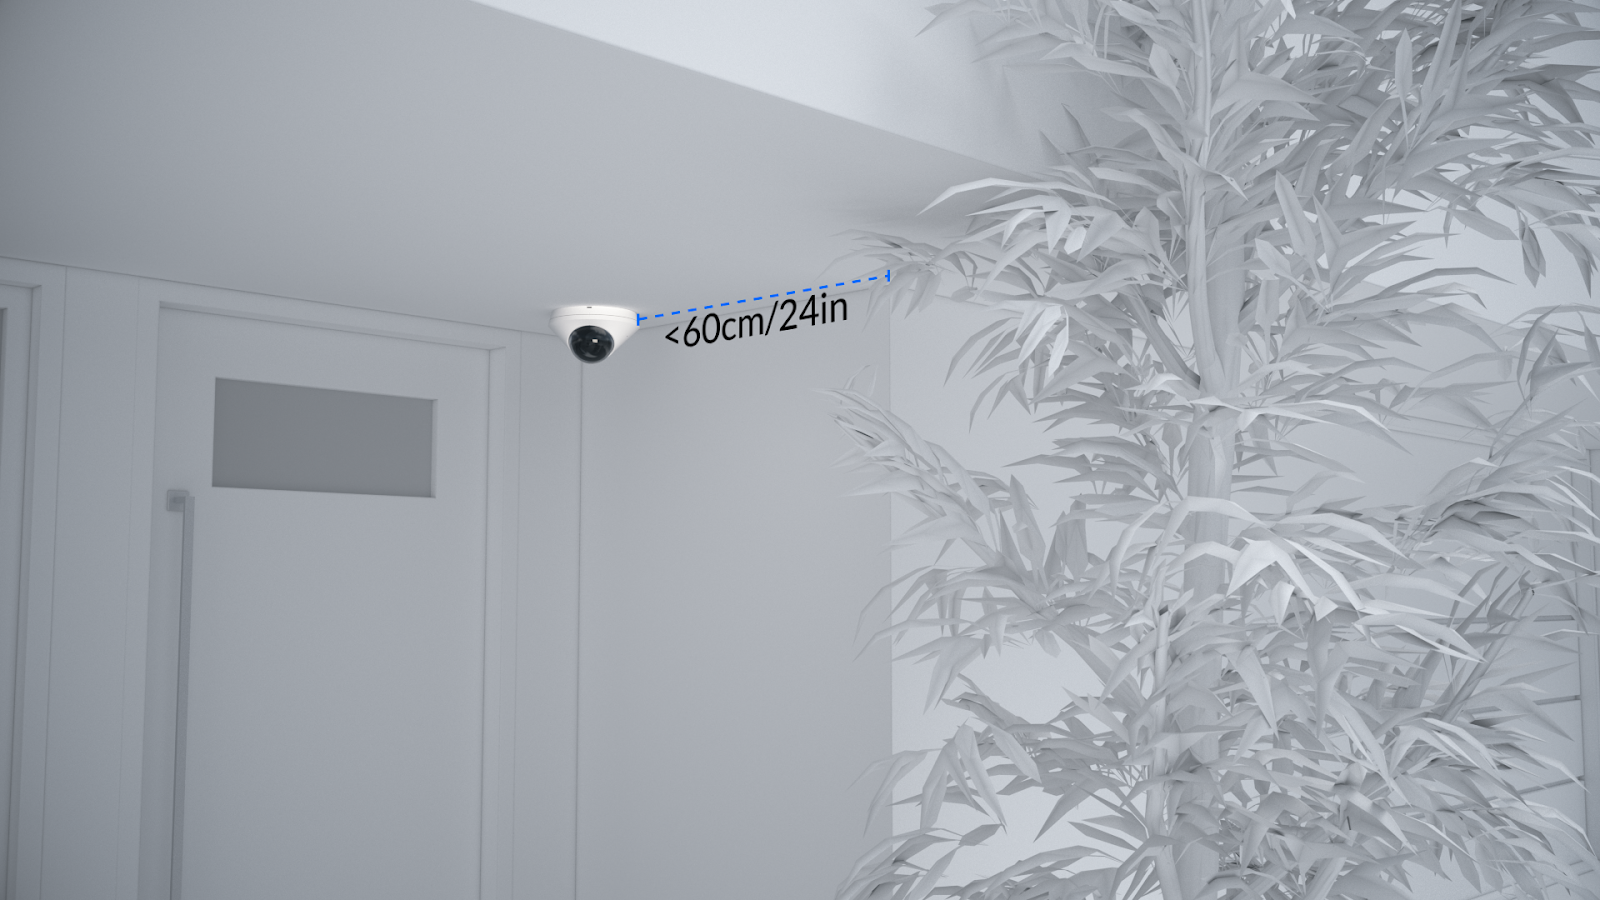
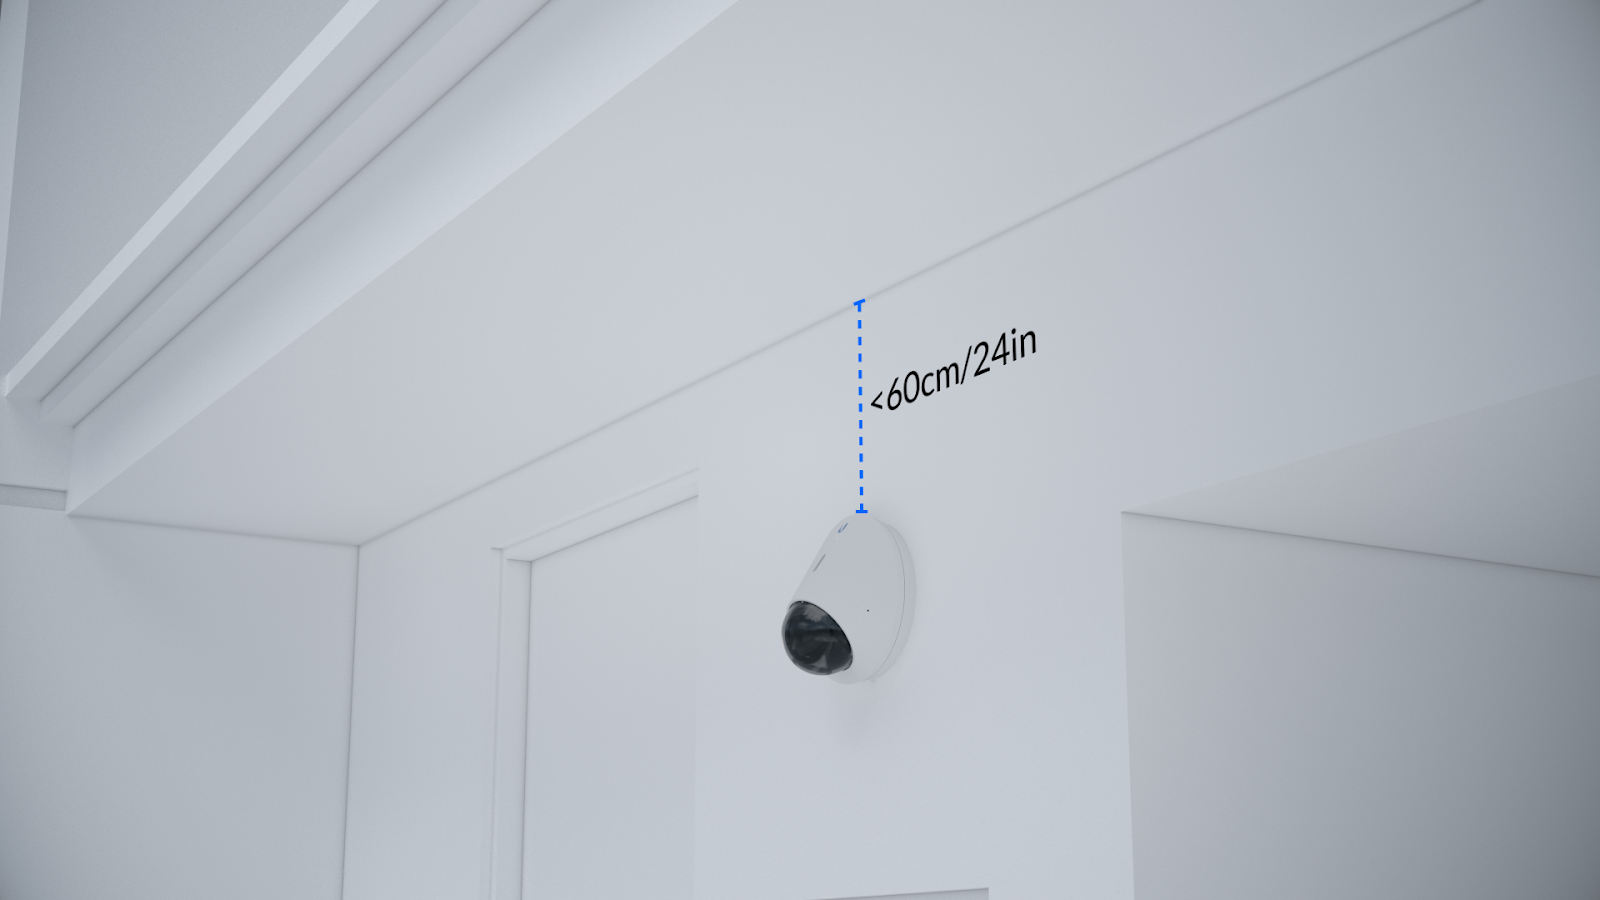
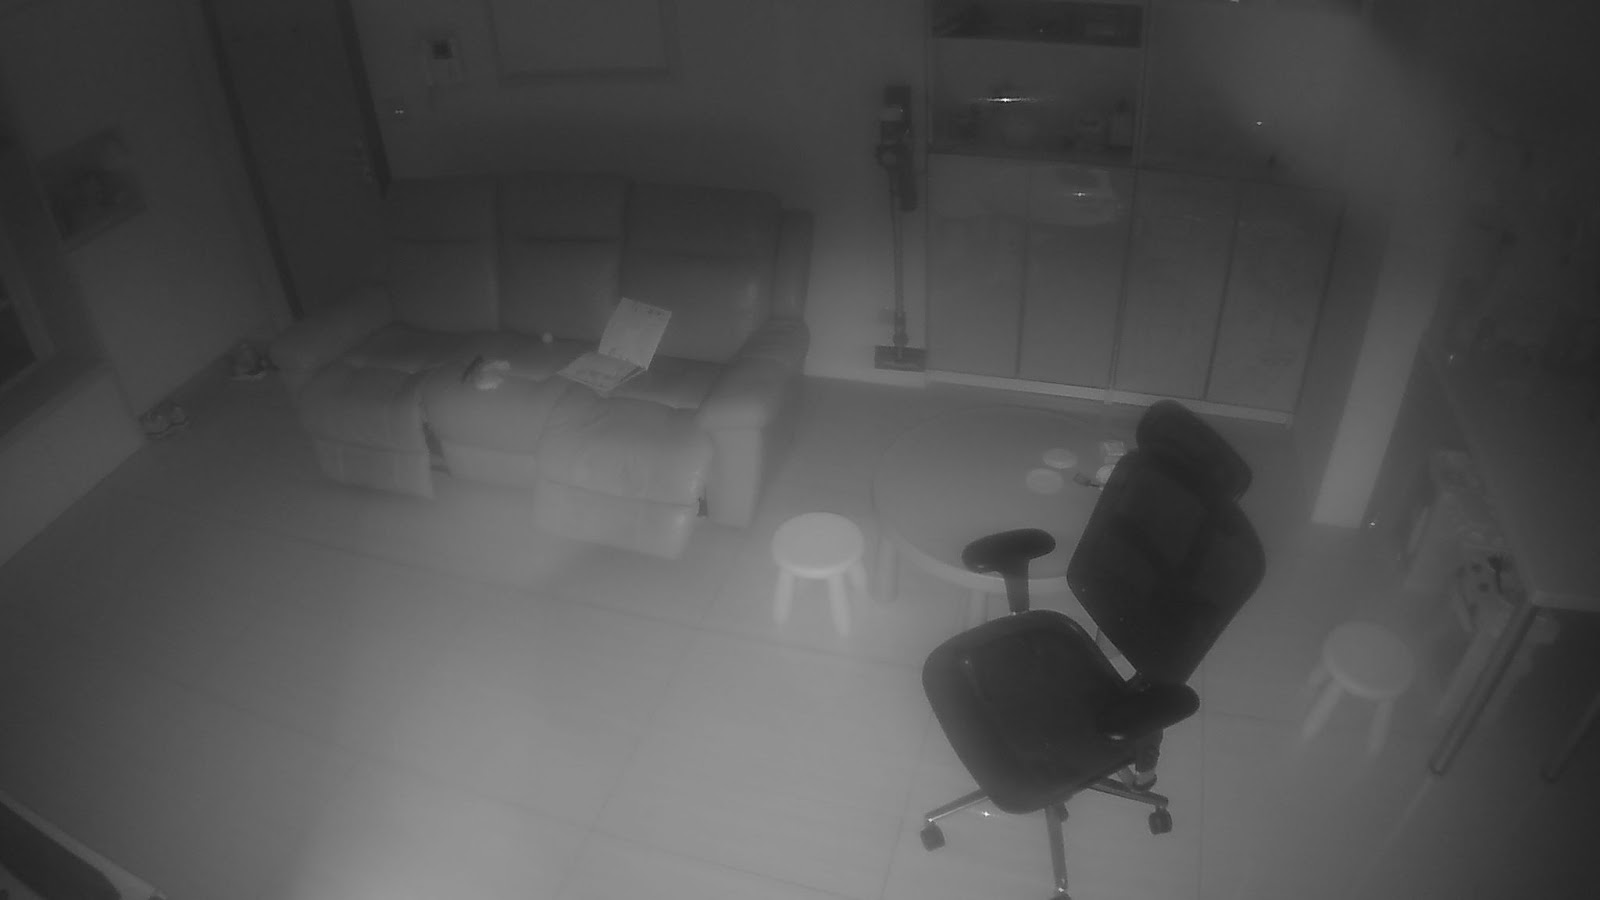
The G4 Dome camera is equipped with infrared LEDs to give it night vision. However, some factors may cause these LEDs to produce glares on the camera’s feed. The most common causes of glaring and poor resolution are:
Per its installation guide, the G4 Dome should be installed at least 60 centimeters (cm), or 24 inches, away from neighboring walls and the ceiling. If nearby objects or fixtures, such as a wall corner or overhang, are closer than that, they may reflect infrared light into the camera and create a glare.
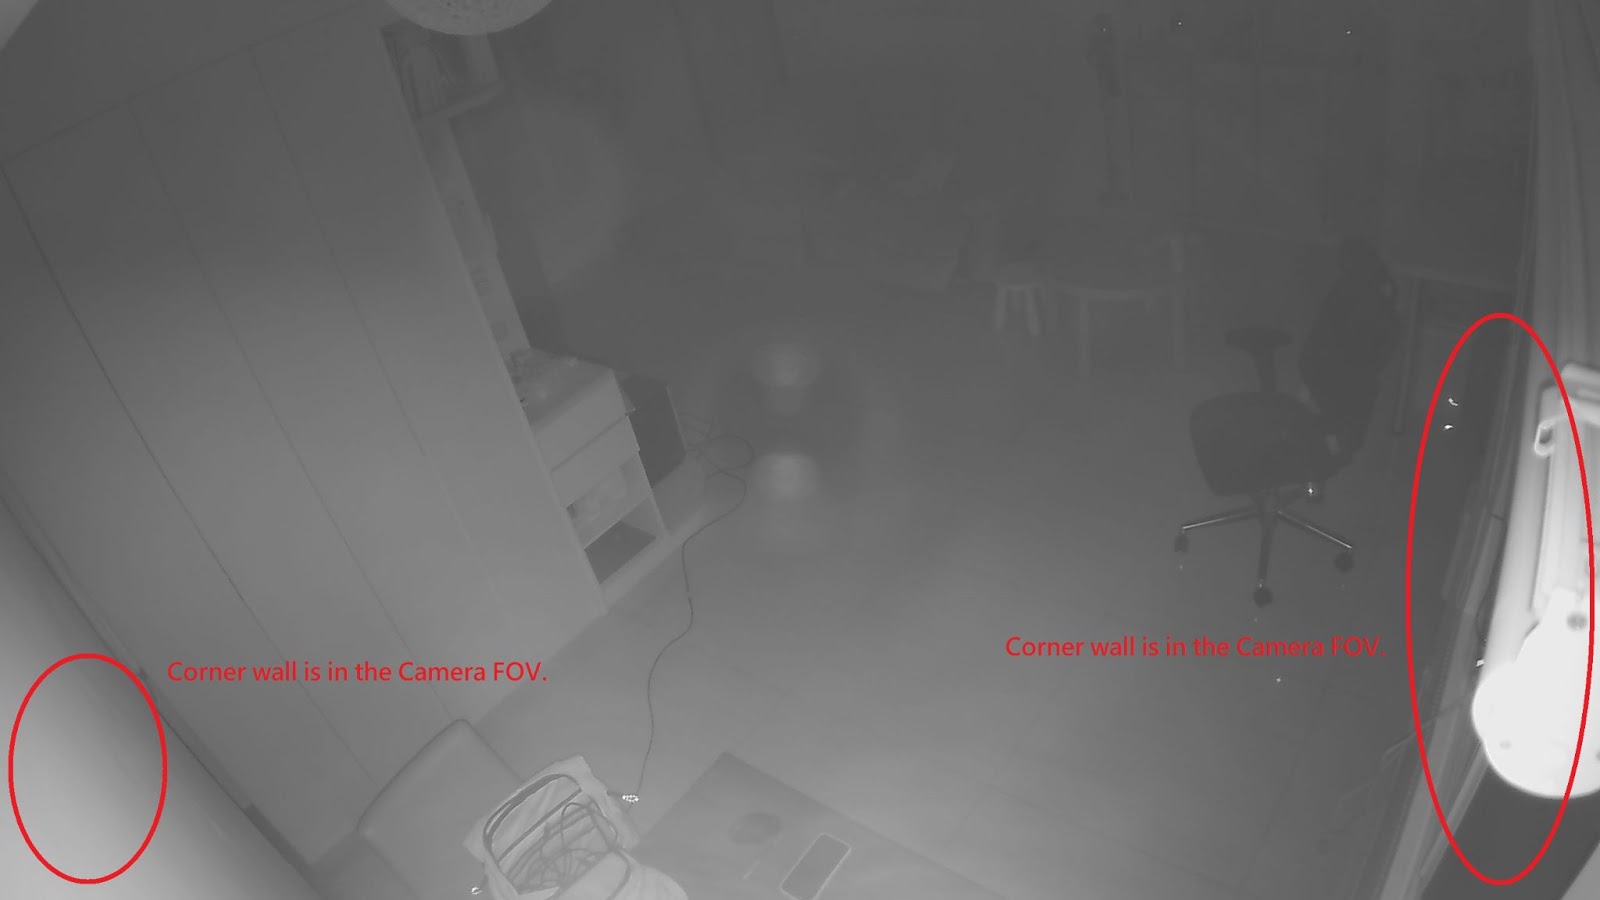
Ceiling-mounting near a wall corner
Below, you can see how mounting the G4 Dome to the ceiling with objects in the foreground can result in poor image quality.
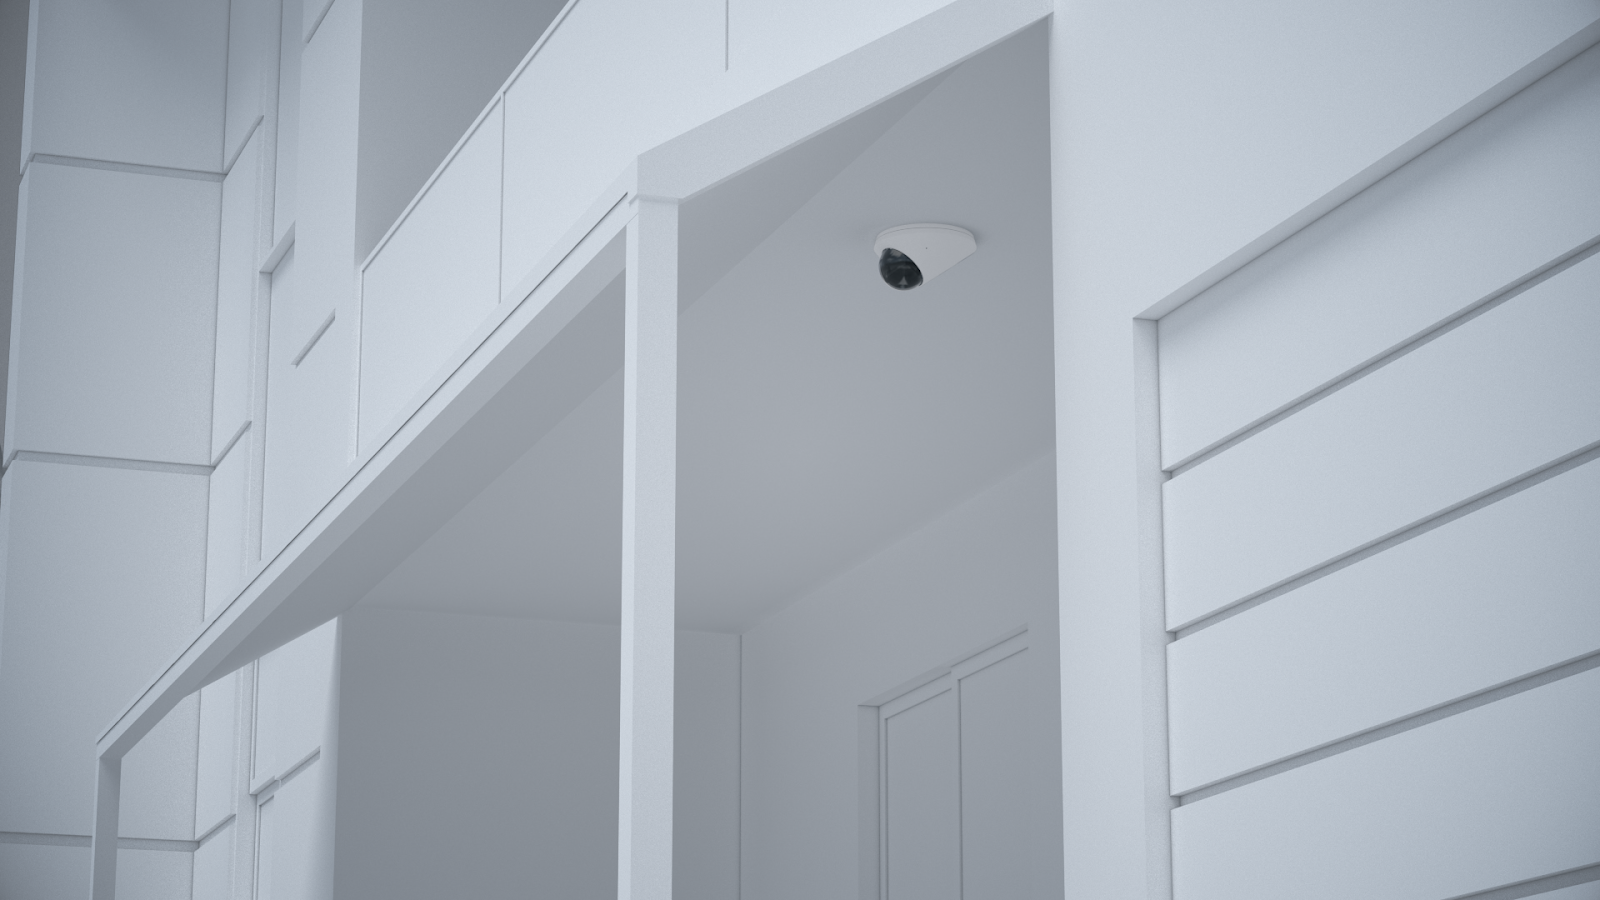
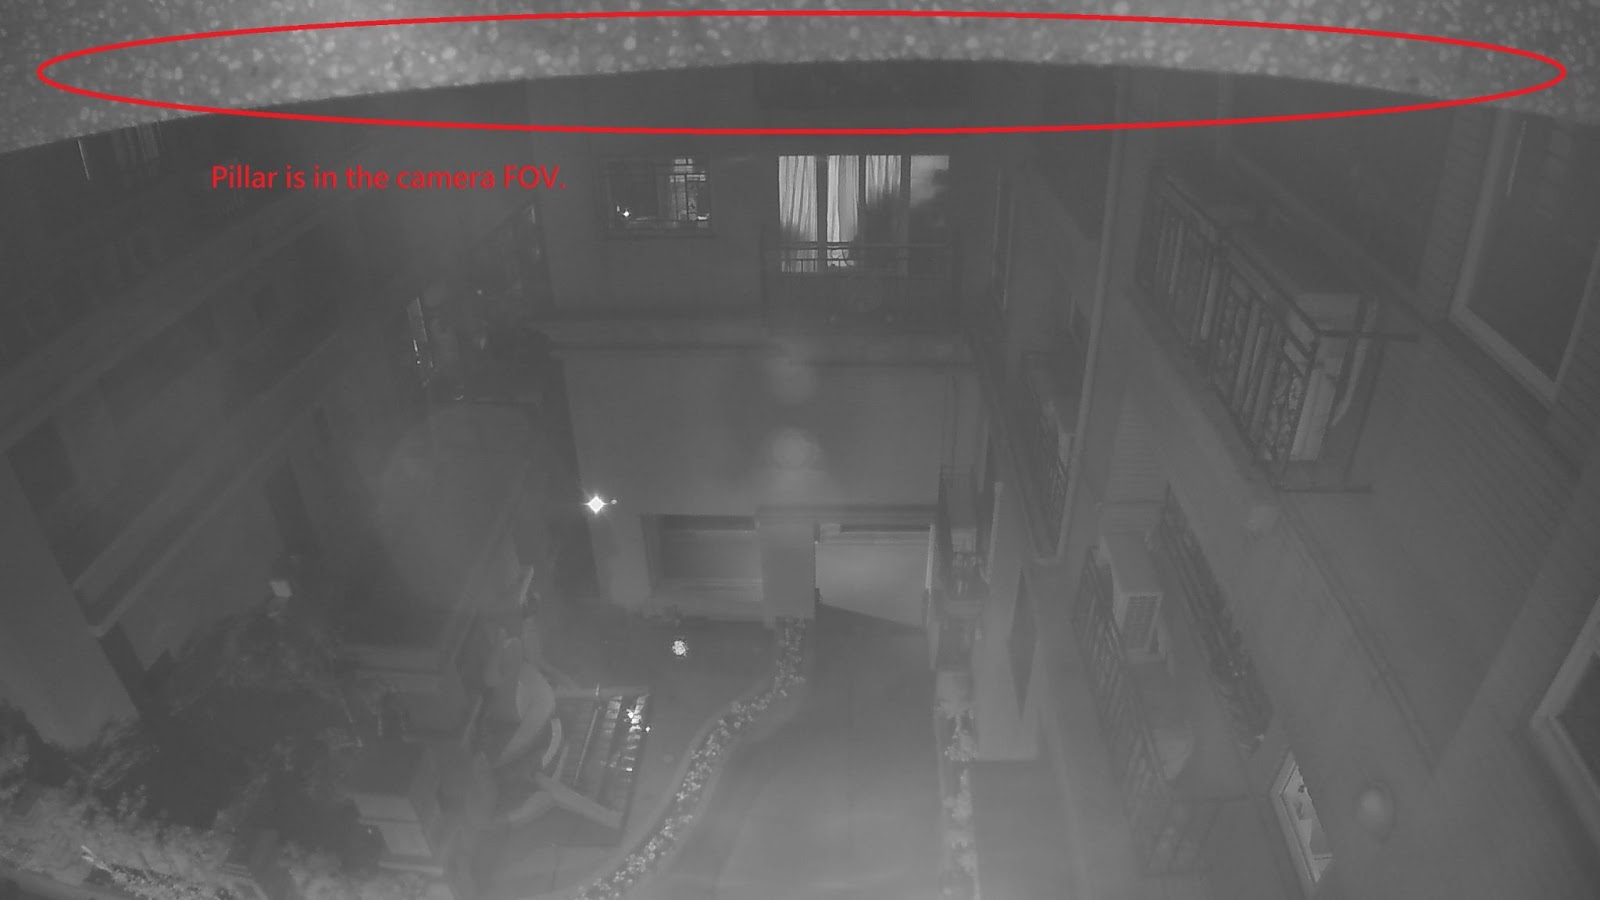
Ceiling-mounting near overhangs
The camera below is too close to the pillar so it appears in the camera’s field of view (FoV).
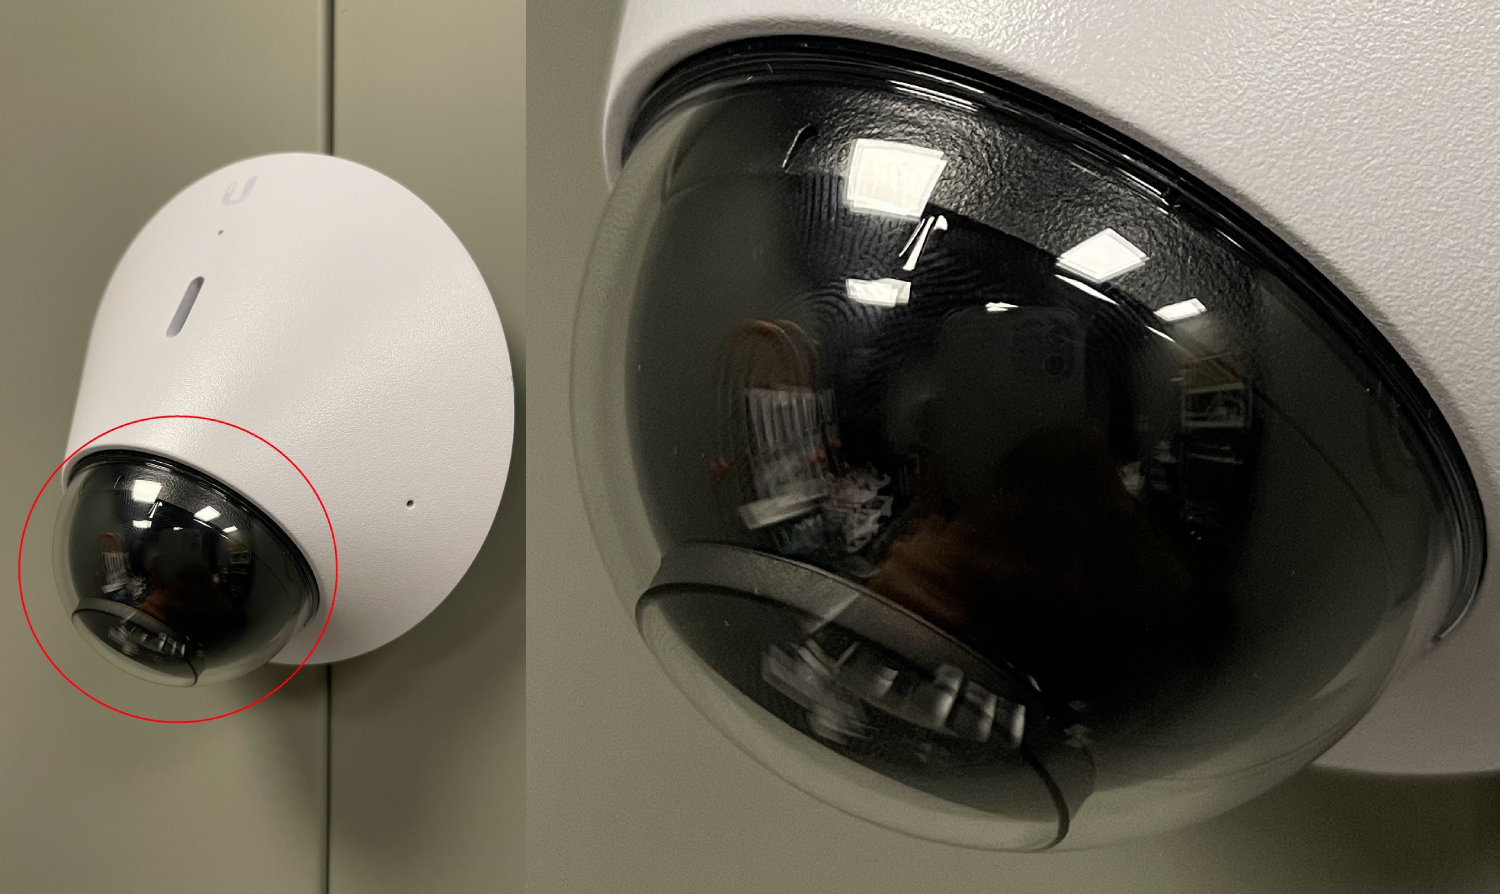
Wall-mounting too close to the ceiling
The camera below doesn’t have at least 60 cm of separation from the ceiling and its image quality is diminished as a result.
Residue on the bubble cover or lens
While installing the G4 Dome, its lens and bubble cover may collect dust, oil stains, and fingerprints. This can also occur if you wipe the lens or bubble cover incorrectly.
If there is residue on the G4 Dome’s lens or bubble cover, clean them with either lens wipes, a lens cloth with a lens cleaning solution, or a soft cleaning cloth and rubbing alcohol. Continue to do this periodically to prevent distorted image quality due to dirty lens and cover surfaces.
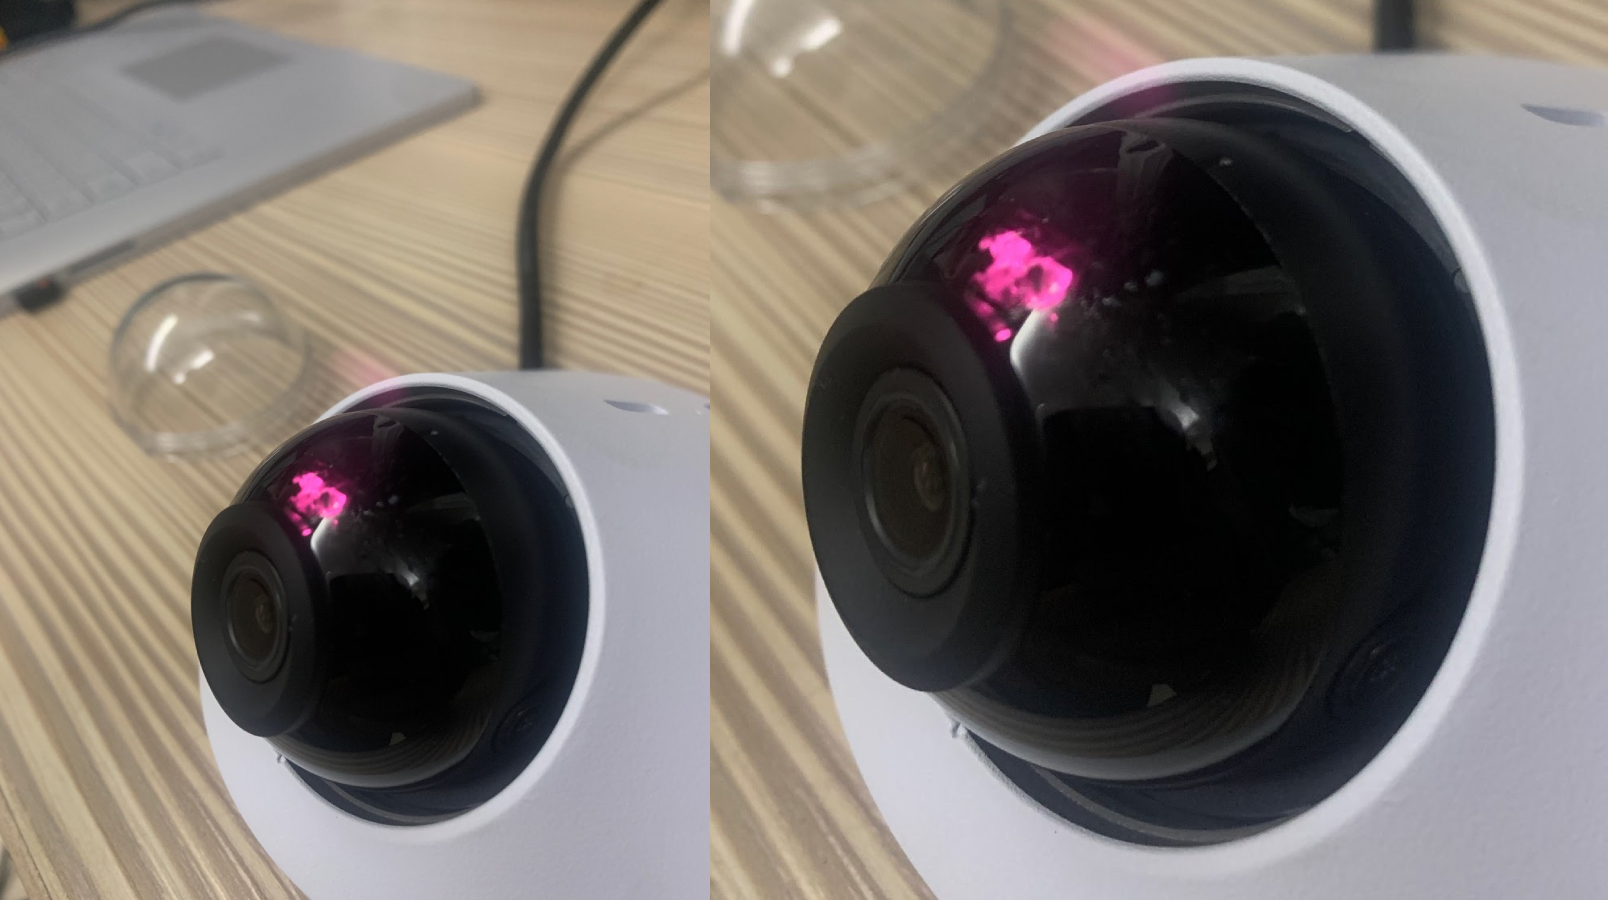
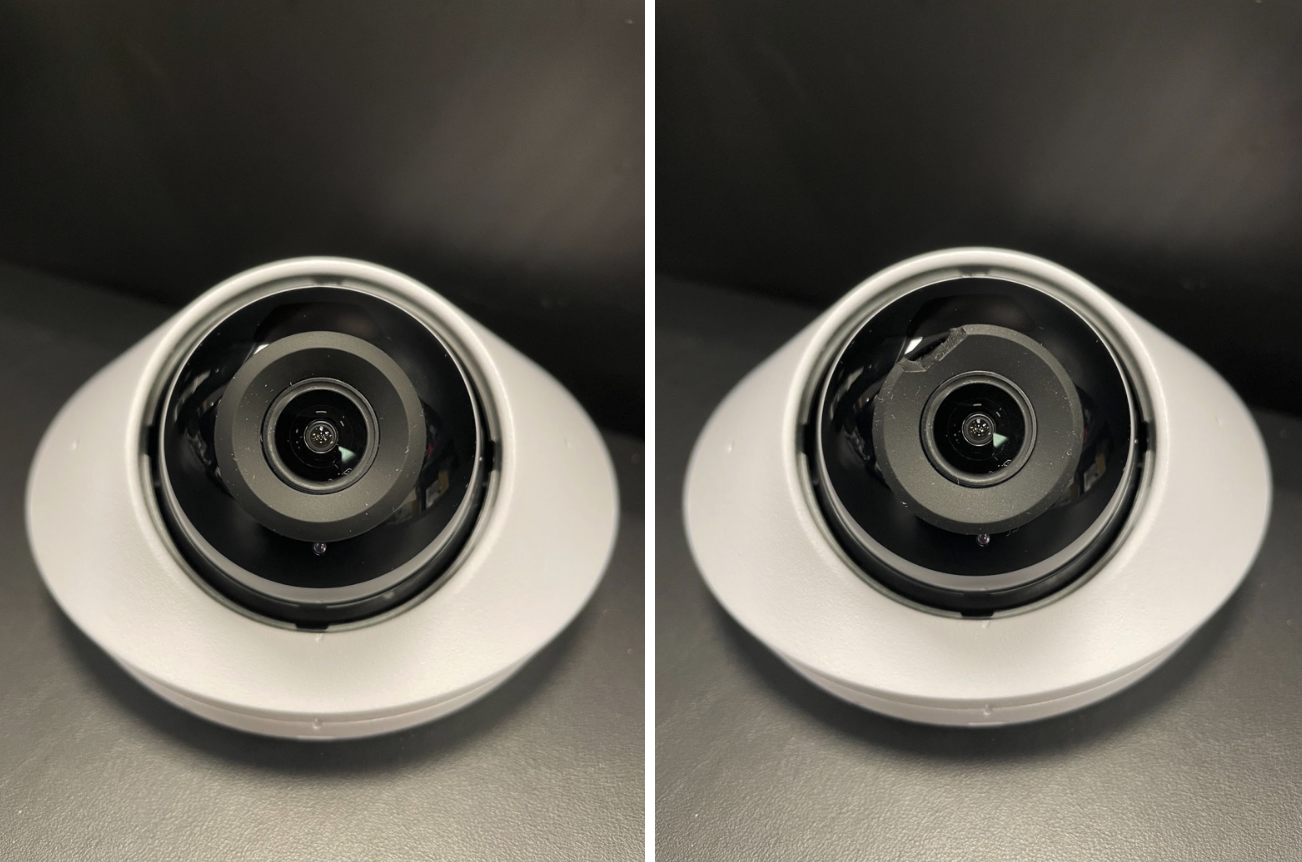
Oil stains or fingerprints on the bubble cover or lens
When oil stains stick to the bubble cover or lens, the infrared lights become diffused by the foggy surface.
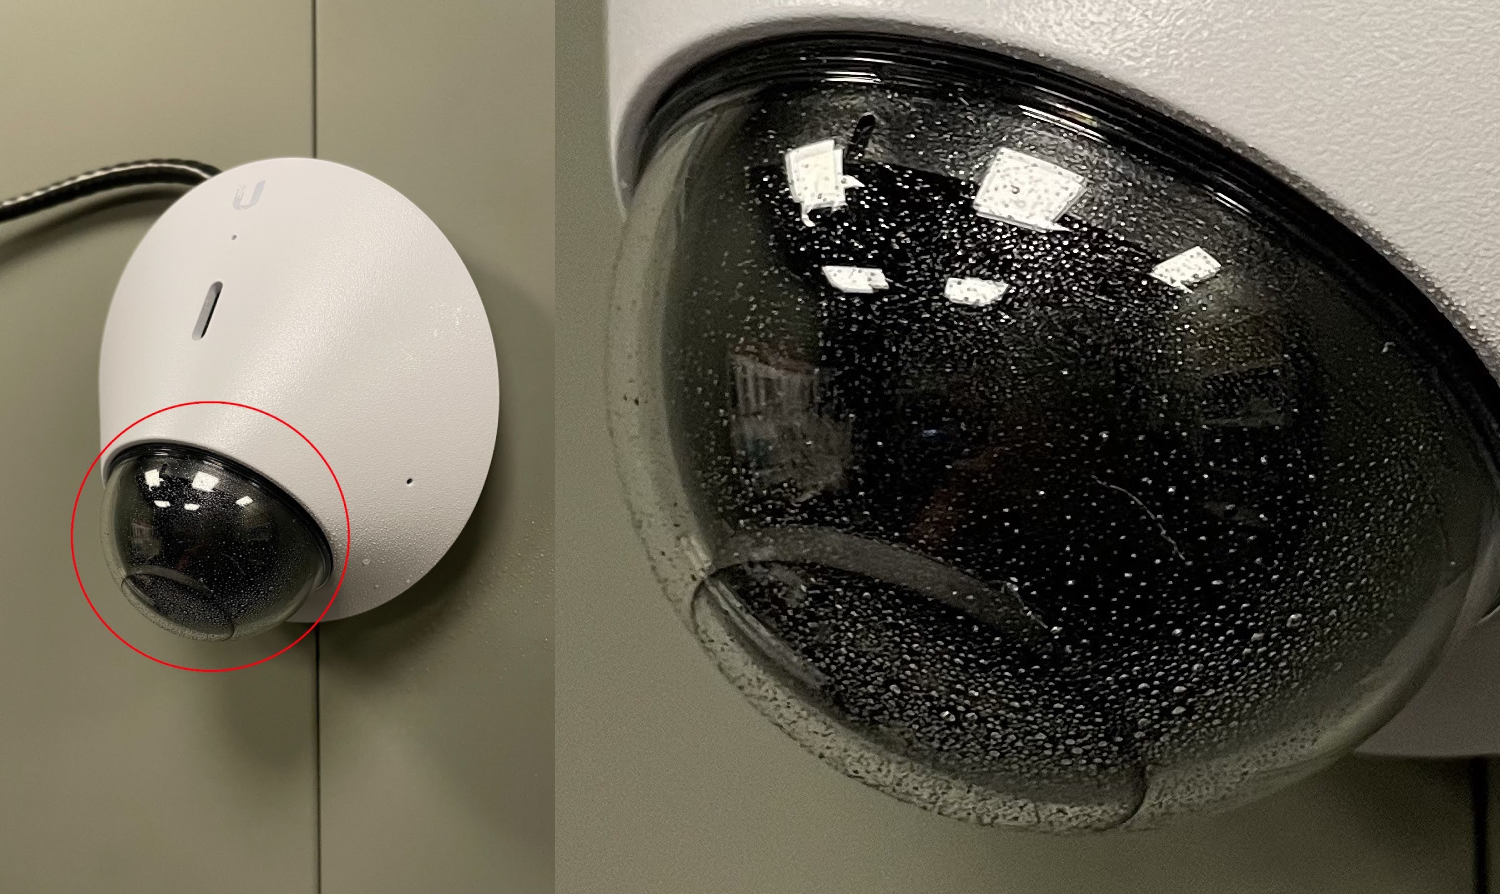
The image below shows the camera’s bubble cover marked with fingerprints.
The image below shows a lens with oil stains.
Below, you can see how image quality with a clean bubble cover is markedly better than that of an oil-stained equivalent.
Moisture droplets on the bubble cover
When moisture droplets stick to the bubble cover, the camera’s infrared lights become scattered by the trapped moisture, like in the example directly below.
To avoid reduced image quality due to moisture droplets, wipe the bubble cover’s exterior with a lens cloth.
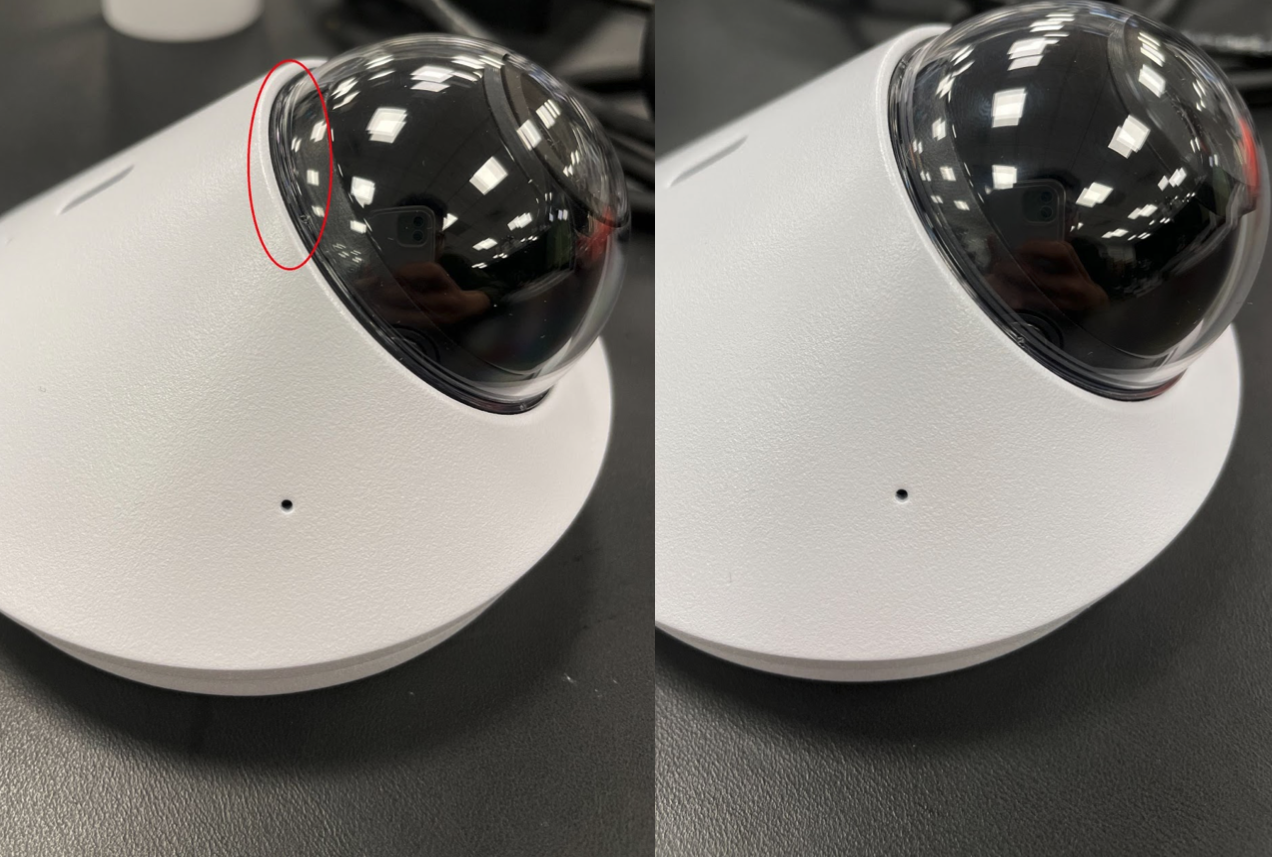
Bubble cover not properly locked in place
The G4 Dome’s removable bubble cover has a locking mechanism to ensure an airtight seal. When the bubble cover is not attached properly, the camera’s infrared lights can be reflected back into its lens.
To mount the bubble cover correctly:
Align the small indentations on the cover and camera.
Rotate the cover clockwise to securely fasten its rubber lining. The sealing strips should not be visible.
The example images below show the G4 Dome when its bubble cover is properly attached (left), and when it’s not (right).
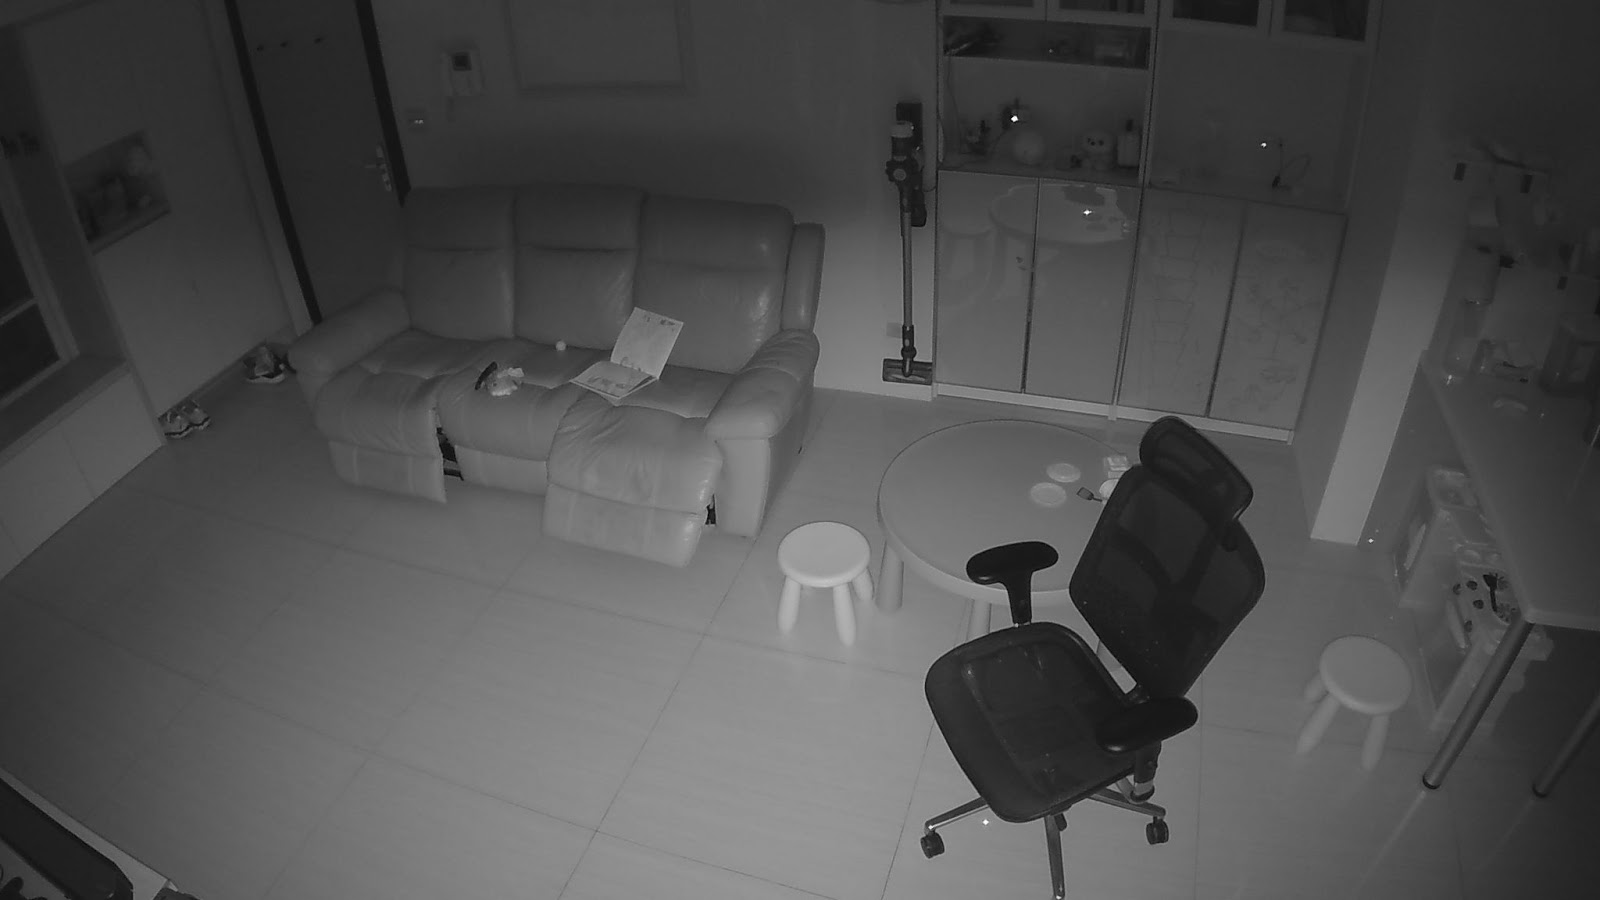
Here, you can see the G4 Dome’s image quality when its bubble cover is properly attached.
Here, you can see how its image quality is greatly reduced by an incorrectly attached cover.
The rubber seal surrounding the lens is damaged
When the rubber seal surrounding the lens is damaged, infrared light can leak in and distort the camera feed.
The images below show a normal seal (left) and a damaged one (right).
This article describes how to access your UniFi Protect application locally or remotely, the factors that create access issues, and how to solve said issues.
Note: Remote access must be enabled in your Protect application. It is enabled by default.
To enable Remote Access in your UniFi Protect application:
Access the UniFi OS Console hosting Protect via its IP address.
If you don’t know your UniFi OS Console’s IP address , use the WiFiman app (iOS / Android ) to locate it on your WiFi network.
Log in to your Ubiquiti SSO account.
Go to the System Settings > Advanced menu, and enable the Remote Access toggle.
Identifying issues
To identify potential reasons for Protect connectivity issues:
Try accessing your UniFi OS Console locally by entering its IP address in your web browser, or remotely via Protect web application (unifi.ui.com ) or mobile app.
Use different mobile devices, ideally running different operating systems (iOS, Android).
Use different supported browsers, such as Chrome, Firefox, or Safari, on different computers.
Connect to different client locations, such as:
A local network with the same subnet as the Protect application.
A mobile carrier network via a mobile device or tethering.
A remote network, such as a workplace or public WiFi network.
Have multiple users, ideally with different system roles, attempt to access the Protect application.
Note: Note your observations. They may be helpful if you need to contact our technical support team.
My camera streams load slowly or buffer frequently
To identify potential reasons for slow stream loading and/or frequent buffering:
Check the stability of network connection:
Perform a speed test using the Wifiman app while connected to the same network as your UniFi OS Console. UniFi Protect should perform well with a network connection better than 5 Mbps and decently with a connection of at least 2.5 Mbps. Below this, performance may suffer.
Ensure that your computer or mobile network is not limiting bandwidth:
A VPN could be preventing client devices from making a peer-to-peer connection with your UniFi OS Console, meaning that all data is first relayed through Ubiquiti’s Remote Management Service—leading to diminished performance. If so, disable the VPN.
Check if there’s a subnet conflict where the UniFi OS Console is on a different subnet than the client, but still on LAN. If the client needs to reach your UniFi OS Console’s subnet but doesn’t have a route, it will hit the gateway (the local router), which knows how to route to the UniFi OS Console. If a VPN is enabled and there’s a configured route on the VPN that goes to another network with the same subnet, it will override.
Inspect your UniFi OS Console’s performance data by making sure you haven’t exceeded its maximum supported camera limit . If so, streaming performance will be diminished.
Check your computer’s CPU utilization. A lower-specialization computer may not be capable of playing back multiple video streams. If the CPU utilization is nearing 100%, try playing back fewer video streams (e.g., fewer cameras on the live view matrix).
I can access Protect locally but not remotely
If you can’t access the Protect application remotely:
Check if Remote Access is enabled:
If it is enabled , try disabling it and enabling again.
Visit status.ui.com to see if there are any issues with Ubiquiti’s Remote Management Service currently being resolved.
I can’t access Protect from the mobile app
If you can’t access Protect from the mobile app:
Verify that the UniFi Protect mobile app is updated to the latest version.
Ensure that the UniFi Protect mobile app is not restricted from accessing WiFi or cellular data:
For iOS devices , go to the Settings > Cellular Data menu and make sure UniFi Protect is toggled on.
For Android devices , go to the Settings > WiFi & Internet > Data Usage > Cellular Data Usage menu, select UniFi Protect, and make sure WiFi and cellular data are not disabled in the App data usage section.
Disable VPN if one is enabled since some VPNs may block WebRTC connectivity, which is used by Protect.
For Android devices with VPN enabled , try disabling the Private DNS in the Settings > WiFi & Internet > Private DNS menu. On some WiFi and mobile carrier networks, certain Private DNS providers such as CloudFlare’s 1.1.1.1 may interfere with WebRTC.
Disable or remove any third-party security or privacy apps that may interfere with network connectivity.
Force-quit the mobile app and open it again.
Uninstall the mobile app, reinstall, and open it.
I can’t access Protect from my web browser
If you’re having trouble accessing Protect from a web browser, but you can connect with the mobile app or a web browser on a different network, there may be an issue with your network configuration. For more information, see the Advanced troubleshooting processes section.
If you have a UniFi Cloud Key Gen2 Plus (UCK G2 Plus) updated to Version 2.0.24 running Protect application Version 1.14.0 or higher , it operates via UniFi OS and, therefore, can be accessed remotely at unifi.ui.com , not protect.ui.com.
If your Cloud Key’s firmware is up to date and can see the Protect application at unifi.ui.com but can’t access it , check if Remote Access is enabled. The recent firmware upgrade might have disabled Remote Access functionality. Follow the steps in the How to connect to UniFi Protect section.
I can’t access Protect on a specific browser
Browser-specific access failures are most often caused by third-party software, such as a browser extension or an application on the host computer.
Common extensions, software, and other features known to cause issues include:
uBlock Origin
Privacy Badger
WebRTC Leak Prevent
Various VPN services, such as Tunnelbear
Ad or traffic blockers that interfere with WebRTC connectivity used by UniFi Protect
To troubleshoot browser issues:
Disable all suspected third-party security or privacy-related browser extensions and software.
If you can now access Protect , re-enable the extensions and software, one at a time, and test your Protect access after each one. This will help you identify the inhibiting software.
(For Chrome only ) Disable the feature flag, Anonymize local IPs exposed by WebRTC :
Copy and paste the following into your address bar: chrome://flags/#enable-webrtc-hide-local-ips-with-mdns
Select Disabled , then restart Chrome.
Once you’ve found the inhibiting software, leave it disabled or uninstall it. If it’s essential, however, contact the developer’s support team for further guidance on how to configure it so it doesn’t prevent Protect access.
I’m a new user and see a No Controllers Detected notification
If you’re a new user signing in via unifi.ui.com or the Protect mobile app and the UniFi OS Console that hosts your Protect application isn’t appearing , make sure that your user permissions include remote access to the UniFi OS Console. For more information on creating users, see UniFi Protect – Add and manage users .
In some cases, a new user can accept a Protect application invitation, log in to their Ubiquiti account via web browser, initially see their UniFi OS Console, then receive a No Controllers Detected notification.
If you’re a new user and see a No Controllers Detected notification after trying to access Protect web application :
Make sure that your UniFi OS Console and Protect application versions are up to date.
Make sure that you have permission to remotely access the UniFi Protect application. For more information, see UniFi Protect – Add and manage users .
Verify that you are a verified and active user by going to unifi.ui.com , clicking on your UniFi OS Console, navigating to the Users menu, and checking your user status.
If this doesn’t resolve the issue , delete the custom users and user roles created, reboot the UniFi OS Console, and recreate the users:
Log in to your UniFi OS Console from the Owner account.
Go to unifi.ui.com , click on your UniFi OS Console, navigate to the Users menu, and delete all custom users and user groups.
Click on the dot grid icon in the top-right corner of the dashboard, navigate to Protect > Roles , and delete all custom user roles.
Click on the dot grid icon in the top-right corner of the dashboard, click the Settings > Advanced tab on the left side of the following screen, and click Restart Device .
Once the device reboots, log in again with the Owner account and recreate all desired users, groups, and roles.
Advanced troubleshooting processes
Check if a WebRTC connection can be established
UniFi Protect uses WebRTC technology to establish connections between your UniFi OS Console and client devices through NAT and firewalls, such as a UniFi gateway, without requiring explicit port forwarding or the revision of firewall rules.
Typically, you won’t need to make any changes to your network, device, or client configurations in order to access Protect locally or remotely.
However, to establish a WebRTC connection needed to access Protect, both networks (i.e., the one that your Protect application connects to and the one that your client device(s) connect to) must meet these requirements:
Reliable access to Internet and DNS service
Adequate bandwidth for basic connectivity and video transfer
Outbound TCP connection capability on Port 443
Outbound UDP connection capability on Ports 0–65535
Note: Port forwarding is not required for TCP or UDP connectivity.
A firewall configured to accept solicited, inbound UDP traffic
No network security appliances (e.g., IPS) or services blocking WebRTC (e.g., STUN or DTLS)
No gateways configured to use Symmetric NAT, which either block peer-to-peer connections, force the use of a relay server (i.e., TURN), or cause said relay to fail
Note: For more information on the technical aspects of WebRTC, please visit webrtc.org .
Troubleshooting WebRTC connection issues caused by Symmetric NAT
Symmetric NAT , while uncommon, can cause issues when establishing WebRTC and other peer-to-peer connections because it does not maintain a 1:1 port mapping ratio for established connections, causing them to fail.
If that happens, WebRTC will attempt to connect via a relay server (i.e., TURN), which will result in either diminished connection quality or outright connection failure.
If you are behind a Symmetric NAT , you can either:
Establish a VPN connection between the client and Protect; or
Configure your router to a mode other than Symmetric NAT, such as Cone NAT.
The UniFi OS Console hosting your UniFi Protect application will automatically detect and log Symmetric NAT on its side but will be unable to determine the NAT type on the clients’ side.
If you suspect Symmetrical NAT on the console-side connection:
Execute the following command: grep -Ri “symmetric” /srv/unifi-protect/logs
Any results will confirm that the connection failed due to Symmetric NAT.
Troubleshooting issues with a particular network
If you identify connectivity problems within a particular network , focus your troubleshooting efforts there. For example, if you can connect to your business’s Protect deployment from home, but not while at a friend’s house, focus on troubleshooting the latter network.
If you can’t access Protect from any remote location , focus first on the application’s on-site network.
In both cases:
Verify that the UniFi OS Console hosting Protect and all client device(s) have a stable internet connection, including a valid gateway IP and DNS servers. Some DNS providers are known to cause problems, such as 1.1.1.1. Try changing it to Google’s 8.8.8.8.
Verify that selected DNS servers properly resolve the following domains:
Device.svc.ubnt.com
Device.amplifi.com
Global.stun.twilio.com
Global.turn.twilio.com
Review your firewall configuration to ensure it meets the requirements listed in the Check if a WebRTC connection can be established section. If you’ve configured custom firewall rules, try disabling them temporarily to test.
Remove any port forwards for UniFi Protect that may have been configured incorrectly.
Disable any network-level security appliance or service rules intended to block WebRTC’s internal protocols, STUN or DTLS. If you are using a UniFi gateway , the UniFi Intrusion Prevention System (IPS) does not require a specific configuration to prevent WebRTC connectivity blockage.
Microsoft created a script for the URL Rewrite mitigation steps and modified step 6 in the Mitigations section.
Microsoft released the Exchange Server Emergency Mitigation Service (EMS) mitigation for this issue. More information is in the Mitigations section.
Antimalware Scan Interface (AMSI) guidance, and auditing AV exclusions to optimize detection, and blocking of the Exchange vulnerability exploitation in the Detections section.
Microsoft Sentinel hunting queries in the Detections section.
Summary
Microsoft is investigating two reported zero-day vulnerabilities affecting Microsoft Exchange Server 2013, Exchange Server 2016, and Exchange Server 2019. The first one, identified as CVE-2022-41040, is a Server-Side Request Forgery (SSRF) vulnerability, and the second one, identified as CVE-2022-41082, allows Remote Code Execution (RCE) when PowerShell is accessible to the attacker.
Currently, Microsoft is aware of limited targeted attacks using these two vulnerabilities. In these attacks, CVE-2022-41040 can enable an authenticated attacker to remotely trigger CVE-2022-41082. It should be noted that authenticated access to the vulnerable Exchange Server is necessary to successfully exploit either vulnerability.
We are working on an accelerated timeline to release a fix. Until then, we’re providing mitigations and the detections guidance below to help customers protect themselves from these attacks.
Microsoft Exchange Online has detections and mitigations to protect customers. As always, Microsoft is monitoring these detections for malicious activity and we’ll respond accordingly if necessary to protect customers.
Microsoft Security Threat Intelligence teams have provided further analysis of observed activity along with mitigation and detection guidance in a new Microsoft Security blog.
We will also continue to provide updates here to help keep customers informed.
Mitigations
Exchange Online customers do not need to take any action.
The current Exchange Server mitigation is to add a blocking rule in “IIS Manager -> Default Web Site -> URL Rewrite -> Actions” to block the known attack patterns. Exchange Server customers should review and choose only one of the following three mitigation options.
Option 1: For customers who have the Exchange Server Emergency Mitigation Service (EMS) enabled, Microsoft released the URL Rewrite mitigation for Exchange Server 2016 and Exchange Server 2019. The mitigation will be enabled automatically. Please see this blog post for more information on this service and how to check active mitigations.
Option 2: Microsoft created the following script for the URL Rewrite mitigation steps. https://aka.ms/EOMTv2
Option 3: Customers can follow the below instructions, which are currently being discussed publicly and are successful in breaking current attack chains. 1. Open IIS Manager. 2. Select Default Web Site. 3. In the Feature View, click URL Rewrite.
4. In the Actions pane on the right-hand side, click Add Rule(s)…
5. Select Request Blocking and click OK.
6. Add the string “.*autodiscover\.json.*\@.*Powershell.*” (excluding quotes). 7. Select Regular Expression under Using. 8. Select Abort Request under How to block and then click OK.
9. Expand the rule and select the rule with the pattern .*autodiscover\.json.*\@.*Powershell.* and click Edit under Conditions.
10. Change the Conditioninput from {URL} to {REQUEST_URI}
NOTE: If you need to change any rule it is best to delete and recreate it.
Impact: There is no known effect on Exchange functionality if URL Rewrite is installed as recommended.
Detections
Microsoft Sentinel
Based on what we’re seeing in the wild, looking for the techniques listed below will help defenders. Our post on Web Shell Threat Hunting with Microsoft Sentinel also provides guidance on looking for web shells in general.
Microsoft Defender for Endpoint Microsoft Defender for Endpoint detects post-exploitation activity. The following alerts can be related to this threat:
Possible web shell installation
Possible IIS web shell
Suspicious Exchange Process Execution
Possible exploitation of Exchange Server vulnerabilities
Suspicious processes indicative of a web shell
Possible IIS compromise
Customers with Microsoft Defender Antivirus enabled can also detect the web shell malware used in exploitation of this vulnerability in-the-wild as of this writing with the following alerts:
‘Chopper’ malware was detected on an IIS Web server
‘Chopper’ high-severity malware was detected
Microsoft Defender Antivirus Microsoft Exchange AMSI integration and Antivirus Exclusions
Exchange supports the integration with the Antimalware Scan Interface (AMSI) since the June 2021 Quarterly Updates for Exchange. It is highly recommended to ensure these updates are installed and AMSI is working using the guidance provided by the Exchange Team, as this integration provides the best ability for Defender Antivirus to detect and block exploitation of vulnerabilities on Exchange.
Many organizations exclude Exchange directories from antivirus scans for performance reasons. It’s highly recommended to audit AV exclusions on the Exchange systems and assess if they can be removed without impacting performance and still ensure the highest level of protection. Exclusions can be managed via Group Policy, PowerShell, or systems management tools like System Center Configuration Manager.
To audit AV exclusions on an Exchange Server running Defender Antivirus, launch the Get-MpPreference command from an elevated PowerShell prompt.
If exclusions cannot be removed for Exchange processes and folders, running Quick Scan in Defender Antivirus scans Exchange directories and files regardless of exclusions.
Microsoft Defender Antivirus (EPP) provides detections and protections for components and behaviors related to this threat under the following signatures:
The global cybersecurity market is flourishing. Experts at Gartner predict that the end-user spending for the information security and risk management market will grow from $172.5 billion in 2022 to $267.3 billion in 2026.
One big area of spending includes the art of putting cybersecurity defenses under pressure, commonly known as security testing. MarketsandMarkets forecasts the global penetration testing (pentesting) market size is expected to grow at a Compound Annual Growth Rate (CAGR) of 13.7% from 2022 to 2027. However, the costs and limitations involved in carrying out a penetration test are already hindering the market growth, and consequently, many cybersecurity professionals are making moves to find an alternative solution.
Pentests aren’t solving cybersecurity pain points
Pentesting can serve specific and important purposes for businesses. For example, prospective customers may ask for the results of one as proof of compliance. However, for certain challenges, this type of security testing methodology isn’t always the best fit.
1 — Continuously changing environments
Securing constantly changing environments within rapidly evolving threat landscapes is particularly difficult. This challenge becomes even more complicated when aligning and managing the business risk of new projects or releases. Since penetration tests focus on one moment in time, the result won’t necessarily be the same the next time you make an update.
2 — Rapid growth
It would be unusual for fast-growing businesses not to experience growing pains. For CISOs, maintaining visibility of their organization’s expanding attack surface can be particularly painful.
According to HelpNetSecurity, 45% of respondents conduct pentests only once or twice per year and 27% do it once per quarter, which is woefully insufficient given how quickly infrastructure and applications change.
3 — Cybersecurity skills shortages
As well as limitations in budgets and resources, finding the available skillsets for internal cybersecurity teams is an ongoing battle. As a result, organizations don’t have the dexterity to spot and promptly remediate specific security vulnerabilities.
While pentests can offer an outsider perspective, often it is just one person performing the test. For some organizations, there is also an issue on trust when relying on the work of just one or two people. Sándor Incze, CISO at CM.com, gives his perspective:
“Not all pentesters are equal. It’s very hard to determine if the pentester you’re hiring is good.”
4 — Cyber threats are evolving
The constant struggle to stay up to date with the latest cyberattack techniques and trends puts media organizations at risk. Hiring specialist skills for every new cyber threat type would be unrealistic and unsustainable.
HelpNetSecurity reported that it takes 71 percent of pentesters one week to one month to conduct a pentest. Then, more than 26 percent of organizations must wait between one to two weeks to get the test results, and 13 percent wait even longer than that. Given the fast pace of threat evolution, this waiting period can leave companies unaware of potential security issues and open to exploitation.
5 — Poor-fitting security testing solutions for agile environments
Continuous development lifecycles don’t align with penetration testing cycles (often performed annually.) Therefore, vulnerabilities mistakenly created during long security testing gaps can remain undiscovered for some time.
Bringing security testing into the 21st-century Impact
A proven solution to these challenges is to utilize ethical hacker communities in addition to a standard penetration test. Businesses can rely on the power of these crowds to assist them in their security testing on a continuous basis. A bug bounty program is one of the most common ways to work with ethical hacker communities.
What is a bug bounty program?
Bug bounty programs allow businesses to proactively work with independent security researchers to report bugs through incentivization. Often companies will launch and manage their program through a bug bounty platform, such as Intigriti.
Organizations with high-security maturity may leave their bug bounty program open for all ethical hackers in the platform’s community to contribute to (known as a public program.) However, most businesses begin by working with a smaller pool of security talent through a private program.
How bug bounty programs support continuous security testing structures
While you’ll receive a certificate to say you’re secure at the end of a penetration test, it won’t necessarily mean that’s still the case the next time you make an update. This is where bug bounty programs work well as a follow-up to pentests and enable a continuous security testing program.
The impact of bug bounty program on cybersecurity
By launching a bug bounty program, organizations experience:
More robust protection: Company data, brand, and reputation have additional protection through continuous security testing.
Enabled business goals: Enhanced security posture, leading to a more secure platform for innovation and growth.
Improved productivity: Increased workflow with fewer disruptions to the availability of services. More strategic IT projects that executives have prioritized, with fewer security “fires” to put out.
Increased skills availability: Internal security team’s time is freed by using a community for security testing and triage.
Clearer budget justification: Ability to provide more significant insights into the organization’s security posture to justify and motivate for an adequate security budget.
Improved relationships: Project delays significantly decrease without the reliance on traditional pentests.
Want to know more about setting up and launching a bug bounty program?
Intigriti is the leading European-based platform for bug bounty and ethical hacking. The platform enables organizations to reduce the risk of a cyberattack by allowing Intigriti’s network of security researchers to test their digital assets for vulnerabilities continuously.
If you’re intrigued by what you’ve read and want to know about bug bounty programs, simply schedule a meeting today with one of our experts.
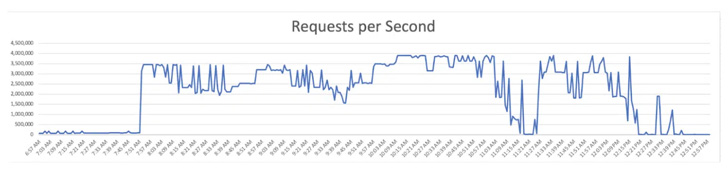
Cybersecurity company Imperva has disclosed that it mitigated a distributed denial-of-service (DDoS) attack with a total of over 25.3 billion requests on June 27, 2022.
The “strong attack,” which targeted an unnamed Chinese telecommunications company, is said to have lasted for four hours and peaked at 3.9 million requests per second (RPS).
“Attackers used HTTP/2 multiplexing, or combining multiple packets into one, to send multiple requests at once over individual connections,” Imperva said in a report published on September 19.
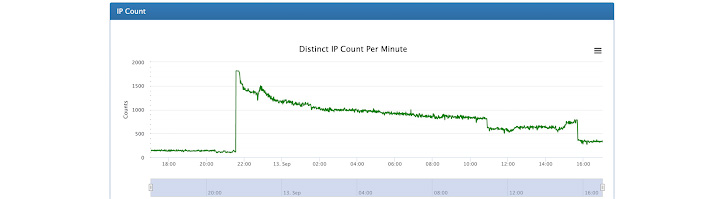
The attack was launched from a botnet that comprised nearly 170,000 different IP addresses spanning routers, security cameras, and compromised servers located in more than 180 countries, primarily the U.S., Indonesia, and Brazil.
The disclosure also comes as web infrastructure provider Akamai said it fielded a new DDoS assault aimed at a customer based in Eastern Europe on September 12, with attack traffic spiking at 704.8 million packets per second (pps).
The same victim was previously targeted on July 21, 2022, in a similar fashion in which the attack volume ramped up to 853.7 gigabits per second (Gbps) and 659.6 million pps over a period of 14 hours.
Akamai’s Craig Sparling said the company has been “bombarded relentlessly with sophisticated distributed denial-of-service (DDoS) attacks,” indicating that the offensives could be politically motivated in the face of Russia’s ongoing war against Ukraine.
Both the disruptive attempts were UDP flood attacks where the attacker targets and overwhelms arbitrary ports on the target host with User Datagram Protocol (UDP) packets.
UDP, being both connectionless and session-less, makes it an ideal networking protocol for handling VoIP traffic. But these same traits can also render it more susceptible to exploitation.
“Without an initial handshake to ensure a legitimate connection, UDP channels can be used to send a large volume of traffic to any host,” NETSCOUT says.
“There are no internal protections that can limit the rate of a UDP flood. As a result, UDP flood DoS attacks are exceptionally dangerous because they can be executed with a limited amount of resources.”
Security software company Sophos has released a patch update for its firewall product after it was discovered that attackers were exploiting a new critical zero-day vulnerability to attack its customers’ network.
The issue, tracked as CVE-2022-3236 (CVSS score: 9.8), impacts Sophos Firewall v19.0 MR1 (19.0.1) and older and concerns a code injection vulnerability in the User Portal and Webadmin components that could result in remote code execution.
The company said it “has observed this vulnerability being used to target a small set of specific organizations, primarily in the South Asia region,” adding it directly notified these entities.
As a workaround, Sophos is recommending that users take steps to ensure that the User Portal and Webadmin are not exposed to WAN. Alternatively, users can update to the latest supported version –
v19.5 GA
v19.0 MR2 (19.0.2)
v19.0 GA, MR1, and MR1-1
v18.5 MR5 (18.5.5)
v18.5 GA, MR1, MR1-1, MR2, MR3, and MR4
v18.0 MR3, MR4, MR5, and MR6
v17.5 MR12, MR13, MR14, MR15, MR16, and MR17
v17.0 MR10
Users running older versions of Sophos Firewall are required to upgrade to receive the latest protections and the relevant fixes.
The development marks the second time a Sophos Firewall vulnerability has come under active attacks within a year. Earlier this March, another flaw (CVE-2022-1040) was used to target organizations in the South Asia region.
Then in June 2022, cybersecurity firm Volexity shared more details of the attack campaign, pinning the intrusions on a Chinese advanced persistent threat (APT) known as DriftingCloud.
Sophos firewall appliances have also previously come under attack to deploy what’s called the Asnarök trojan in an attempt to siphon sensitive information.
In this week’s Whiteboard Friday, Dana brings you some details on the exciting new world of Google Analytics 4. Watch and learn how to talk about it when clients and coworkers are intimidated by the move.https://fast.wistia.net/embed/iframe/bmdz65umai?videoFoam=true
Click on the whiteboard image above to open a high resolution version in a new tab!
Video Transcription
Hi, my name is Dana DiTomaso. I’m President at Kick Point. And I am here today at MozCon 2022 to bring you some details on the exciting world of Google Analytics 4, which I know all of you are like, “Ugh, I don’t want to learn about analytics,” which is totally fair. I also did not want to learn about analytics.
And then I kind of learned about it whether I liked it or not. And you should, too, unfortunately.
So I think the biggest thing about the move from Universal Analytics to GA4 is that people are like they log in and everything looks different. “I don’t like it.” And then they leave. And I agree the user interface in GA4 leaves a lot to be desired. I don’t think there’s necessarily been a lot of good education, especially for those of us who aren’t analysts on a day-to-day basis.
We’re not all data scientists. I’m not a data scientist. I do marketing. So what I’m hoping is I can tell you the things you should know about GA4 on just a basic sort of level, so that you have a better vocabulary to talk about it when people are horrified by the move to GA4, which is inevitable. It’s going to happen. You’ve got to get it on your site starting basically immediately, if you don’t already have it. So I started out with three things, and then I realized there was a fourth thing. So you get a bonus, exciting bonus, but we’ll start with the first three things.
1. It’s different
So the first thing it’s different, which I know is obvious. Yes, of course, Dana it’s different. But it’s different. Okay, so in Universal Analytics, there were different types of hits that could go into analytics, which is where hits came from originally as a metric that people talked about. So, for example, in Universal Analytics, you could have a pageview, or you could have a transaction, or you could have an event.
And those were all different types of hits. In GA4, everything is an event. There is a pageview event. There is a transaction event. There is, well, an event event. I mean, you name the events whatever you want. And because of that, it’s actually a lot better way to report on your data.
So, for example, one of the things that I know people always wanted to be able to report on in Universal Analytics is what pages did people see and how did that relate to conversion rate. And that was really tricky because a pageview was something that was at the hit scope level, which means it was just like the individual thing that happened, whereas conversion rate is a session scoped thing.
So you couldn’t mash together a hit scope thing with pageview with conversion rate, which is session scoped. They just didn’t combine together unless you did some fancy blending stuff in Data Studio. And who’s got time for that? So now in GA4, because everything is an event, you have a lot more freedom with how you can slice and dice and interpret your data and figure out what pages do people engage with before they actually converted, or what was that path, not just the landing page, but the entire user journey on their path to conversion. So that part is really exciting.
2. Engagement rate is not reverse bounce rate
Second thing, engagement rate is a new metric in GA4. They do have bounce rate. They did recently announce it. I’m annoyed at it, so we’re going to talk about this a little bit. Engagement rate is not reverse bounce rate. But it is in GA4.
So in Universal Analytics, bounce rate was a metric that people reported on all the time, even though they shouldn’t have. I hate bounce rate so much. Just picture like a dumpster fire GIF right now across your screen. I hate bounce rate. And why I hate bounce rate is it’s so easily faked. Let’s say, for example, your boss says to you, “Hey, you know what, the bounce rate on our site is too high. Could you fix it?”
You’re like, “Oh, yeah, boss. Totally.” And then what you do is whenever somebody comes on your website, you send what’s called an interactive event off to Google Analytics at the same time. And now you have a 0% bounce rate. Congratulations. You got a raise because you made it up. Bounce rate could absolutely be faked, no question. And so when we moved over to GA4, originally there was no bounce rate.
There was engagement rate. Engagement rate has its own issues, but it’s not measuring anything similar to what bounce rate was. Bounce rate in UA was an event didn’t happen. It didn’t matter if you spent an hour and a half on the page reading it closely. If you didn’t engage in an event that was an interactive event, that meant that you were still counted as a bounce when you left that page.
Whereas in GA4, an engage session is by default someone spending 10 seconds with that tab, that website open, so active in their browser, or they visited two pages, or they had a conversion. Now this 10-second rule I think is pretty short. Ten seconds is not necessarily a lot of time for someone to be engaged with the website.
So you might want to change that. It’s under the tagging settings in your data stream. So if you go to Admin and then you click on your data stream and you go to more tagging settings and then you go to session timeouts, you can change it in there. And I would recommend playing around with that and seeing what feels right to you. Now GA4 literally just as I’m filming this has announced bounce rate, which actually it is reverse engagement rate. Please don’t use it.
Instead, think about engagement rate, which I think is a much more usable metric than bounce rate was in UA. And I’m kind of excited that bounce rate in UA is going away because it was [vocalization].
3. Your data will not match
All right. So next thing, your data is not going to match. And this is stressful because you’ve been reporting on UA data for years, and now all of a sudden it’s not going to match and people will be like, “But you said there were 101 users, and today you’re saying there were actually 102. What’s the problem?”
So, I mean, if you have that kind of dialogue with your leadership, you really need to have a conversation about the idea of accuracy in analytics, as in it isn’t, and error and everything else. But I mean, really the data is going to be different, and sometimes it’s a lot different. It’s not just a little bit different. And it’s because GA4 measures stuff differently than UA did. There is a page on Google Analytics Help, which goes into it in depth. But here are some of the highlights that I think you should really know sort of off the top of your head when you’re talking to people about this.
Pageviews and unique pageviews
So first thing, a pageview metric, which we’re all familiar with, in Universal Analytics, this was all pageviews, including repeats. In GA4, same, pageview is pageview. Great.
So far so good. Then we had unique pageviews in Universal Analytics, which was only single views per session. So if I looked at the homepage and then I went to a services page and I went back to the homepage, I would have two pageviews of the homepage for pageview. I would have one pageview of the homepage in unique pageviews. That metric does not exist in GA4. So that is something to really watch for is that if you were used to reporting on unique pageviews, that is gone.
So I recommend now changing your reports to sort of like walk people through this comfort level of getting them used to the fact they’re not going to get unique pageviews anymore. Or you can implement something that I talk about in another one of my Whiteboard Fridays about being able to measure the percentage of people who are reloading tabs and tab hoarders. You could work that into this a little bit.
Users
Okay. Next thing is users. Users is really I think a difficult topic for a lot of people to get their heads around because they think, oh, user, that means that if I’m on my laptop and then I go to my mobile device, obviously I am one user. You’re usually not, unfortunately. You don’t necessarily get associated across multiple devices. Or if you’re using say a privacy- focused browser, like Safari, you may not even be associated in the same device, which kind of sucks.
The real only way you can truly measure if someone is a user across multiple sessions is if you have a login on your website, which not everybody does. A lot of B2B sites don’t have logins. A lot of small business sites don’t have logins. So users is already kind of a sketchy metric. And so unfortunately it’s one that people used to report on a lot in Universal Analytics.
So in Universal Analytics, users was total users, new versus returning. In GA4, it’s now active users. What is an active user? The documentation is a little unclear on how Google considers an active user. So I recommend reading that in depth. Just know that this is going to be different. You never should have been reporting on new versus returning users anyway, unless you had a login on your site because it was such a sketchy, bad metric, but I don’t think a lot of people knew how bad it was.
It’s okay. Just start changing your reports now so that when you have to start using GA4, on July 1, 2023, for real UA is done, then at least it’s not so much of a shock when you do make that transition.
Sessions
So one other thing to think about as well with the changes is sessions. So in Universal Analytics, a session was the active use of a site, so you’re clicking on stuff.
It had a 30-minute timeout. And you may have heard never to use UTM tags on internal links on your website. And the reason why is because if someone clicked on an internal link on your website that had UTMs on it, your session would reset. And so you would have what’s called session breaking, where all of a sudden you would have a session that basically started in the middle of your website with a brand-new campaign and source and medium and completely detached from the session that they just had.
They would be a returning user though. That’s great. You shouldn’t have been reporting that anyway. Whereas in GA4 instead, now there’s an event because, remember, everything is an event now. There is an event that is called session start. And so that records when, well, the session starts. And then there’s also a 30-minute timeout, but there is no UTM reset.
Now that doesn’t mean that you should go out there and start using UTMs on internal links. I still don’t think it’s a great idea, but it’s not necessarily going to break things the way that it used to. So you can now see where did someone start on my site by looking at the session start event. I don’t know if it’s necessarily 100% reliable. We’ve seen situations where if you’re using consent management tools, for example, like a cookie compliance tool, you can have issues with sessions starting and whatnot.
So just keep that in mind is that it’s not necessarily totally foolproof, but it is a really interesting way to see where people started on the site in a way that you could not do this before.
4. Use BigQuery
So bonus, bonus before we go. All right, the fourth thing that I think you should know about GA4, use BigQuery. There’s a built-in BigQuery export under the settings for GA4. Use it.
The reason why you should use it is: (a) the reports in GA4 are not great, the default reports, they kind of suck; (b) even the explorations are a bit questionable, like you can’t really format them to look nice at all. So what I’m saying to people is don’t really use the reports inside GA4 for any sort of useful reporting purposes. It’s more like an ad hoc reporting. But even then, I would still turn to BigQuery for most of my reporting needs.
And the reason why is because GA4 has some thresholding applied. So you don’t necessarily get all the data out of GA4 when you’re actually looking at reports in it. And this happened to me actually just this morning before I recorded this Whiteboard Friday. I was looking to see how many people engaged with the form on our website, and because it was a relatively low number, it said zero.
And then I looked at the data in BigQuery and it said 12. That amount could be missing from the reports in GA4, but you can see it in BigQuery, and that’s because of the thresholding that’s applied. So I always recommend using the BigQuery data instead of the GA4 data. And in Google Data Studio, if that’s what you use for your reporting tool, the same issue applies when you use GA4 as a data source.
You have the same thresholding problems. So really just use BigQuery. And you don’t need to know BigQuery. All you need to do is get the data going into BigQuery and then open up Google Data Studio and use that BigQuery table as your data source. That’s really all you need to know. No SQL required. If you want to learn it, that’s neat.
I don’t even know it that well yet. But it is not something you have to know in order to report well on GA4. So I hope that you found this helpful and you can have a little bit more of a better dialogue with your team and your leadership about GA4. I know it seems rushed. It’s rushed. Let’s all admit it’s rushed, but I think it’s going to be a really good move. I’m really excited about the new kinds of data and the amounts of data that we can capture now in GA4.
It really frees us from like the category action label stuff that we were super tied to in Universal Analytics. We can record so much more interesting data now on every event. So I’m excited about that. The actual transition itself might be kind of painful, but then a year from now, we’ll all look back and laugh, right? Thank you very much.
Dana is a partner at Kick Point, where she applies marketing into strategies to grow clients’ businesses, in particular to ensure that digital and traditional play well together. With her deep experience in digital, Dana can separate real solutions from wastes of time (and budget).