In Part 1: Rethinking Cache Purge, Fast and Scalable Global Cache Invalidation, we outlined the importance of cache invalidation and the difficulties of purging caches, how our existing purge system was designed and performed, and we gave a high level overview of what we wanted our new Cache Purge system to look like.
It’s been a while since we published the first blog post and it’s time for an update on what we’ve been working on. In this post we’ll be talking about some of the architecture improvements we’ve made so far and what we’re working on now.
Cache Purge end to end
We touched on the high level design of what we called the “coreless” purge system in part 1, but let’s dive deeper into what that design encompasses by following a purge request from end to end:
Step 1: Request received locally
An API request to Cloudflare is routed to the nearest Cloudflare data center and passed to an API Gateway worker. This worker looks at the request URL to see which service it should be sent to and forwards the request to the appropriate upstream backend. Most endpoints of the Cloudflare API are currently handled by centralized services, so the API Gateway worker is often just proxying requests to the nearest “core” data center which have their own gateway services to handle authentication, authorization, and further routing. But for endpoints which aren’t handled centrally the API Gateway worker must handle authentication and route authorization, and then proxy to an appropriate upstream. For cache purge requests that upstream is a Purge Ingest worker in the same data center.
Step 2: Purges tested locally
The Purge Ingest worker evaluates the purge request to make sure it is processible. It scans the URLs in the body of the request to see if they’re valid, then attempts to purge the URLs from the local data center’s cache. This concept of local purging was a new step introduced with the coreless purge system allowing us to capitalize on existing logic already used in every data center.
By leveraging the same ownership checks our data centers use to serve a zone’s normal traffic on the URLs being purged, we can determine if those URLs are even cacheable by the zone. Currently more than 50% of the URLs we’re asked to purge can’t be cached by the requesting zones, either because they don’t own the URLs (e.g. a customer asking us to purge https://cloudflare.com) or because the zone’s settings for the URL prevent caching (e.g. the zone has a “bypass” cache rule that matches the URL). All such purges are superfluous and shouldn’t be processed further, so we filter them out and avoid broadcasting them to other data centers freeing up resources to process more legitimate purges.
On top of that, generating the cache key for a file isn’t free; we need to load zone configuration options that might affect the cache key, apply various transformations, et cetera. The cache key for a given file is the same in every data center though, so when we purge the file locally we now return the generated cache key to the Purge Ingest worker and broadcast that key to other data centers instead of making each data center generate it themselves.
Step 3: Purges queued for broadcasting
Once the local purge is done the Purge Ingest worker forwards the purge request with the cache key obtained from the local cache to a Purge Queue worker. The queue worker is a Durable Object worker using its persistent state to hold a queue of purges it receives and pointers to how far along in the queue each data center in our network is in processing purges.
The queue is important because it allows us to automatically recover from a number of scenarios such as connectivity issues or data centers coming back online after maintenance. Having a record of all purges since an issue arose lets us replay those purges to a data center and “catch up”.
But Durable Objects are globally unique, so having one manage all global purges would have just moved our centrality problem from a core data center to wherever that Durable Object was provisioned. Instead we have dozens of Durable Objects in each region, and the Purge Ingest worker looks at the load balancing pool of Durable Objects for its region and picks one (often in the same data center) to forward the request to. The Durable Object will write the purge request to its queue and immediately loop through all the data center pointers and attempt to push any outstanding purges to each.
While benchmarking our performance we found our particular workload exhibited a “goldilocks zone” of throughput to a given Durable Object. On script startup we have to load all sorts of data like network topology and data center health–then refresh it continuously in the background–and as long as the Durable Object sees steady traffic it stays active and we amortize those startup costs. But if you ask a single Durable Object to do too much at once like send or receive too many requests, the single-threaded runtime won’t keep up. Regional purge traffic fluctuates a lot depending on local time of day, so there wasn’t a static quantity of Durable Objects per region that would let us stay within the goldilocks zone of enough requests to each to keep them active but not too many to keep them efficient. So we built load monitoring into our Durable Objects, and a Regional Autoscaler worker to aggregate that data and adjust load balancing pools when we start approaching the upper or lower edges of our efficiency goldilocks zone.
Step 4: Purges broadcast globally
Once a purge request is queued by a Purge Queue worker it needs to be broadcast to the rest of Cloudflare’s data centers to be carried out by their caches. The Durable Objects will broadcast purges directly to all data centers in their region, but when broadcasting to other regions they pick a Purge Fanout worker per region to take care of their region’s distribution. The fanout workers manage queues of their own as well as pointers for all of their region’s data centers, and in fact they share a lot of the same logic as the Purge Queue workers in order to do so. One key difference is fanout workers aren’t Durable Objects; they’re normal worker scripts, and their queues are purely in memory as opposed to being backed by Durable Object state. This means not all queue worker Durable Objects are talking to the same fanout worker in each region. Fanout workers can be dropped and spun up again quickly by any metal in the data center because they aren’t canonical sources of state. They maintain queues and pointers for their region but all of that info is also sent back downstream to the Durable Objects who persist that data themselves, reliably.
But what does the fanout worker get us? Cloudflare has hundreds of data centers all over the world, and as we mentioned above we benefit from keeping the number of incoming and outgoing requests for a Durable Object fairly low. Sending purges to a fanout worker per region means each Durable Object only has to make a fraction of the requests it would if it were broadcasting to every data center directly, which means it can process purges faster.
On top of that, occasionally a request will fail to get where it was going and require retransmission. When this happens between data centers in the same region it’s largely unnoticeable, but when a Durable Object in Canada has to retry a request to a data center in rural South Africa the cost of traversing that whole distance again is steep. The data centers elected to host fanout workers have the most reliable connections in their regions to the rest of our network. This minimizes the chance of inter-regional retries and limits the latency imposed by retries to regional timescales.
The introduction of the Purge Fanout worker was a massive improvement to our distribution system, reducing our end-to-end purge latency by 50% on its own and increasing our throughput threefold.
Current status of coreless purge
We are proud to say our new purge system has been in production serving purge by URL requests since July 2022, and the results in terms of latency improvements are dramatic. In addition, flexible purge requests (purge by tag/prefix/host and purge everything) share and benefit from the new coreless purge system’s entrypoint workers before heading to a core data center for fulfillment.
The reason flexible purge isn’t also fully coreless yet is because it’s a more complex task than “purge this object”; flexible purge requests can end up purging multiple objects–or even entire zones–from cache. They do this through an entirely different process that isn’t coreless compatible, so to make flexible purge fully coreless we would have needed to come up with an entirely new multi-purge mechanism on top of redesigning distribution. We chose instead to start with just purge by URL so we could focus purely on the most impactful improvements, revamping distribution, without reworking the logic a data center uses to actually remove an object from cache.
This is not to say that the flexible purges haven’t benefited from the coreless purge project. Our cache purge API lets users bundle single file and flexible purges in one request, so the API Gateway worker and Purge Ingest worker handle authorization, authentication and payload validation for flexible purges too. Those flexible purges get forwarded directly to our services in core data centers pre-authorized and validated which reduces load on those core data center auth services. As an added benefit, because authorization and validity checks all happen at the edge for all purge types users get much faster feedback when their requests are malformed.
Next steps
While coreless cache purge has come a long way since the part 1 blog post, we’re not done. We continue to work on reducing end-to-end latency even more for purge by URL because we can do better. Alongside improvements to our new distribution system, we’ve also been working on the redesign of flexible purge to make it fully coreless, and we’re really excited to share the results we’re seeing soon. Flexible cache purge is an incredibly popular API and we’re giving its refresh the care and attention it deserves.
Visit 1.1.1.1 from any device to get started with our free app that makes your Internet faster and safer.
To learn more about our mission to help build a better Internet, start here. If you’re looking for a new career direction, check out our open positions.
There is a famous quote attributed to a Netscape engineer: “There are only two difficult problems in computer science: cache invalidation and naming things.” While naming things does oddly take up an inordinate amount of time, cache invalidation shouldn’t.
In the past we’ve written about Cloudflare’s incredibly fast response times, whether content is cached on our global network or not. If content is cached, it can be served from a Cloudflare cache server, which are distributed across the globe and are generally a lot closer in physical proximity to the visitor. This saves the visitor’s request from needing to go all the way back to an origin server for a response. But what happens when a webmaster updates something on their origin and would like these caches to be updated as well? This is where cache “purging” (also known as “invalidation”) comes in.
Customers thinking about setting up a CDN and caching infrastructure consider questions like:
How do different caching invalidation/purge mechanisms compare?
How many times a day/hour/minute do I expect to purge content?
How quickly can the cache be purged when needed?
This blog will discuss why invalidating cached assets is hard, what Cloudflare has done to make it easy (because we care about your experience as a developer), and the engineering work we’re putting in this year to make the performance and scalability of our purge services the best in the industry.
What makes purging difficult also makes it useful
(i) Scale The first thing that complicates cache invalidation is doing it at scale. With data centers in over 270 cities around the globe, our most popular users’ assets can be replicated at every corner of our network. This also means that a purge request needs to be distributed to all data centers where that content is cached. When a data center receives a purge request, it needs to locate the cached content to ensure that subsequent visitor requests for that content are not served stale/outdated data. Requests for the purged content should be forwarded to the origin for a fresh copy, which is then re-cached on its way back to the user.
This process repeats for every data center in Cloudflare’s fleet. And due to Cloudflare’s massive network, maintaining this consistency when certain data centers may be unreachable or go offline, is what makes purging at scale difficult.
Making sure that every data center gets the purge command and remains up-to-date with its content logs is only part of the problem. Getting the purge request to data centers quickly so that content is updated uniformly is the next reason why cache invalidation is hard.
(ii) Speed When purging an asset, race conditions abound. Requests for an asset can happen at any time, and may not follow a pattern of predictability. Content can also change unpredictably. Therefore, when content changes and a purge request is sent, it must be distributed across the globe quickly. If purging an individual asset, say an image, takes too long, some visitors will be served the new version, while others are served outdated content. This data inconsistency degrades user experience, and can lead to confusion as to which version is the “right” version. Websites can sometimes even break in their entirety due to this purge latency (e.g. by upgrading versions of a non-backwards compatible JavaScript library).
Purging at speed is also difficult when combined with Cloudflare’s massive global footprint. For example, if a purge request is traveling at the speed of light between Tokyo and Cape Town (both cities where Cloudflare has data centers), just the transit alone (no authorization of the purge request or execution) would take over 180ms on average based on submarine cable placement. Purging a smaller network footprint may reduce these speed concerns while making purge times appear faster, but does so at the expense of worse performance for customers who want to make sure that their cached content is fast for everyone.
(iii) Scope The final thing that makes purge difficult is making sure that only the unneeded web assets are invalidated. Maintaining a cache is important for egress cost savings and response speed. Webmasters’ origins could be knocked over by a thundering herd of requests, if they choose to purge all content needlessly. It’s a delicate balance of purging just enough: too much can result in both monetary and downtime costs, and too little will result in visitors receiving outdated content.
At Cloudflare, what to invalidate in a data center is often dictated by the type of purge.Purge everything, as you could probably guess, purges all cached content associated with a website. Purge by prefix purges content based on a URL prefix. Purge by hostname can invalidate content based on a hostname. Purge by URL or single file purge focuses on purging specified URLs. Finally, Purge by tag purges assets that are marked with Cache-Tag headers. These markers offer webmasters flexibility in grouping assets together. When a purge request for a tag comes into a data center, all assets marked with that tag will be invalidated.
With that overview in mind, the remainder of this blog will focus on putting each element of invalidation together to benchmark the performance of Cloudflare’s purge pipeline and provide context for what performance means in the real-world. We’ll be reviewing how fast Cloudflare can invalidate cached content across the world. This will provide a baseline analysis for how quick our purge systems are presently, which we will use to show how much we will improve by the time we launch our new purge system later this year.
How does purge work currently?
In general, purge takes the following route through Cloudflare’s data centers.
A purge request is initiated via the API or UI. This request specifies how our data centers should identify the assets to be purged. This can be accomplished via cache-tag header(s), URL(s), entire hostnames, and much more.
The request is received by any Cloudflare data center and is identified to be a purge request. It is then routed to a Cloudflare core data center (a set of a few data centers responsible for network management activities).
When a core data center receives it, the request is processed by a number of internal services that (for example) make sure the request is being sent from an account with the appropriate authorization to purge the asset. Following this, the request gets fanned out globally to all Cloudflare data centers using our distribution service.
When received by a data center, the purge request is processed and all assets with the matching identification criteria are either located and removed, or marked as stale. These stale assets are not served in response to requests and are instead re-pulled from the origin.
After being pulled from the origin, the response is written to cache again, replacing the purged version.
Now let’s look at this process in practice. Below we describe Cloudflare’s purge benchmarking that uses real-world performance data from our purge pipeline.
Benchmarking purge performance design
In order to understand how performant Cloudflare’s purge system is, we measured the time it took from sending the purge request to the moment that the purge is complete and the asset is no longer served from cache.
In general, the process of measuring purge speeds involves: (i) ensuring that a particular piece of content is cached, (ii) sending the command to invalidate the cache, (iii) simultaneously checking our internal system logs for how the purge request is routed through our infrastructure, and (iv) measuring when the asset is removed from cache (first miss).
This process measures how quickly cache is invalidated from the perspective of an average user.
Clock starts As noted above, in this experiment we’re using sampled RUM data from our purge systems. The goal of this experiment is to benchmark current data for how long it can take to purge an asset on Cloudflare across different regions. Once the asset was cached in a region on Cloudflare, we identify when a purge request is received for that asset. At that same instant, the clock started for this experiment. We include in this time any retrys that we needed to make (due to data centers missing the initial purge request) to ensure that the purge was done consistently across our network. The clock continues as the request transits our purge pipeline (data center > core > fanout > purge from all data centers).
Clock stops What caused the clock to stop was the purged asset being removed from cache, meaning that the data center is no longer serving the asset from cache to visitor’s requests. Our internal logging measures the precise moment that the cache content has been removed or expired and from that data we were able to determine the following benchmarks for our purge types in various regions.
Results
We’ve divided our benchmarks in two ways: by purge type and by region.
We singled out Purge by URL because it identifies a single target asset to be purged. While that asset can be stored in multiple locations, the amount of data to be purged is strictly defined.
We’ve combined all other types of purge (everything, tag, prefix, hostname) together because the amount of data to be removed is highly variable. Purging a whole website or by assets identified with cache tags could mean we need to find and remove a multitude of content from many different data centers in our network.
Secondly, we have segmented our benchmark measurements by regions and specifically we confined the benchmarks to specific data center servers in the region because we were concerned about clock skews between different data centers. This is the reason why we limited the test to the same cache servers so that even if there was skew, they’d all be skewed in the same way.
We took the latency from the representative data centers in each of the following regions and the global latency. Data centers were not evenly distributed in each region, but in total represent about 90 different cities around the world:
Africa
Asia Pacific Region (APAC)
Eastern Europe (EEUR)
Eastern North America (ENAM)
Oceania
South America (SA)
Western Europe (WEUR)
Western North America (WNAM)
The global latency numbersrepresent the purge data from all Cloudflare data centers in over 270 cities globally. In the results below, global latency numbers may be larger than the regional numbers because it represents all of our data centers instead of only a regional portion so outliers and retries might have an outsized effect.
Below are the results for how quickly our current purge pipeline was able to invalidate content by purge type and region. All times are represented in seconds and divided into P50, P75, and P99 quantiles. Meaning for “P50” that 50% of the purges were at the indicated latency or faster.
Purge By URL
P50
P75
P99
AFRICA
0.95s
1.94s
6.42s
APAC
0.91s
1.87s
6.34s
EEUR
0.84s
1.66s
6.30s
ENAM
0.85s
1.71s
6.27s
OCEANIA
0.95s
1.96s
6.40s
SA
0.91s
1.86s
6.33s
WEUR
0.84s
1.68s
6.30s
WNAM
0.87s
1.74s
6.25s
GLOBAL
1.31s
1.80s
6.35s
Purge Everything, by Tag, by Prefix, by Hostname
P50
P75
P99
AFRICA
1.42s
1.93s
4.24s
APAC
1.30s
2.00s
5.11s
EEUR
1.24s
1.77s
4.07s
ENAM
1.08s
1.62s
3.92s
OCEANIA
1.16s
1.70s
4.01s
SA
1.25s
1.79s
4.106s
WEUR
1.19s
1.73s
4.04s
WNAM
0.9995s
1.53s
3.83s
GLOBAL
1.57s
2.32s
5.97s
A general note about these benchmarks — the data represented here was taken from over 48 hours (two days) of RUM purge latency data in May 2022. If you are interested in how quickly your content can be invalidated on Cloudflare, we suggest you test our platform with your website.
Those numbers are good and much faster than most of our competitors. Even in the worst case, we see the time from when you tell us to purge an item to when it is removed globally is less than seven seconds. In most cases, it’s less than a second. That’s great for most applications, but we want to be even faster. Our goal is to get cache purge to as close as theoretically possible to the speed of light limit for a network our size, which is 200ms.
Intriguingly, LEO satellite networks may be able to provide even lower global latency than fiber optics because of the straightness of the paths between satellites that use laser links. We’ve done calculations of latency between LEO satellites that suggest that there are situations in which going to space will be the fastest path between two points on Earth. We’ll let you know if we end up using laser-space-purge.
Just as we have with network performance, we are going to relentlessly measure our cache performance as well as the cache performance of our competitors. We won’t be satisfied until we verifiably are the fastest everywhere. To do that, we’ve built a new cache purge architecture which we’re confident will make us the fastest cache purge in the industry.
Our new architecture
Through the end of 2022, we will continue this blog series incrementally showing how we will become the fastest, most-scalable purge system in the industry. We will continue to update you with how our purge system is developing and benchmark our data along the way.
Getting there will involve rearchitecting and optimizing our purge service, which hasn’t received a systematic redesign in over a decade. We’re excited to do our development in the open, and bring you along on our journey.
So what do we plan on updating?
Introducing Coreless Purge
The first version of our cache purge system was designed on top of a set of central core services including authorization, authentication, request distribution, and filtering among other features that made it a high-reliability service. These core components had ultimately become a bottleneck in terms of scale and performance as our network continues to expand globally. While most of our purge dependencies have been containerized, the message queue used was still running on bare metals, which led to increased operational overhead when our system needed to scale.
Last summer, we built a proof of concept for a completely decentralized cache invalidation system using in-house tech – Cloudflare Workers and Durable Objects. Using Durable Objects as a queuing mechanism gives us the flexibility to scale horizontally by adding more Durable Objects as needed and can reduce time to purge with quick regional fanouts of purge requests.
In the new purge system we’re ripping out the reliance on core data centers and moving all that functionality to every data center, we’re calling it coreless purge.
Here’s a general overview of how coreless purge will work:
A purge request will be initiated via the API or UI. This request will specify how we should identify the assets to be purged.
The request will be routed to the nearest Cloudflare data center where it is identified to be a purge request and be passed to a Worker that will perform several of the key functions that currently occur in the core (like authorization, filtering, etc).
From there, the Worker will pass the purge request to a Durable Object in the data center. The Durable Object will queue all the requests and broadcast them to every data center when they are ready to be processed.
When the Durable Object broadcasts the purge request to every data center, another Worker will pass the request to the service in the data center that will invalidate the content in cache (executes the purge).
We believe this re-architecture of our system built by stringing together multiple services from the Workers platform will help improve both the speed and scalability of the purge requests we will be able to handle.
Conclusion
We’re going to spend a lot of time building and optimizing purge because, if there’s one thing we learned here today, it’s that cache invalidation is a difficult problem but those are exactly the types of problems that get us out of bed in the morning.
If you want to help us optimize our purge pipeline, we’re hiring.
Visit 1.1.1.1 from any device to get started with our free app that makes your Internet faster and safer.
To learn more about our mission to help build a better Internet, start here. If you’re looking for a new career direction, check out our open positions.
Throughout Speed Week, we have talked about the importance of optimizing performance. Compression plays a crucial role by reducing file sizes transmitted over the Internet. Smaller file sizes lead to faster downloads, quicker website loading, and an improved user experience.
Take household cleaning products as a real world example. It is estimated “a typical bottle of cleaner is 90% water and less than 10% actual valuable ingredients”. Removing 90% of a typical 500ml bottle of household cleaner reduces the weight from 600g to 60g. This reduction means only a 60g parcel, with instructions to rehydrate on receipt, needs to be sent. Extrapolated into the gallons, this weight reduction soon becomes a huge shipping saving for businesses. Not to mention the environmental impact.
This is how compression works. The sender compresses the file to its smallest possible size, and then sends the smaller file with instructions on how to handle it when received. By reducing the size of the files sent, compression ensures the amount of bandwidth needed to send files over the Internet is a lot less. Where files are stored in expensive cloud providers like AWS, reducing the size of files sent can directly equate to significant cost savings on bandwidth.
Smaller file sizes are also particularly beneficial for end users with limited Internet connections, such as mobile devices on cellular networks or users in areas with slow network speeds.
Cloudflare has always supported compression in the form of Gzip. Gzip is a widely used compression algorithm that has been around since 1992 and provides file compression for all Cloudflare users. However, in 2013 Google introduced Brotli which supports higher compression levels and better performance overall. Switching from gzip to Brotli results in smaller file sizes and faster load times for web pages. We have supported Brotli since 2017 for the connection between Cloudflare and client browsers. Today we are announcing end-to-end Brotli support for web content: support for Brotli compression, at the highest possible levels, from the origin server to the client.
If your origin server supports Brotli, turn it on, crank up the compression level, and enjoy the performance boost.
Brotli compression to 11
Brotli has 12 levels of compression ranging from 0 to 11, with 0 providing the fastest compression speed but the lowest compression ratio, and 11 offering the highest compression ratio but requiring more computational resources and time. During our initial implementation of Brotli five years ago, we identified that compression level 4 offered the balance between bytes saved and compression time without compromising performance.
Since 2017, Cloudflare has been using a maximum compression of Brotli level 4 for all compressible assets based on the end user’s “accept-encoding” header. However, one issue was that Cloudflare only requested Gzip compression from the origin, even if the origin supported Brotli. Furthermore, Cloudflare would always decompress the content received from the origin before compressing and sending it to the end user, resulting in additional processing time. As a result, customers were unable to fully leverage the benefits offered by Brotli compression.
Old world
With Cloudflare now fully supporting Brotli end to end, customers will start seeing our updated accept-encoding header arriving at their origins. Once available customers can transfer, cache and serve heavily compressed Brotli files directly to us, all the way up to the maximum level of 11. This will help reduce latency and bandwidth consumption. If the end user device does not support Brotli compression, we will automatically decompress the file and serve it either in its decompressed format or as a Gzip-compressed file, depending on the Accept-Encoding header.
Full end-to-end Brotli compression support
End user cannot support Brotli compression
Customers can implement Brotli compression at their origin by referring to the appropriate online materials. For example, customers that are using NGINX, can implement Brotli by following this tutorial and setting compression at level 11 within the nginx.conf configuration file as follows:
Cloudflare will then serve these assets to the client at the exact same compression level (11) for the matching file brotli_types. This means any SVG or BMP images will be sent to the client compressed at Brotli level 11.
Testing
We applied compression against a simple CSS file, measuring the impact of various compression algorithms and levels. Our goal was to identify potential improvements that users could experience by optimizing compression techniques. These results can be seen in the following table:
Test
Size (bytes)
% Reduction of original file (Higher % better)
Uncompressed response (no compression used)
2,747
–
Cloudflare default Gzip compression (level 8)
1,121
59.21%
Cloudflare default Brotli compression (level 4)
1,110
59.58%
Compressed with max Gzip level (level 9)
1,121
59.21%
Compressed with max Brotli level (level 11)
909
66.94%
By compressing Brotli at level 11 users are able to reduce their file sizes by 19% compared to the best Gzip compression level. Additionally, the strongest Brotli compression level is around 18% smaller than the default level used by Cloudflare. This highlights a significant size reduction achieved by utilizing Brotli compression, particularly at its highest levels, which can lead to improved website performance, faster page load times and an overall reduction in egress fees.
To take advantage of higher end to end compression rates the following Cloudflare proxy features need to be disabled.
Email Obfuscation
Rocket Loader
Server Side Excludes (SSE)
Mirage
HTML Minification – JavaScript and CSS can be left enabled.
Automatic HTTPS Rewrites
This is due to Cloudflare needing to decompress and access the body to apply the requested settings. Alternatively a customer can disable these features for specific paths using Configuration Rules.
If any of these rewrite features are enabled, your origin can still send Brotli compression at higher levels. However, we will decompress, apply the Cloudflare feature(s) enabled, and recompress on the fly using Cloudflare’s default Brotli level 4 or Gzip level 8 depending on the user’s accept-encoding header.
For browsers that do not accept Brotli compression, we will continue to decompress and send Gzipped responses or uncompressed.
Implementation
The initial step towards implementing Brotli from the origin involved constructing a decompression module that could be integrated into Cloudflare software stack. It allows us to efficiently convert the compressed bits received from the origin into the original, uncompressed file. This step was crucial as numerous features such as Email Obfuscation and Cloudflare Workers Customers, rely on accessing the body of a response to apply customizations.
We integrated the decompressor into the core reverse web proxy of Cloudflare. This integration ensured that all Cloudflare products and features could access Brotli decompression effortlessly. This also allowed our Cloudflare Workers team to incorporate Brotli Directly into Cloudflare Workers allowing our Workers customers to be able to interact with responses returned in Brotli or pass through to the end user unmodified.
Introducing Compression rules – Granular control of compression to end users
By default Cloudflare compresses certain content types based on the Content-Type header of the file. Today we are also announcing Compression Rules for our Enterprise Customers to allow you even more control on how and what Cloudflare will compress.
Today we are also announcing the introduction of Compression Rules for our Enterprise Customers. With Compression Rules, you gain enhanced control over Cloudflare’s compression capabilities, enabling you to customize how and which content Cloudflare compresses to optimize your website’s performance.
For example, by using Cloudflare’s Compression Rules for .ktx files, customers can optimize the delivery of textures in webGL applications, enhancing the overall user experience. Enabling compression minimizes the bandwidth usage and ensures that webGL applications load quickly and smoothly, even when dealing with large and detailed textures.
Alternatively customers can disable compression or specify a preference of how we compress. Another example could be an Infrastructure company only wanting to support Gzip for their IoT devices but allow Brotli compression for all other hostnames.
Compression rules use the filters that our other rules products are built on top of with the added fields of Media Type and Extension type. Allowing users to easily specify the content you wish to compress.
Deprecating the Brotli toggle
Brotli has been long supported by some web browsers since 2016 and Cloudflare offered Brotli Support in 2017. As with all new web technologies Brotli was unknown and we gave customers the ability to selectively enable or disable BrotlI via the API and our UI.
Now that Brotli has evolved and is supported by all browsers, we plan to enable Brotli on all zones by default in the coming months. Mirroring the Gzip behavior we currently support and removing the toggle from our dashboard. If browsers do not support Brotli, Cloudflare will continue to support their accepted encoding types such as Gzip or uncompressed and Enterprise customers will still be able to use Compression rules to granularly control how we compress data towards their users.
The future of web compression
We’ve seen great adoption and great performance for Brotli as the new compression technique for the web. Looking forward, we are closely following trends and new compression algorithms such as zstd as a possible next-generation compression algorithm.
At the same time, we’re looking to improve Brotli directly where we can. One development that we’re particularly focused on is shared dictionaries with Brotli. Whenever you compress an asset, you use a “dictionary” that helps the compression to be more efficient. A simple analogy of this is typing OMW into an iPhone message. The iPhone will automatically translate it into On My Way using its own internal dictionary.
O
M
W
O
n
M
y
W
a
y
This internal dictionary has taken three characters and morphed this into nine characters (including spaces) The internal dictionary has saved six characters which equals performance benefits for users.
By default, the Brotli RFC defines a static dictionary that both clients and the origin servers use. The static dictionary was designed to be general purpose and apply to everyone. Optimizing the size of the dictionary as to not be too large whilst able to generate best compression results. However, what if an origin could generate a bespoke dictionary tailored to a specific website? For example a Cloudflare-specific dictionary would allow us to compress the words and phrases that appear repeatedly on our site such as the word “Cloudflare”. The bespoke dictionary would be designed to compress this as heavily as possible and the browser using the same dictionary would be able to translate this back.
A new proposal by the Web Incubator CG aims to do just that, allowing you to specify your own dictionaries that browsers can use to allow websites to optimize compression further. We’re excited about contributing to this proposal and plan on publishing our research soon.
Try it now
Compression Rules are available now! With End to End Brotli being rolled out over the coming weeks. Allowing you to improve performance, reduce bandwidth and granularly control how Cloudflare handles compression to your end users.
Visit 1.1.1.1 from any device to get started with our free app that makes your Internet faster and safer.
To learn more about our mission to help build a better Internet, start here. If you’re looking for a new career direction, check out our open positions.
Every day, website visitors spend far too much time waiting for websites to load in their browsers. This waiting is partially due to browsers not knowing which resources are critically important so they can prioritize them ahead of less-critical resources. In this blog we will outline how millions of websites across the Internet can improve their performance by specifying which critical content loads first with Cloudflare Workers and what Cloudflare will do to make this easier by default in the future.
Popular Content Management Systems (CMS) like WordPress have made attempts to influence website resource priority, for example through techniques like lazy loading images. When done correctly, the results are magical. Performance is optimized between the CMS and browser without needing to implement any changes or coding new prioritization strategies. However, we’ve seen that these default priorities have opportunities to improve greatly.
In this co-authored blog with Google’s Patrick Meenan we will explain where the opportunities exist to improve website performance, how to check if a specific site can improve performance, and provide a small JavaScript snippet which can be used with Cloudflare Workers to do this optimization for you.
What happens when a browser receives the response?
Before we dive into where the opportunities are to improve website performance, let’s take a step back to understand how browsers load website assets by default.
After the browser sends a HTTP request to a server, it receives a HTTP response containing information like status codes, headers, and the requested content. The browser carefully analyzes the response’s status code and response headers to ensure proper handling of the content.
Next, the browser processes the content itself. For HTML responses, the browser extracts important information from the <head> section of the HTML, such as the page title, stylesheets, and scripts. Once this information is parsed, the browser moves on to the response <body> which has the actual page content. During this stage, the browser begins to present the webpage to the visitor.
If the response includes additional 3rd party resources like CSS, JavaScript, or other content, the browser may need to fetch and integrate them into the webpage. Typically, browsers like Google Chrome delay loading images until after the resources in the HTML <head> have loaded. This is also known as “blocking” the render of the webpage. However, developers can override this blocking behavior using fetch priority or other methods to boost other content’s priority in the browser. By adjusting an important image’s fetch priority, it can be loaded earlier, which can lead to significant improvements in crucial performance metrics like LCP (Largest Contentful Paint).
Images are so central to web pages that they have become an essential element in measuring website performance from Core Web Vitals. LCP measures the time it takes for the largest visible element, often an image, to be fully rendered on the screen. Optimizing the loading of critical images (like LCP images) can greatly enhance performance, improving the overall user experience and page performance.
But here’s the challenge – a browser may not know which images are the most important for the visitor experience (like the LCP image) until rendering begins. If the developer can identify the LCP image or critical elements before it reaches the browser, its priority can be increased at the server to boost website performance instead of waiting for the browser to naturally discover the critical images.
In our Smart Hints blog, we describe how Cloudflare will soon be able to automatically prioritize content on behalf of website developers, but what happens if there’s a need to optimize the priority of the images right now? How do you know if a website is in a suboptimal state and what can you do to improve?
Using Cloudflare, developers should be able to improve image performance with heuristics that identify likely-important images before the browser parses them so these images can have increased priority and be loaded sooner.
Identifying Image Priority opportunities
Just increasing the fetch priority of all images won’t help if they are lazy-loaded or not critical/LCP images. Lazy-loading is a method that developers use to generally improve the initial load of a webpage if it includes numerous out-of-view elements. For example, on Instagram, when you continually scroll down the application to see more images, it would only make sense to load those images when the user arrives at them otherwise the performance of the page load would be needlessly delayed by the browser eagerly loading these out-of-view images. Instead the highest priority should be given to the LCP image in the viewport to improve performance.
So developers are left in a situation where they need to know which images are on users’ screens/viewports to increase their priority and which are off their screens to lazy-load them.
Recently, we’ve seen attempts to influence image priority on behalf of developers. For example, by default, in WordPress 5.5 all images with an IMG tag and aspect ratios were directed to be lazy-loaded. While there are plugins and other methods WordPress developers can use to boost the priority of LCP images, lazy-loading all images in a default manner and not knowing which are LCP images can cause artificial performance delays in website performance (they’re working on this though, and have partially resolved this for block themes).
So how do we identify the LCP image and other critical assets before they get to the browser?
To evaluate the opportunity to improve image performance, we turned to the HTTP Archive. Out of the approximately 22 million desktop pages tested in February 2023, 46% had an LCP element with an IMG tag. Meaning that for page load metrics, LCP had an image included about half the time. Though, among these desktop pages, 8.5 million had the image in the static HTML delivered with the page, indicating a total potential improvement opportunity of approximately 39% of the desktop pages within the dataset.
In the case of mobile pages, out of the ~28.5 million tested, 40% had an LCP element as an IMG tag. Among these mobile pages, 10.3 million had the image in the static HTML delivered with the page, suggesting a potential improvement opportunity in around 36% of the mobile pages within the dataset.
However, as previously discussed, prioritizing an image won’t be effective if the image is lazy-loaded because the directives are contradictory. In the dataset, approximately 1.8 million LCP desktop images and 2.4 million LCP mobile images were lazy-loaded.
Therefore, across the Internet, the opportunity to improve image performance would be about ~30% of pages that have an LCP image in the original HTML markup that weren’t lazy-loaded, but with a more advanced Cloudflare Worker, the additional 9% of lazy-loaded LCP images can also be improved improved by removing the lazy-load attribute.
39% of desktop images seems like a lot of opportunity to improve image performance. So the next question is how can Cloudflare determine the LCP image across our network and automatically prioritize them?
Image Index
We thought that how soon the LCP image showed up in the HTML would serve as a useful indicator. So we analyzed the HTTP Archive dataset to see where the cumulative percentage of LCP images are discovered based on their position in the HTML, including lazy-loaded images.
We found that approximately 25% of the pages had the LCP image as the first image in the HTML (around 10% of all pages). Another 25% had the LCP image as the second image. WordPress seemed to arrive at a similar conclusion and recently released a development to remove the default lazy-load attribute from the first image on block themes, but there are opportunities to go further.
Our analysis revealed that implementing a straightforward rule like “do not lazy-load the first four images,” either through the browser, a content management system (CMS), or a Cloudflare Worker could address approximately 75% of the issue of lazy-loading LCP images (example Worker below).
Ignoring small images
In trying to find other ways to identify likely LCP images we next turned to the size of the image. To increase the likelihood of getting the LCP image early in the HTML, we looked into ignoring “small” images as they are unlikely to be big enough to be a LCP element. We explored several sizes and 10,000 pixels (less than 100×100) was a pretty reliable threshold that didn’t skip many LCP images and avoided a good chunk of the non-LCP images.
By ignoring small images (<10,000px), we found that the first image became the LCP image in approximately 30-34% of cases. Adding the second image increased this percentage to 56-60% of pages.
Therefore, to improve image priority, a potential approach could involve assigning a higher priority to the first four “not-small” images.
Chrome 114 Image Prioritization Experiment
An experiment running in Chrome 114 does exactly what we described above. Within the browser there are a few different prioritization knobs to play with that aren’t web-exposed so we have the opportunity to assign a “medium” priority to images that we want to boost automatically (directly controlling priority with “fetch priority” lets you set high or low). This will let us move the images ahead of other images, async scripts and parser-blocking scripts late in the body but still keep the boosted image priority below any high-priority requests, particularly dynamically-injected blocking scripts.
We are experimenting with boosting the priority of varying numbers of images (2, 5 and 10) and with allowing one of those medium-priority images to load at a time during Chromes “tight” mode (when it is loading the render-blocking resources in the head) to increase the likelihood that the LCP image will be available when the first paint is done.
The data is still coming in and no “ship” decisions have been made yet but the early results are very promising, improving the LCP time across the entire web for all arms of the experiment (not by massive amounts but moving the metrics of the whole web is notoriously difficult).
How to use Cloudflare Workers to boost performance
Now that we’ve seen that there is a large opportunity across the Internet for helping prioritize images for performance and how to identify images on individual pages that are likely LCP images, the question becomes, what would the results be of implementing a network-wide rule that could boost image priority from this study?
We built a test worker and deployed it on some WordPress test sites with our friends at Rocket.net, a WordPress hosting platform focused on performance. This worker boosts the priority of the first four images while removing the lazy-load attribute, if present. When deployed we saw good performance results and the expected image prioritization.
export default {
  async fetch(request) {
    const response = await fetch(request);

    // Check if the response is HTML
    const contentType = response.headers.get('Content-Type');
    if (!contentType || !contentType.includes('text/html')) {
      return response;
    }

    const transformedResponse = transformResponse(response);

    // Return the transformed response with streaming enabled
    return transformedResponse;
  },
};

async function transformResponse(response) {
  // Create an HTMLRewriter instance and define the image transformation logic
  const rewriter = new HTMLRewriter()
    .on('img', new ImageElementHandler());

  const transformedBody = await rewriter.transform(response).text()

  const transformresponse = new Response(transformedBody, response)

  // Return the transformed response with streaming enabled
  return transformresponse
}

class ImageElementHandler {
  constructor() {
    this.imageCount = 0;
    this.processedImages = new Set();
  }

  element(element) {
    const imgSrc = element.getAttribute('src');

    // Check if the image is small based on Chrome's criteria
    if (imgSrc && this.imageCount < 4 && !this.processedImages.has(imgSrc) && !isImageSmall(element)) {
      element.removeAttribute('loading');
      element.setAttribute('fetchpriority', 'high');
      this.processedImages.add(imgSrc);
      this.imageCount++;
    }
  }
}

function isImageSmall(element) {
  // Check if the element has width and height attributes
  const width = element.getAttribute('width');
  const height = element.getAttribute('height');

  // If width or height is 0, or width * height < 10000, consider the image as small
  if ((width && parseInt(width, 10) === 0) || (height && parseInt(height, 10) === 0)) {
    return true;
  }

  if (width && height) {
    const area = parseInt(width, 10) * parseInt(height, 10);
    if (area < 10000) {
      return true;
    }
  }

  return false;
}
When testing the Worker, we saw that default image priority was boosted into “high” for the first four images and the fifth image remained “low.” This resulted in an LCP range of “good” from a speed test. While this initial test is not a dispositive indicator that the Worker will boost performance in every situation, the results are promising and we look forward to continuing to experiment with this idea.
While we’ve experimented with WordPress sites to illustrate the issues and potential performance benefits, this issue is present across the Internet.
Website owners can help us experiment with the Worker above to improve the priority of images on their websites or edit it to be more specific by targeting likely LCP elements. Cloudflare will continue experimenting using a very similar process to understand how to safely implement a network-wide rule to ensure that images are correctly prioritized across the Internet and performance is boosted without the need to configure a specific Worker.
Automatic Platform Optimization
Cloudflare’s Automatic Platform Optimization (APO) is a plugin for WordPress which allows Cloudflare to deliver your entire WordPress site from our network ensuring consistent, fast performance for visitors. By serving cached sites, APO can improve performance metrics. APO does not currently have a way to prioritize images over other assets to improve browser render metrics or dynamically rewrite HTML, techniques we’ve discussed in this post. Although this presents a potential opportunity for future development, it requires thorough testing to ensure safe and reliable support.
In the future we’ll look to include the techniques discussed today as part of APO, however in the meantime we recommend using Snippets (and Experiments) to test with the code example above to see the performance impact on your website.
Get in touch!
If you are interested in using the JavaScript above, we recommended testing with Workers or using Cloudflare Snippets. We’d love to hear from you on what your results were. Get in touch via social media and share your experiences.
Visit 1.1.1.1 from any device to get started with our free app that makes your Internet faster and safer.
To learn more about our mission to help build a better Internet, start here. If you’re looking for a new career direction, check out our open positions.
Transferring your domains to a new registrar isn’t something you do every day, and getting any step of the process wrong could mean downtime and disruption. That’s why this Speed Week we’ve prepared a domain transfer checklist. We want to empower anyone to quickly transfer their domains to Cloudflare Registrar, without worrying about missing any steps along the way or being left with any unanswered questions.
Domain Transfer Checklist
Confirm eligibility
Confirm you want to use Cloudflare’s nameservers: We built our registrar specifically for customers who want to use other Cloudflare products. This means domains registered with Cloudflare can only use our nameservers. If your domain requires non-Cloudflare nameservers then we’re not the right registrar for you.
Confirm your domain is not a premium domain or internationalized domain name (IDNs): Cloudflare currently does not support premium domains or internationalized domain names (Unicode).
Confirm your domain hasn’t been registered or transferred in the past 60 days: ICANN rules prohibit a domain from being transferred if it has been registered or previously transferred within the last 60 days.
Confirm your WHOIS Registrant contact information hasn’t been updated in the past 60 days: ICANN rules also prohibit a domain from being transferred if the WHOIS Registrant contact information was modified in the past 60 days.
Before you transfer
Gather your credentials for your current registrar: Make sure you have your credentials for your current registrar. It’s possible you haven’t logged in for many years and you may have to reset your password.
Make note of your current DNS settings: Make note of your current DNS settings: When transferring your domain, Cloudflare will automatically scan your DNS records, but you’ll want to capture your current settings in case there are any issues. If your current provider supports it, you could use the standard BIND Zone File format to export your records.
Remove WHOIS privacy (if necessary): In most cases, domains may be transferred even if WHOIS privacy services have been enabled. However, some registrars may prohibit the transfer if the WHOIS privacy service has been enabled.
Renew your domain if up for renewal in the next 15 days: If your domain is up for renewal, you’ll need to renew it with your current registrar before initiating a transfer to Cloudflare.
Unlock the domain: Registrars include a lightweight safeguard to prevent unauthorized users from starting domain transfers – often called a registrar or domain lock. This lock prevents any other registrar from attempting to initiate a transfer. Only the registrant can enable or disable this lock, typically through the administration interface of the registrar.
Sign up for Cloudflare: If you don’t already have a Cloudflare account, you can sign up here.
Add your domain to Cloudflare: You can add a new domain to your Cloudflare account by following these instructions.
Add a valid credit card to your Cloudflare account: If you haven’t already added a payment method into your Cloudflare dashboard billing profile, you’ll be prompted to add one when you add your domain.
Wait for your DNS changes to propagate: Registrars can take up to 24 hours to process nameserver updates. You will receive an email when Cloudflare has confirmed that these changes are in place. You can’t proceed with transferring your domain until this process is complete.
Initiating and confirming transfer process
Request an authorization code: Cloudflare needs to confirm with your old registrar that the transfer flow is authorized. To do that, your old registrar will provide an authorization code to you. This code is often referred to as an authorization code, auth code, authinfo code, or transfer code. You will need to input that code to complete your transfer to Cloudflare. We will use it to confirm the transfer is authentic.
Initiate your transfer to Cloudflare: Visit the Transfer Domains section of your Cloudflare dashboard. Here you’ll be presented with any domains available for transfer. If your domain isn’t showing, ensure you completed all the proceeding steps. If you have, review the list on this page to see if any apply to your domain.
Review the transfer price: When you transfer a domain, you are required by ICANN to pay to extend its registration by one year from the expiration date. You will not be billed at this step. Cloudflare will only bill your card when you input the auth code and confirm the contact information at the conclusion of your transfer request.
Input your authorization code: In the next page, input the authorization code for each domain you are transferring.
Confirm or input your contact information: In the final stage of the transfer process, input the contact information for your registration. Cloudflare Registrar redacts this information by default but is required to collect the authentic contact information for this registration.
Approve the transfer with Cloudflare: Once you have requested your transfer, Cloudflare will begin processing it, and send a Form of Authorization (FOA) email to the registrant, if the information is available in the public WHOIS database. The FOA is what authorizes the domain transfer.
Approve the transfer with your previous registrar: After this step, your previous registrar will also email you to confirm your request to transfer. Most registrars will include a link to confirm the transfer request. If you follow that link, you can accelerate the transfer operation. If you do not act on the email, the registrar can wait up to five days to process the transfer to Cloudflare. You may also be able to approve the transfer from within your current registrar dashboard.
Follow your transfer status in your Cloudflare dashboard: Your domain transfer status will be viewable under Account Home > Overview > Domain Registration for your domain.
After you transfer
Test your site and email: After the transfer is complete, you’ll want to test your site to ensure everything is working properly. If you encounter any issues or have any questions you can always talk with us on our community forums or Discord server.
Visit 1.1.1.1 from any device to get started with our free app that makes your Internet faster and safer.
To learn more about our mission to help build a better Internet, start here. If you’re looking for a new career direction, check out our open positions.
Internet connections are most often marketed and sold on the basis of “speed”, with providers touting the number of megabits or gigabits per second that their various service tiers are supposed to provide. This marketing has largely been successful, as most subscribers believe that “more is better”. Furthermore, many national broadband plans in countries around the world include specific target connection speeds. However, even with a high speed connection, gamers may encounter sluggish performance, while video conference participants may experience frozen video or audio dropouts. Speeds alone don’t tell the whole story when it comes to Internet connection quality.
Additional factors like latency, jitter, and packet loss can significantly impact end user experience, potentially leading to situations where higher speed connections actually deliver a worse user experience than lower speed connections. Connection performance and quality can also vary based on usage – measured average speed will differ from peak available capacity, and latency varies under loaded and idle conditions.
The new Cloudflare Radar Internet Quality page
A little more than three years ago, as residential Internet connections were strained because of the shift towards working and learning from home due to the COVID-19 pandemic, Cloudflare announced the speed.cloudflare.com speed test tool, which enabled users to test the performance and quality of their Internet connection. Within the tool, users can download the results of their individual test as a CSV, or share the results on social media. However, there was no aggregated insight into Cloudflare speed test results at a network or country level to provide a perspective on connectivity characteristics across a larger population.
Today, we are launching these long-missing aggregated connection performance and quality insights on Cloudflare Radar. The new Internet Quality page provides both country and network (autonomous system) level insight into Internet connection performance (bandwidth) and quality (latency, jitter) over time. (Your Internet service provider is likely an autonomous system with its own autonomous system number (ASN), and many large companies, online platforms, and educational institutions also have their own autonomous systems and associated ASNs.) The insights we are providing are presented across two sections: the Internet Quality Index (IQI), which estimates average Internet quality based on aggregated measurements against a set of Cloudflare & third-party targets, and Connection Quality, which presents peak/best case connection characteristics based on speed.cloudflare.com test results aggregated over the previous 90 days. (Details on our approach to the analysis of this data are presented below.)
Users may note that individual speed test results, as well as the aggregate speed test results presented on the Internet Quality page will likely differ from those presented by other speed test tools. This can be due to a number of factors including differences in test endpoint locations (considering both geographic and network distance), test content selection, the impact of “rate boosting” by some ISPs, and testing over a single connection vs. multiple parallel connections. Infrequent testing (on any speed test tool) by users seeking to confirm perceived poor performance or validate purchased speeds will also contribute to the differences seen in the results published by the various speed test platforms.
And as we announced in April, Cloudflare has partnered with Measurement Lab (M-Lab) to create a publicly-available, queryable repository for speed test results. M-Lab is a non-profit third-party organization dedicated to providing a representative picture of Internet quality around the world. M-Lab produces and hosts the Network Diagnostic Tool, which is a very popular network quality test that records millions of samples a day. Given their mission to provide a publicly viewable, representative picture of Internet quality, we chose to partner with them to provide an accurate view of your Internet experience and the experience of others around the world using openly available data.
Connection speed & quality data is important
While most advertisements for fixed broadband and mobile connectivity tend to focus on download speeds (and peak speeds at that), there’s more to an Internet connection, and the user’s experience with that Internet connection, than that single metric. In addition to download speeds, users should also understand the upload speeds that their connection is capable of, as well as the quality of the connection, as expressed through metrics known as latency and jitter. Getting insight into all of these metrics provides a more well-rounded view of a given Internet connection, or in aggregate, the state of Internet connectivity across a geography or network.
The concept of download speeds are fairly well understood as a measure of performance. However, it is important to note that the average download speeds experienced by a user during common Web browsing activities, which often involves the parallel retrieval of multiple smaller files from multiple hosts, can differ significantly from peak download speeds, where the user is downloading a single large file (such as a video or software update), which allows the connection to reach maximum performance. The bandwidth (speed) available for upload is sometimes mentioned in ISP advertisements, but doesn’t receive much attention. (And depending on the type of Internet connection, there’s often a significant difference between the available upload and download speeds.) However, the importance of upload came to the forefront in 2020 as video conferencing tools saw a surge in usage as both work meetings and school classes shifted to the Internet during the COVID-19 pandemic. To share your audio and video with other participants, you need sufficient upload bandwidth, and this issue was often compounded by multiple people sharing a single residential Internet connection.
Latency is the time it takes data to move through the Internet, and is measured in the number of milliseconds that it takes a packet of data to go from a client (such as your computer or mobile device) to a server, and then back to the client. In contrast to speed metrics, lower latency is preferable. This is especially true for use cases like online gaming where latency can make a difference between a character’s life and death in the game, as well as video conferencing, where higher latency can cause choppy audio and video experiences, but it also impacts web page performance. The latency metric can be further broken down into loaded and idle latency. The former measures latency on a loaded connection, where bandwidth is actively being consumed, while the latter measures latency on an “idle” connection, when there is no other network traffic present. (These specific loaded and idle definitions are from the device’s perspective, and more specifically, from the speed test application’s perspective. Unless the speed test is being performed directly from a router, the device/application doesn’t have insight into traffic on the rest of the network.) Jitter is the average variation found in consecutive latency measurements, and can be measured on both idle and loaded connections. A lower number means that the latency measurements are more consistent. As with latency, Internet connections should have minimal jitter, which helps provide more consistent performance.
Our approach to data analysis
The Internet Quality Index (IQI) and Connection Quality sections get their data from two different sources, providing two different (albeit related) perspectives. Under the hood they share some common principles, though.
IQI builds upon the mechanism we already use to regularly benchmark ourselves against other industry players. It is based on end user measurements against a set of Cloudflare and third-party targets, meant to represent a pattern that has become very common in the modern Internet, where most content is served from distribution networks with points of presence spread throughout the world. For this reason, and by design, IQI will show worse results for regions and Internet providers that rely on international (rather than peering) links for most content.
IQI is also designed to reflect the traffic load most commonly associated with web browsing, rather than more intensive use. This, and the chosen set of measurement targets, effectively biases the numbers towards what end users experience in practice (where latency plays an important role in how fast things can go).
For each metric covered by IQI, and for each ASN, we calculate the 25th percentile, median, and 75th percentile at 15 minute intervals. At the country level and above, the three calculated numbers for each ASN visible from that region are independently aggregated. This aggregation takes the estimated user population of each ASN into account, biasing the numbers away from networks that source a lot of automated traffic but have few end users.
The Connection Quality section gets its data from the Cloudflare Speed Test tool, which exercises a user’s connection in order to see how well it is able to perform. It measures against the closest Cloudflare location, providing a good balance of realistic results and network proximity to the end user. We have a presence in 285 cities around the world, allowing us to be pretty close to most users.
Similar to the IQI, we calculate the 25th percentile, median, and 75th percentile for each ASN. But here these three numbers are immediately combined using an operation called the trimean — a single number meant to balance the best connection quality that most users have, with the best quality available from that ASN (users may not subscribe to the best available plan for a number of reasons).
Because users may choose to run a speed test for different motives at different times, and also because we take privacy very seriously and don’t record any personally identifiable information along with test results, we aggregate at 90-day intervals to capture as much variability as we can.
At the country level and above, the calculated trimean for each ASN in that region is aggregated. This, again, takes the estimated user population of each ASN into account, biasing the numbers away from networks that have few end users but which may still have technicians using the Cloudflare Speed Test to assess the performance of their network.
Navigating the Internet Quality page
The new Internet Quality page includes three views: Global, country-level, and autonomous system (AS). In line with the other pages on Cloudflare Radar, the country-level and AS pages show the same data sets, differing only in their level of aggregation. Below, we highlight the various components of the Internet Quality page.
Global
The top section of the global (worldwide) view includes time series graphs of the Internet Quality Index metrics aggregated at a continent level. The time frame shown in the graphs is governed by the selection made in the time frame drop down at the upper right of the page, and at launch, data for only the last three months is available. For users interested in examining a specific continent, clicking on the other continent names in the legend removes them from the graph. Although continent-level aggregation is still rather coarse, it still provides some insight into regional Internet quality around the world.
Further down the page, the Connection Quality section presents a choropleth map, with countries shaded according to the values of the speed, latency, or jitter metric selected from the drop-down menu. Hovering over a country displays a label with the country’s name and metric value, and clicking on the country takes you to the country’s Internet Quality page. Note that in contrast to the IQI section, the Connection Quality section always displays data aggregated over the previous 90 days.
Country-level
Within the country-level page (using Canada as an example in the figures below), the country’s IQI metrics over the selected time frame are displayed. These time series graphs show the median bandwidth, latency, and DNS response time within a shaded band bounded at the 25th and 75th percentile and represent the average expected user experience across the country, as discussed in the Our approach to data analysis section above.
Below that is the Connection Quality section, which provides a summary view of the country’s measured upload and download speeds, as well as latency and jitter, over the previous 90 days. The colored wedges in the Performance Summary graph are intended to illustrate aggregate connection quality at a glance, with an “ideal” connection having larger upload and download wedges and smaller latency and jitter wedges. Hovering over the wedges displays the metric’s value, which is also shown in the table to the right of the graph.
Below that, the Bandwidth and Latency/Jitter histograms illustrate the bucketed distribution of upload and download speeds, and latency and jitter measurements. In some cases, the speed histograms may show a noticeable bar at 1 Gbps, or 1000 ms (1 second) on the latency/jitter histograms. The presence of such a bar indicates that there is a set of measurements with values greater than the 1 Gbps/1000 ms maximum histogram values.
Autonomous system level
Within the upper-right section of the country-level page, a list of the top five autonomous systems within the country is shown. Clicking on an ASN takes you to the Performance page for that autonomous system. For others not displayed in the top five list, you can use the search bar at the top of the page to search by autonomous system name or number. The graphs shown within the AS level view are identical to those shown at a country level, but obviously at a different level of aggregation. You can find the ASN that you are connected to from the My Connection page on Cloudflare Radar.
Exploring connection performance & quality data
Digging into the IQI and Connection Quality visualizations can surface some interesting observations, including characterizing Internet connections, and the impact of Internet disruptions, including shutdowns and network issues. We explore some examples below.
Characterizing Internet connections
Verizon FiOS is a residential fiber-based Internet service available to customers in the United States. Fiber-based Internet services (as opposed to cable-based, DSL, dial-up, or satellite) will generally offer symmetric upload and download speeds, and the FiOS plans page shows this to be the case, offering 300 Mbps (upload & download), 500 Mbps (upload & download), and “1 Gig” (Verizon claims average wired speeds between 750-940 Mbps download / 750-880 Mbps upload) plans. Verizon carries FiOS traffic on AS701 (labeled UUNET due to a historical acquisition), and in looking at the bandwidth histogram for AS701, several things stand out. The first is a rough symmetry in upload and download speeds. (A cable-based Internet service provider, in contrast, would generally show a wide spread of download speeds, but have upload speeds clustered at the lower end of the range.) Another is the peaks around 300 Mbps and 750 Mbps, suggesting that the 300 Mbps and “1 Gig” plans may be more popular than the 500 Mbps plan. It is also clear that there are a significant number of test results with speeds below 300 Mbps. This is due to several factors: one is that Verizon also carries lower speed non-FiOS traffic on AS701, while another is that erratic nature of in-home WiFi often means that the speeds achieved on a test will be lower than the purchased service level.
Traffic shifts drive latency shifts
On May 9, 2023, the government of Pakistan ordered the shutdown of mobile network services in the wake of protests following the arrest of former Prime Minister Imran Khan. Our blog post covering this shutdown looked at the impact from a traffic perspective. Within the post, we noted that autonomous systems associated with fixed broadband networks saw significant increases in traffic when the mobile networks were shut down – that is, some users shifted to using fixed networks (home broadband) when mobile networks were unavailable.
Examining IQI data after the blog post was published, we found that the impact of this traffic shift was also visible in our latency data. As can be seen in the shaded area of the graph below, the shutdown of the mobile networks resulted in the median latency dropping about 25% as usage shifted from higher latency mobile networks to lower latency fixed broadband networks. An increase in latency is visible in the graph when mobile connectivity was restored on May 12.
Bandwidth shifts as a potential early warning sign
On April 4, UK mobile operator Virgin Media suffered several brief outages. In examining the IQI bandwidth graph for AS5089, the ASN used by Virgin Media (formerly branded as NTL), indications of a potential problem are visible several days before the outages occurred, as median bandwidth dropped by about a third, from around 35 Mbps to around 23 Mbps. The outages are visible in the circled area in the graph below. Published reports indicate that the problems lasted into April 5, in line with the lower median bandwidth measured through mid-day.
Submarine cable issues cause slower browsing
On June 5, Philippine Internet provider PLDTTweeted an advisory that noted “One of our submarine cable partners confirms a loss in some of its internet bandwidth capacity, and thus causing slower Internet browsing.” IQI latency and bandwidth graphs for AS9299, a primary ASN used by PLDT, shows clear shifts starting around 06:45 UTC (14:45 local time). Median bandwidth dropped by half, from 17 Mbps to 8 Mbps, while median latency increased by 75% from 37 ms to around 65 ms. 75th percentile latency also saw a significant increase, nearly tripling from 63 ms to 180 ms coincident with the reported submarine cable issue.
Conclusion
Making network performance and quality insights available on Cloudflare Radar supports Cloudflare’s mission to help build a better Internet. However, we’re not done yet – we have more enhancements planned. These include making data available at a more granular geographical level (such as state and possibly city), incorporating AIM scores to help assess Internet quality for specific types of use cases, and embedding the Cloudflare speed test directly on Radar using the open source JavaScript module.
In the meantime, we invite you to use speed.cloudflare.com to test the performance and quality of your Internet connection, share any country or AS-level insights you discover on social media (tag @CloudflareRadar on Twitter or @radar@cloudflare.social on Mastodon), and explore the underlying data through the M-Lab repository or the Radar API.
Visit 1.1.1.1 from any device to get started with our free app that makes your Internet faster and safer.
To learn more about our mission to help build a better Internet, start here. If you’re looking for a new career direction, check out our open positions.
CDNs help keep Microsoft 365 fast and reliable for end users. Cloud services like Microsoft 365 use CDNs to cache static assets closer to the browsers requesting them to speed up downloads and reduce perceived end user latency. The information in this topic will help you learn about Content Delivery Networks (CDNs) and how they’re used by Microsoft 365.
What exactly is a CDN?
A CDN is a geographically distributed network consisting of proxy and file servers in datacenters connected by high-speed backbone networks. CDNs are used to reduce latency and load times for a specified set of files and objects in a web site or service. A CDN may have many thousands of endpoints for optimal servicing of incoming requests from any location.
CDNs are commonly used to provide faster downloads of generic content for a web site or service such as Javascript files, icons and images, and can also provide private access to user content such as files in SharePoint Online document libraries, streaming media files, and custom code.
CDNs are used by most enterprise cloud services. Cloud services like Microsoft 365 have millions of customers downloading a mix of proprietary content (such as emails) and generic content (such as icons) at one time. It’s more efficient to put images everyone uses, like icons, as close to the user’s computer as possible. It isn’t practical for every cloud service to build CDN datacenters that store this generic content in every metropolitan area, or even in every major Internet hub around the world, so some of these CDNs are shared.
How do CDNs make services work faster?
Downloading common objects like site images and icons over and over again can take up network bandwidth that can be better used for downloading important personal content, like email or documents. Because Microsoft 365 uses an architecture that includes CDNs, the icons, scripts, and other generic content can be downloaded from servers closer to client computers, making the downloads faster. This means faster access to your personal content, which is securely stored in Microsoft 365 datacenters.
CDNs help to improve cloud service performance in several ways:
CDNs shift part of the network and file download burden away from the cloud service, freeing up cloud service resources for serving user content and other services by reducing the need to serve requests for static assets.
CDNs are purpose built to provide low-latency file access by implementing high performance networks and file servers, and by leveraging updated network protocols such as HTTP/2 with highly efficient compression and request multiplexing.
CDN networks use many globally distributed endpoints to make content available as close as possible to users.
The Microsoft 365 CDN
The built-in Microsoft 365 Content Delivery Network (CDN) allows Microsoft 365 administrators to provide better performance for their organization’s SharePoint Online pages by caching static assets closer to the browsers requesting them, which helps to speed up downloads and reduce latency. The Microsoft 365 CDN uses the HTTP/2 protocol for improved compression and download speeds.
Note
The Microsoft 365 CDN is only available to tenants in the Production (worldwide) cloud. Tenants in the US Government, China and Germany clouds do not currently support the Microsoft 365 CDN.
The Microsoft 365 CDN is composed of multiple CDNs that allow you to host static assets in multiple locations, or origins, and serve them from global high-speed networks. Depending on the kind of content you want to host in the Microsoft 365 CDN, you can add public origins, private origins or both.
Content in public origins within the Microsoft 365 CDN is accessible anonymously, and can be accessed by anyone who has URLs to hosted assets. Because access to content in public origins is anonymous, you should only use them to cache non-sensitive generic content such as Javascript files, scripts, icons and images. The Microsoft 365 CDN is used by default for downloading generic resource assets like the Microsoft 365 client applications from a public origin.
Private origins within the Microsoft 365 CDN provide private access to user content such as SharePoint Online document libraries, sites and proprietary images. Access to content in private origins is secured with dynamically generated tokens so it can only be accessed by users with permissions to the original document library or storage location. Private origins in the Microsoft 365 CDN can only be used for SharePoint Online content, and you can only access assets through redirection from your SharePoint Online tenant.
The Microsoft 365 CDN service is included as part of your SharePoint Online subscription.
Although not a part of the Microsoft 365 CDN, you can use these CDNs in your Microsoft 365 tenant for access to SharePoint development libraries, custom code and other purposes that fall outside the scope of the Microsoft 365 CDN.
Azure CDN
Note
Beginning in Q3 2020, SharePoint Online will begin caching videos on the Azure CDN to support improved video playback and reliability. Popular videos will be streamed from the CDN endpoint closest to the user. This data will remain within the Microsoft Purview boundary. This is a free service for all tenants and it does not require any customer action to configure.
You can use the Azure CDN to deploy your own CDN instance for hosting custom web parts, libraries and other resource assets, which allows you to apply access keys to your CDN storage and exert greater control over your CDN configuration. Use of the Azure CDN isn’t free, and requires an Azure subscription.
Microsoft’s Ajax CDN is a read-only CDN that offers many popular development libraries including jQuery (and all of its other libraries), ASP.NET Ajax, Bootstrap, Knockout.js, and others.
To include these scripts in your project, simply replace any references to these publicly available libraries with references to the CDN address instead of including it in your project itself. For example, use the following code to link to jQuery:
For more information about how to use the Microsoft Ajax CDN, see Microsoft Ajax CDN.
How does Microsoft 365 use content from a CDN?
Regardless of what CDN you configure for your Microsoft 365 tenant, the basic data retrieval process is the same.
Your client (a browser or Office client application) requests data from Microsoft 365.
Microsoft 365 either returns the data directly to your client or, if the data is part of a set of content hosted by the CDN, redirects your client to the CDN URL.a. If the data is already cached in a public origin, your client downloads the data directly from the nearest CDN location to your client.b. If the data is already cached in a private origin, the CDN service checks your Microsoft 365 user account’s permissions on the origin. If you have permissions, SharePoint Online dynamically generates a custom URL composed of the path to the asset in the CDN and two access tokens, and returns the custom URL to your client. Your client then downloads the data directly from the nearest CDN location to your client using the custom URL.
If the data isn’t cached at the CDN, the CDN node requests the data from Microsoft 365 and then caches the data for time after your client downloads the data.
The CDN figures out the closest datacenter to the user’s browser and, using redirection, downloads the requested data from there. CDN redirection is quick, and can save users a lot of download time.
How should I set up my network so that CDNs work best with Microsoft 365?
Minimizing latency between clients on your network and CDN endpoints is the key consideration for ensuring optimal performance. You can use the best practices outlined in Managing Microsoft 365 endpoints to ensure that your network configuration permits client browsers to access the CDN directly rather than routing CDN traffic through central proxies to avoid introducing unnecessary latency.
Is there a list of all the CDNs that Microsoft 365 uses?
The CDNs in use by Microsoft 365 are always subject to change and in many cases there are multiple CDN partners configured in the event one is unavailable. The primary CDNs used by Microsoft 365 are:
CDN
Company
Usage
Link
Microsoft 365 CDN
Microsoft Azure
Generic assets in public origins, SharePoint user content in private origins
There are many factors involved in measuring specific differences in performance between data downloaded directly from Microsoft 365 and data downloaded from a specific CDN, such as your location relative to your tenant and to the nearest CDN endpoint, the number of assets on a page that are served by the CDN, and transient changes in network latency and bandwidth. However, a simple A/B test can help to show the difference in download time for a specific file.
The following screenshots illustrate the difference in download speed between the native file location in Microsoft 365 and the same file hosted on the Microsoft Ajax Content Delivery Network. These screenshots are from the Network tab in the Internet Explorer 11 developer tools. These screenshots show the latency on the popular library jQuery. To bring up this screen, in Internet Explorer, press F12 and select the Network tab, which is symbolized with a Wi-Fi icon.
This screenshot shows the library uploaded to the master page gallery on the SharePoint Online site itself. The time it took to upload the library is 1.51 seconds.
The second screenshot shows the same file delivered by Microsoft’s CDN. This time the latency is around 496 milliseconds. This is a large improvement and shows that a whole second is shaved off the total time to download the object.
Is my data safe?
We take great care to protect the data that runs your business. Data stored in the Microsoft 365 CDN is encrypted both in transit and at rest, and access to data in the Microsoft 365 SharePoint CDN is secured by Microsoft 365 user permissions and token authorization. Requests for data in the Microsoft 365 SharePoint CDN must be referred (redirected) from your Microsoft 365 tenant or an authorization token won’t be generated.
To ensure that your data remains secure, we recommend that you never store user content or other sensitive data in a public CDN. Because access to data in a public CDN is anonymous, public CDNs should only be used to host generic content such as web script files, icons, images and other non-sensitive assets.
Note
3rd party CDN providers may have privacy and compliance standards that differ from the commitments outlined by the Microsoft 365 Trust Center. Data cached through the CDN service may not conform to the Microsoft Data Processing Terms (DPT), and may be outside of the Microsoft 365 Trust Center compliance boundaries.
For in-depth information about privacy and data protection for Microsoft 365 CDN providers, visit the following:
Learn more about Microsoft 365 privacy and data protection at the Microsoft Trust Center
Learn more about Azure privacy and data protection at the Azure Trust Center
How can I secure my network with all these 3rd party services?
Using an extensive set of partner services allows Microsoft 365 to scale and meet availability requirements and enhance the user experience when using Microsoft 365. The 3rd party services Microsoft 365 leverages include both certificate revocation lists; such as crl.microsoft.com or sa.symcb.com, and CDNs; such as r3.res.outlook.com. Every CDN FQDN generated by Microsoft 365 is a custom FQDN for Microsoft 365. If you’re sent to a FQDN at the request of Microsoft 365, you can be assured that the CDN provider controls the FQDN and the underlying content at that location.
For customers that want to segregate requests destined for a Microsoft 365 datacenter from requests that are destined for a 3rd party, we’ve written up guidance on Managing Microsoft 365 endpoints.
Is there a list of all the FQDNs that leverage CDNs?
The list of FQDNs and how they leverage CDNs change over time. Refer to our published Microsoft 365 URLs and IP address ranges page to get up to date on the latest FQDNs that leverage CDNs.
Can I use my own CDN and cache content on my local network?
We’re continually looking for new ways to support our customers’ needs and are currently exploring the use of caching proxy solutions and other on-premises CDN solutions.
Although it isn’t a part of the Microsoft 365 CDN, you can also use the Azure CDN for hosting custom web parts, libraries and other resource assets, which allows you to apply access keys to your CDN storage and exert greater control over your CDN configuration. Use of the Azure CDN isn’t free, and requires an Azure subscription. For more information on how to configure an Azure CDN instance, see Quickstart: Integrate an Azure storage account with Azure CDN.
I’m using Azure ExpressRoute for Microsoft 365, does that change things?
Azure ExpressRoute for Microsoft 365 provides a dedicated connection to Microsoft 365 infrastructure that is segregated from the public internet. This means that clients will still need to connect over non-ExpressRoute connections to connect to CDNs and other Microsoft infrastructure that isn’t explicitly included in the list of services supported by ExpressRoute. For more information about how to route specific traffic such as requests destined for CDNs, see Implementing ExpressRoute for Microsoft 365.
Can I use CDNs with SharePoint Server on-premises?
Using CDNs only makes sense in a SharePoint Online context and should be avoided with SharePoint Server. This is because all of the advantages around geographic location don’t hold true if the server is located on-premises or geographically close anyway. Additionally, if there’s a network connection to the servers where it’s hosted, then the site may be used without an Internet connection and therefore can’t retrieve the CDN files. Otherwise, you should use a CDN if there’s one available and stable for the library and files you need for your site.
Office 365 requires connectivity to the Internet. The endpoints below should be reachable for customers using Office 365 plans, including Government Community Cloud (GCC).
Start with Managing Office 365 endpoints to understand our recommendations for managing network connectivity using this data. Endpoints data is updated as needed at the beginning of each month with new IP Addresses and URLs published 30 days in advance of being active. This cadence allows for customers who don’t yet have automated updates to complete their processes before new connectivity is required. Endpoints may also be updated during the month if needed to address support escalations, security incidents, or other immediate operational requirements. The data shown on this page below is all generated from the REST-based web services. If you’re using a script or a network device to access this data, you should go to the Web service directly.
Endpoint data below lists requirements for connectivity from a user’s machine to Office 365. For detail on IP addresses used for network connections from Microsoft into a customer network, sometimes called hybrid or inbound network connections, see Additional endpoints for more information.
The endpoints are grouped into four service areas representing the three primary workloads and a set of common resources. The groups may be used to associate traffic flows with a particular application, however given that features often consume endpoints across multiple workloads, these groups can’t effectively be used to restrict access.
Data columns shown are:
ID: The ID number of the row, also known as an endpoint set. This ID is the same as is returned by the web service for the endpoint set.
Category: Shows whether the endpoint set is categorized as Optimize, Allow, or Default. This column also lists which endpoint sets are required to have network connectivity. For endpoint sets that aren’t required to have network connectivity, we provide notes in this field to indicate what functionality would be missing if the endpoint set is blocked. If you’re excluding an entire service area, the endpoint sets listed as required don’t require connectivity.You can read about these categories and guidance for their management in New Office 365 endpoint categories.
ER: This is Yes if the endpoint set is supported over Azure ExpressRoute with Office 365 route prefixes. The BGP community that includes the route prefixes shown aligns with the service area listed. When ER is No, this means that ExpressRoute is not supported for this endpoint set.Some routes may be advertised in more than one BGP community, making it possible for endpoints within a given IP range to traverse the ER circuit, but still be unsupported. In all cases, the value of a given endpoint set’s ER column should be respected.
Addresses: Lists the FQDNs or wildcard domain names and IP address ranges for the endpoint set. Note that an IP address range is in CIDR format and may include many individual IP addresses in the specified network.
Ports: Lists the TCP or UDP ports that are combined with listed IP addresses to form the network endpoint. You may notice some duplication in IP address ranges where there are different ports listed.
Note
Microsoft has begun a long-term transition to providing services from the cloud.microsoft namespace to simplify the endpoints managed by our customers. If you are following existing guidance for allowing access to required endpoints as listed below, there’s no further action required from you.
Default Optional Notes: Some Office 365 features require endpoints within these domains (including CDNs). Many specific FQDNs within these wildcards have been published recently as we work to either remove or better explain our guidance relating to these wildcards.
Default Optional Notes: Connection to the speech service is required for Office Dictation features. If connectivity is not allowed, Dictation will be disabled.
No
officespeech.platform.bing.com
TCP: 443
147
Default Required
No
*.office.com, www.microsoft365.com
TCP: 443, 80
152
Default Optional Notes: These endpoints enables the Office Scripts functionality in Office clients available through the Automate tab. This feature can also be disabled through the Office 365 Admin portal.
TeamViewer is designed to connect easily to remote computers without any special firewall configurations being necessary.
This article applies to all users in all licenses.
In the vast majority of cases, TeamViewer will always work if surfing on the internet is possible. TeamViewer makes outbound connections to the internet, which are usually not blocked by firewalls.
However, in some situations, for example in a corporate environment with strict security policies, a firewall might be set up to block all unknown outbound connections, and in this case, you will need to configure the firewall to allow TeamViewer to connect out through it.
TeamViewer ‘s Ports
These are the ports that TeamViewer needs to use.
TCP/UDP Port 5938
TeamViewer prefers to make outbound TCP and UDP connections over port 5938 – this is the primary port it uses, and TeamViewer performs best using this port. Your firewall should allow this at a minimum.
TCP Port 443
If TeamViewer can’t connect over port 5938, it will next try to connect over TCP port 443.
However, our mobile apps running on iOS and Windows Mobile don’t use port 443.
📌Note: port 443 is also used by our custom modules which are created in the Management Console. If you’re deploying a custom module, eg. through Group Policy, then you need to ensure that port 443 is open on the computers to which you’re deploying. Port 443 is also used for a few other things, including TeamViewer (Classic) update checks.
TCP Port 80
If TeamViewer can’t connect over port 5938 or 443, then it will try on TCP port 80. The connection speed over this port is slower and less reliable than ports 5938 or 443, due to the additional overhead it uses, and there is no automatic reconnection if the connection is temporarily lost. For this reason port 80 is only used as a last resort.
Our mobile apps running on Windows Mobile don’t use port 80. However, our iOS and Android apps can use port 80 if necessary.
Windows Mobile
Our mobile apps running on Windows Mobile can only connect out over port 5938. If the TeamViewer app on your mobile device won’t connect and tells you to “check your internet connection”, it’s probably because this port is being blocked by your mobile data provider or your WiFi router/firewall.
Destination IP addresses
The TeamViewer software makes connections to our master servers located around the world. These servers use a number of different IP address ranges, which are also frequently changing. As such, we are unable to provide a list of our server IPs. However, all of our IP addresses have PTR records that resolve to *.teamviewer.com. You can use this to restrict the destination IP addresses that you allow through your firewall or proxy server.
Having said that, from a security point-of-view this should not really be necessary – TeamViewer only ever initiates outgoing data connections through a firewall, so it is sufficient to simply block all incoming connections on your firewall and only allow outgoing connections over port 5938, regardless of the destination IP address.
At Fastly we often highlight our powerful POPs and modern architecture when asked how we’re different, and better than the competition. Today we’re excited to give you another peek under the hood at the kind of innovation we can achieve on a modern network that is fully software-defined.
This past February, Fastly delivered a new record of 81.9 Tbps of traffic during the Super Bowl, and absolutely no one had to do anything with egress policies to manage that traffic over the course of the event thanks to Autopilot. Autopilot is our new zero-touch egress traffic engineering automation system, and because it was running, no manual interventions were required even for this record-breaking day of service. This means that for the first time ever at Fastly we set a new traffic record for the Fastly network while reducing the number of people who were needed to manage it. (And we notably reduced that number all the way to zero.) It took a lot of people across different Fastly teams, working incredibly hard, to improve the self-managing capabilities of our network, and the result is a network with complete automation that can react quickly and more frequently to failures, congestion, and performance degradation with zero manual intervention.
Autopilot brings many benefits to Fastly, but it is even better for our customers who can now be even more confident in our ability to manage events like network provider failures or DDoS attacks and unexpected traffic spikes — all while maintaining a seamless and unimpacted experience for their end users. Let’s look at how we got here, and just how well Autopilot works. (Oh, but if you’re not a customer yet, get in touch or get started with our free tier. This is the network you want to be on.)
Getting to this result required a lot of effort over several years. Exactly three years ago, we shared how we managed the traffic during the 2020 Super Bowl. At that time, an earlier generation of our traffic engineering automation would route traffic around common capacity bottlenecks while requiring operators to deal with only the most complex cases. That approach served us well for the traffic and network footprint we had three years ago, but it still limited our ability to scale our traffic and network footprint because, while we had reduced human involvement, people were still required to deal reactively with capacity. This translates to hiring and onboarding becoming a bottleneck of its own as we would need to scale the number of network operators at least at the same rate of the expansion of our network. On top of that, while we can prepare and be effective during a planned event like a Super Bowl, human neurophysiology is not always at its peak performance when woken up in the middle of the night to deal with unexpected internet weather events.
Achieving Complete automation with Autopilot and Precision Path
The only way forward was to remove humans from the picture entirely. This single improvement allows us to scale easily while also greatly improving our handling of capacity and performance issues. Manual interventions have a cost. They require a human to reason about the problem at hand and make a decision. This cannot be performed infinite times, so that requires us to preserve energy and only act when the problem is large enough to impact customer performance. It also means that when a human-driven action is taken, it normally moves a larger amount of traffic to avoid having to deal with the same issue again soon, and to minimize the amount of human interventions needed.
A modern CDN gives you huge improvements in caching, SEO, performance, conversions, & more.
With complete automation the cost of making an action is virtually 0, allowing very frequent micro-optimizations whenever small issues occur, or are about to occur. The additional precision and reactivity provided by full automation makes it possible to safely run links at higher utilization and rapidly move traffic around as necessary.
Figure: Egress interface traffic demand over capacity. Multiple interfaces had a demand that exceeded three times the physical capacity available during the Super Bowl, triggering automated traffic engineering overrides, which enabled continued efficient delivery without negative consequences to the network.
The graph above shows an example where Autopilot detected traffic demand exceeding physical link capacity. During the Super Bowl this demand exceeded 3 times the available capacity in some cases. Without Autopilot the peaks in traffic demand would have overwhelmed those links, requiring a lot of human intervention to prevent failure, but then to manage all of the downstream impacts of those interventions in order to get the network operating at top efficiency again. With Autopilot the network deflected traffic onto secondary paths automatically and we were able to deliver the excess demand without any performance degradation.
This post sheds light on the systems we built to scale handling large traffic events without any operator intervention.
Technical problem
Figure – Fastly POP is interconnected to the Internet via multiple peers and transit providers
The Fastly network of Points of Presence (POPs) is distributed across the world. Each POP is “multihomed”, i.e., it is interconnected to the Internet via a number of different networks, which are either peers or transit providers, for capacity and reliability purposes. With multiple routing options available, the challenge is how to select the best available path. We need to ensure that we pick the best performing route (in any given moment), and quickly move traffic away from paths experiencing failures or congestion.
Network providers use a protocol called Border Gateway Protocol (BGP) to exchange information about the reachability of Internet destinations. Fastly consumes BGP updates from its neighbors, and learns which neighbor can be used to deliver traffic to a given destination. However, BGP has several limitations. First, it is not capacity or performance aware: it can only be used to communicate whether an Internet destination can be reached or not, but not whether there is enough capacity to deliver the desired amount of traffic or what the throughput or latency would be for that delivery. Second, BGP is slow at reacting to remote failures: if a failure on a remote path occurs, it typically takes minutes for updates to be propagated, during which time blackholes and loops may occur.
Solving these problems without creating new ones is challenging, especially when operating at the scale of tens of Terabits per second (Tbps) of traffic. In fact, while it is desirable to rapidly route around failures, we need to be careful in those processes as well because rerouting large amounts of traffic erroneously can move traffic away from a well performing path onto a worse performing one and create congestion downstream as a result of our action, resulting in poor user experience. In other words, if decisions are not made carefully, some actions that are taken to reduce congestion will actually increase it instead – sometimes significantly.
Fastly’s solution to the problem is to use two different control systems that operate at different timescales to ensure we rapidly route around failures while keeping traffic on most performing paths.
The first system, which operates at a timescale of tens of milliseconds (to make a few round trips), monitors the performance of each TCP connection between Fastly and end users. If the connection fails to make forward progress for a few round trip times it reroutes that individual connection onto alternate paths until it resumes progress. This is the system underlying our Precision Path product for protecting connections between Fastly and end users, and it makes sure we rapidly react to network failures by surgically rerouting individual flows that are experiencing issues on these smaller timescales.
The second system, internally named Autopilot, operates over a longer timescale. Every minute it estimates the residual capacity of our links and the performance of network paths collected via network measurements. It uses that information to ensure traffic is allocated to links in order to optimize performance and prevent links from becoming congested. This system has a slower reaction time, but makes a more informed decision based on several minutes of high resolution network telemetry data. Autopilot ensures that large amounts of traffic can be moved confidently without downstream negative effects.
These two systems working together, make it possible to rapidly reroute struggling flows onto working paths and periodically adjust our overall routing configuration with enough data to make safe decisions. These systems operate 24/7 but had a particularly prominent role during the Super Bowl where they rerouted respectively 300 Gbps and 9 Tbps of traffic which would have otherwise been delivered over faulty, congested or underperforming paths.
This approach to egress traffic engineering using systems operating at different timescales to balance reactivity, accuracy, and safety of routing decisions is the first of its type in the industry to the best of our knowledge. In the remainder of this blog post, we are going to cover how both systems work but we’ll need to first make a small digression to explain how we route traffic out of our POPs, which is unusual and another approach where we’re also industry leaders.
Figure – Amount of traffic (absolute and percentage of total traffic) delivered by Precision Path and Autopilot respectively during the Super Bowl
Fastly network architecture
Figure – Fastly POP architecture
A typical Fastly POP comprises a layer of servers that are interconnected with all peers and transit providers via a tier of network switches. The typical approach to build an edge cloud POP consists in using network routers, which have a large enough memory to store the entire Internet routing table. In contrast, Fastly started designing a routing architecture that pushed all routes to end hosts in order to build a more cost-effective network, but we quickly realized and embraced the powerful capabilities that this architecture made possible. Endpoints that have visibility into the performance of flows now also have the means to influence their routing. This is one of the key reasons Fastly’s networking capabilities, programmability, flexibility, and ease of use continue to exceed the competition.
Here’s how our routing architecture works: Both switches and servers run routing daemons, which are instances of the BIRD Internet Routing Daemon with some proprietary patches applied to it. The daemons running on switches learn all routes advertised by our transits and peers. However, instead of injecting those routes in the routing table of the switches, they propagate them down to the servers which will then inject them into their routing tables. To make it possible for servers to then route traffic to the desired transit or peer, we use the Multiprotocol Label Switching (MPLS) protocol. We populate each switch with an entry in their MPLS lookup table (Label Forwarding Information Base [LFIB]) per each egress port and we tag all BGP route announcements propagated down to the servers with a community encoding the MPLS label that is used to route that traffic. The servers use this information to populate their routing table and use the appropriate label to route traffic out of the POP. We discuss this more at length in a scientific paper we published at USENIX NSDI ‘21.
Quickly routing around failures with Precision Path
Our approach of pushing all routes to the servers, giving endpoints the ability to reroute based on transport and application-layer metrics, made it possible to build Precision Path. Precision Path works on a timeframe of tens of milliseconds to reroute individual flows in cases of path failures and severe congestion. It’s great at quickly routing away from failures happening right in the moment, but it’s not aware or able to make decisions about proactively selecting the best path. Precision Path is good at steering away from trouble, but not zooming out and getting a better overall picture to select an optimized new route. The technology behind our precision path product is discussed in this blog post and, more extensively in this peer-reviewed scientific paper, but here’s a brief explanation.
Figure – Precision path rerouting decision logic for connections being established (left) and connections already established (right).
This system is a Linux kernel patch that monitors the health status of individual TCP connections. When a connection fails to make forward progress for some Round Trip Time (RTT), indicating a potential path failure, it is rerouted onto a randomly chosen alternate path until it resumes forward progress. Being able to make per-flow rerouting decisions is made possible by our host-based routing architecture where servers select routes of outgoing traffic by applying MPLS labels. End hosts can move traffic rapidly on a per-flow granularity because they have both visibility into the progress of connections, and the means to change network route selection. This system is remarkably effective at rapidly addressing short-lived failures and performance degradation that operators or any other telemetry-driven traffic engineering would be too slow to address. The downside is that this system only reacts to severe performance degradations that are already visible in the data plane and moves traffic onto randomly selected alternate paths, just to select non-failing paths, but they might not be the best and most optimal paths.
Making more informed long-term routing decision with Autopilot
Autopilot complements the limitations of Precision Path because it’s not great at responding as quickly, but it makes more informed decisions based on knowledge of which paths are able to perform better, or are currently less congested. Rather than just moving traffic away from a failed path (like Precision Path), it moves larger amounts of traffic *toward* better parts of a network. Autopilot has not been presented before today, and we are excited to detail it extensively in this post.
Autopilot is a controller that receives network telemetry signals from our network such as packet samples, link capacity, RTT, packet loss measurements, and availability of routes for each given destination. Every minute, the Autopilot controller collects network telemetry, uses it to project per-egress interface traffic demand without override paths, and makes decisions to reroute traffic onto alternate paths if one or more links are about to reach full capacity or if the currently used path for a given destination is underperforming its alternatives.
Figure – Autopilot architecture diagram
Autopilot’s architecture is comprised of three components (shown above):
A route manager, which peers with each switch within a POP and receives all route updates the switch received from its neighbors over a BGP peering session. The route manager provides an API that allows consumers to know what routes are available for a given destination prefix. The route manager also offers the ability to inject route overrides via its API. This is executed by announcing a BGP route update to the switch with a higher local preference value than routes learned from other peers and transit providers. This new route announcement will win the BGP tie-breaking mechanism and be inserted into servers’ routing tables and used to route traffic.
A telemetry collector, which receives sFlow packet samples from all the switches of a POP which allow an estimation of the volume of traffic broken down by destination interface and destination prefix as well as latency and packet loss measurements for all the traffic between Fastly POPs over all available providers from servers.
A controller, which consumes (every minute) the latest telemetry data (traffic volumes and performance) as well as all routes available for the prefixes currently served by the POP, and then computes whether to inject a BGP route override to steer traffic over alternate paths.
Making Precision Path and Autopilot work together
One challenge of having multiple control systems operating on the same inputs and outputs is having them work collaboratively to select the overall best options rather than compete with each other. Trying to select the best option from the limited vantage point of each separate optimization process could actually lead to additional disruption and do more harm than good. To the best of our knowledge, we are the first in the industry using this multi-timescale approach to traffic engineering.
The key challenge here is that once a flow is being rerouted by Precision Path, it no longer responds to BGP routing changes, including those triggered by Autopilot. As a result, Autopilot needs to account for the amount of traffic currently controlled by Precision Path in its decisions. We addressed this problem in two ways: first we tuned Precision Path to minimize the amount of traffic it reroutes, and by making that traffic observable by Autopilot so that it can be factored into Autopilot decisions.
When we first deployed Precision Path, we fine-tuned its configuration to minimize false positives. False positives would result in traffic being rerouted away from an optimal path that is temporarily experiencing a small hiccup, and onto longer paths with worse performance, which could in turn lead to a worse degradation by impacting the performance of affected TCP connections. We reported extensively on our tuning experiments in this paper. However, this is not enough, because even if we make the right decision at the time of rerouting a connection, the originally preferred path may recover a few minutes after the reroute, and this is typically what happens when BGP eventually catches up with the failure and withdraws routes through the failed path. To make sure we reroute connections back onto the preferred path when recovered, Precision Path probes the original path every five minutes after the first reroute, and if the preferred path is functional, it moves the connection back onto it. This mechanism is particularly helpful for long-lived connections, such as video streaming, which would otherwise be stuck on a backup path for their entire lifetime. This also minimizes the amount of traffic that Autopilot cannot control, giving it more room to maneuver.
The problem of making the amount of traffic routed by Precision Path visible to Autopilot is trickier. As we discuss earlier in this post, Autopilot learns the volume of traffic sent over each interface from sFlow packet samples emitted by switches. These samples report, among other things, over what interface the packets were sent to and which MPLS label it carried but do not report any information about how that MPLS label was applied. Our solution was to create a new set of alternate MPLS labels for our egress ports and allocate them for exclusive usage by Precision Path. This way, by looking up an MPLS label in our IP address management database, we can quickly find out if that packet was routed according to BGP path selection or according to Precision Path rerouting. We expose this information to the Autopilot controller which treats Precision Path as “uncontrollable”, i.e., traffic that will not move away from its current path even if the preferred route for its destination prefix is updated.
Making automation safe
Customers trust us with their business to occupy a position as a middleman between their services and their users, and we take that responsibility very seriously. While automating network operations allows for a more seamless experience for our customers, we also want to provide assurances to its reliability. We design all our automation with safety and operability at its core. Our systems fail gracefully when issues occur and are built so that network operators can always step in and override their behaviors using routing policy adjustments. The last aspect is particularly important because it allows operators to use tools and techniques learned in environments without automation and apply them here. Minimizing cognitive overhead by successfully automating more and more of the problem is particularly important to reduce the amount of time needed to solve problems when operating under duress. These are some of the approaches we used to make our automation safe and operable:
Standard operator tooling: both Precision Path and Autopilot can be controlled using standard network operator tools and techniques.
Precision Path can be disabled on individual routes by injecting a specific BGP community on an individual route announcement, which is a very common task that network engineers typically perform for a variety of reasons. Precision Path can also be disabled on an individual TCP session by setting a specific forwarding mark on the socket, which makes it possible to run active measurements without Precision Path kicking in and polluting results.
Autopilot route reselection is based on BGP best path selection, i.e., it will try to reroute traffic onto the second best path according to BGP best path selection. As a result, operators can influence which path Autopilot will fail over to by applying BGP policy changes such as altering MED or local pref values, and this is also a very common technique.
Finally, data about whether connections were routed on paths selected by precision path or autopilot is collected by our network telemetry systems, which allows us to reconstruct what happens
Data quality auditing: We audit the quality of data fed into our automation and have configured our systems to avoid executing any change if input data is inconsistent. In the case of Autopilot, for example, we compare egress flow estimation collected via packet samples against an estimation collected via interface counters, and if they diverge beyond a given threshold it means at least one of the estimations must be wrong, and we do not apply any change. The graph below shows the difference between those two estimations during the Super Bowl on one North American POP.
Figure – Difference between link utilization estimates obtained via interface counters and packet samples. The +/- 5% thresholds represent the acceptable margins of error
What-if analysis and control groups: in addition to monitoring input data we also audit the decisions made by systems and step in to correct them if they misbehave. Precision Path uses treatment and control groups. We randomly select a small percentage of connections to be part of a control group for which Precision Path is disabled and then monitor their performance compared to the others where precision path is enabled. If control connections perform better than treatment connections our engineering team is alerted, and steps in to investigate and remediate. Similarly, in Autopilot, before deploying a configuration change to our algorithm, we run it in “shadow” mode where the new algorithm makes decisions, but they are not applied to the network. The new algorithm will only be deployed if it performs at least as well as the one that is currently running.
Fail-static: when a failure occurs at any component of our systems, rather than failing close or open, they fail static, i.e., leave the network in the last known working configuration and alert our engineering team to investigate the problem.
Conclusions
This blog post is a view into how Fastly automates egress traffic engineering to make sure our customers’ traffic reaches their end users reliably. We continue to innovate and push the boundaries of what is possible while maintaining a focus on performance that is unrivaled. If you are thinking that you want your traffic to be handled by people who are not only experts, but also care this much, now is a great time to get in touch. Or if you’re thinking you want to be a part of innovation like this, check out our open listings here: https://www.fastly.com/about/careers/current-openings.
Open Source Software
The automation built into our network was made possible by open source technology. Open source is a part of Fastly’s heritage — we’re built on it, contribute to it, and open source our own projects whenever we can. What’s more, we’ve committed $50 million in free services to Fast Forward, to give back to the projects that make the internet, and our products, work. To make our large network automation possible, we used:
goBGP – BGP routing daemon library, used to build the Autopilot route collector/injector
BIRD – BGP routing daemon running on our switches and servers.
We did our best to contribute back to the community by submitting to their maintainers improvements and bug fixes that we implemented as part of our work. We are sending our deepest gratitude to the people that created these projects. If you’re an open source maintainer or contributor and would like to explore joining Fast Forward, reach out here.
Lorenzo Saino is a director of engineering at Fastly, where he leads the teams responsible for building the systems that control and optimize Fastly’s network infrastructure. During his tenure at Fastly, he built systems solving problems related to load balancing, distributed health checking, routing resilience, traffic engineering and network telemetry. Before joining Fastly he received a PhD from University College London. His thesis investigated design issues in networked caching systems.
Jeremiah Millay is a Principal Engineer on the Network Systems team at Fastly where he spends most of his time focused on network automation and writing software with the goal of improving network operations at Fastly. Prior to Fastly he spent a number of years as a Network Engineer for various regional internet service providers.
Paolo Alvarado is a Senior Manager of Technical Operations at Fastly. Paolo has over 10 years of experience working with content delivery networks in customer-facing and behind-the-scenes roles. Paolo joined Fastly to help build out the Fastly Tokyo office before moving into network operations. Currently, he manages a team of Network and System Operation engineers to meet the challenges of building and running a large scale network.
VP of Engineering leading Network Systems Organization
Hossein Lotfi is VP of Engineering leading Network Systems Organization at Fastly. Hossein has over 20 years of experience building networks and large-scale systems ranging from startups to hyper-scale cloud infrastructure. He has scaled multiple engineering organizations geared towards rapid, novel innovation development and innovations that are informed and inspired by deep involvement with the operational challenges of global scale systems. At Fastly, Hossein is responsible for building reliable, cost-effective, and low-latency systems to connect Fastly with end-users and customer infrastructures. The Network Systems Organization teams include Kernel, DataPath (XDP), L7 Load Balancing, TLS Termination, DDoS Defence, Network Architecture, Network Modeling and Provisioning Systems, Traffic Engineering, Network Telemetry, DNS, Hardware Engineering, Pre-Production Testing and Fastly’s Edge Delivery platform.
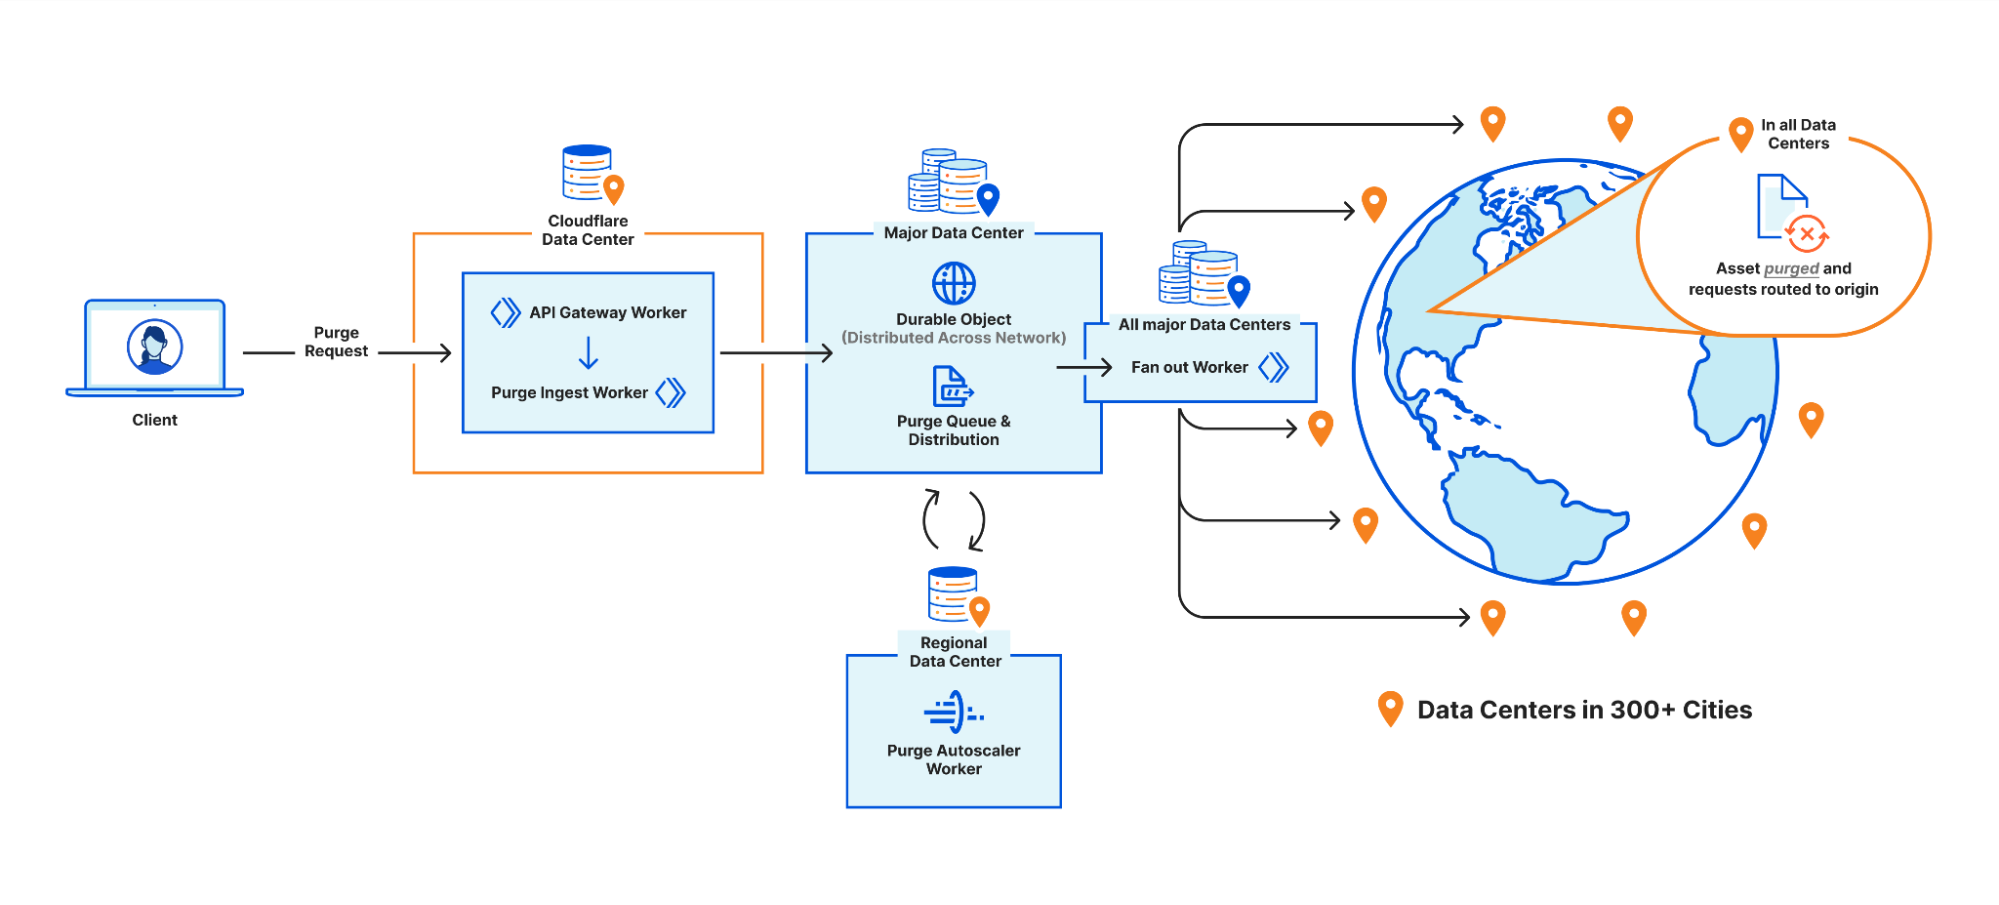
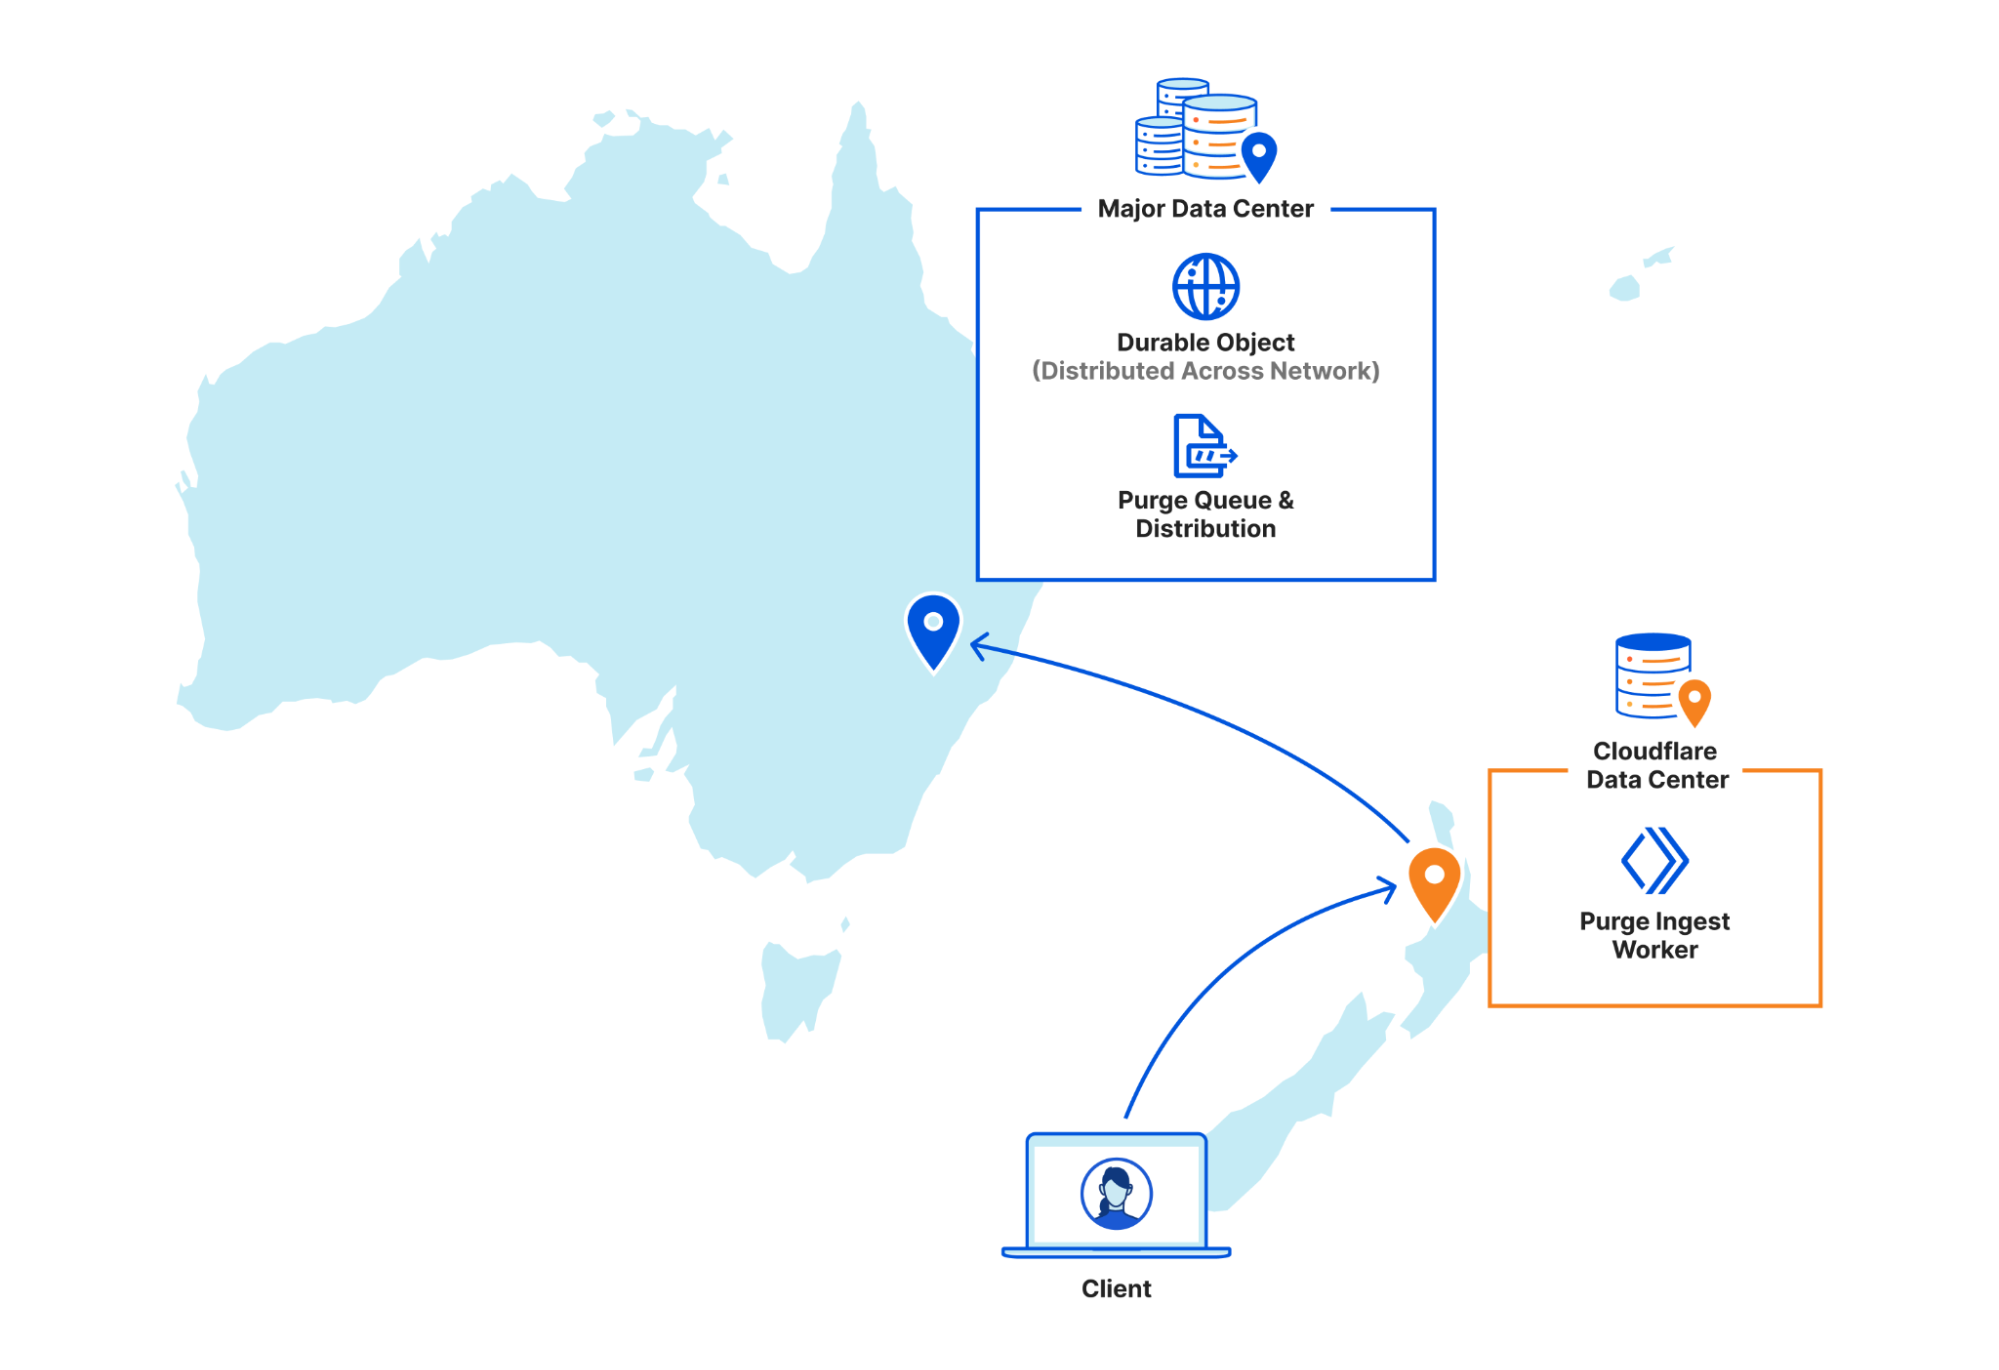
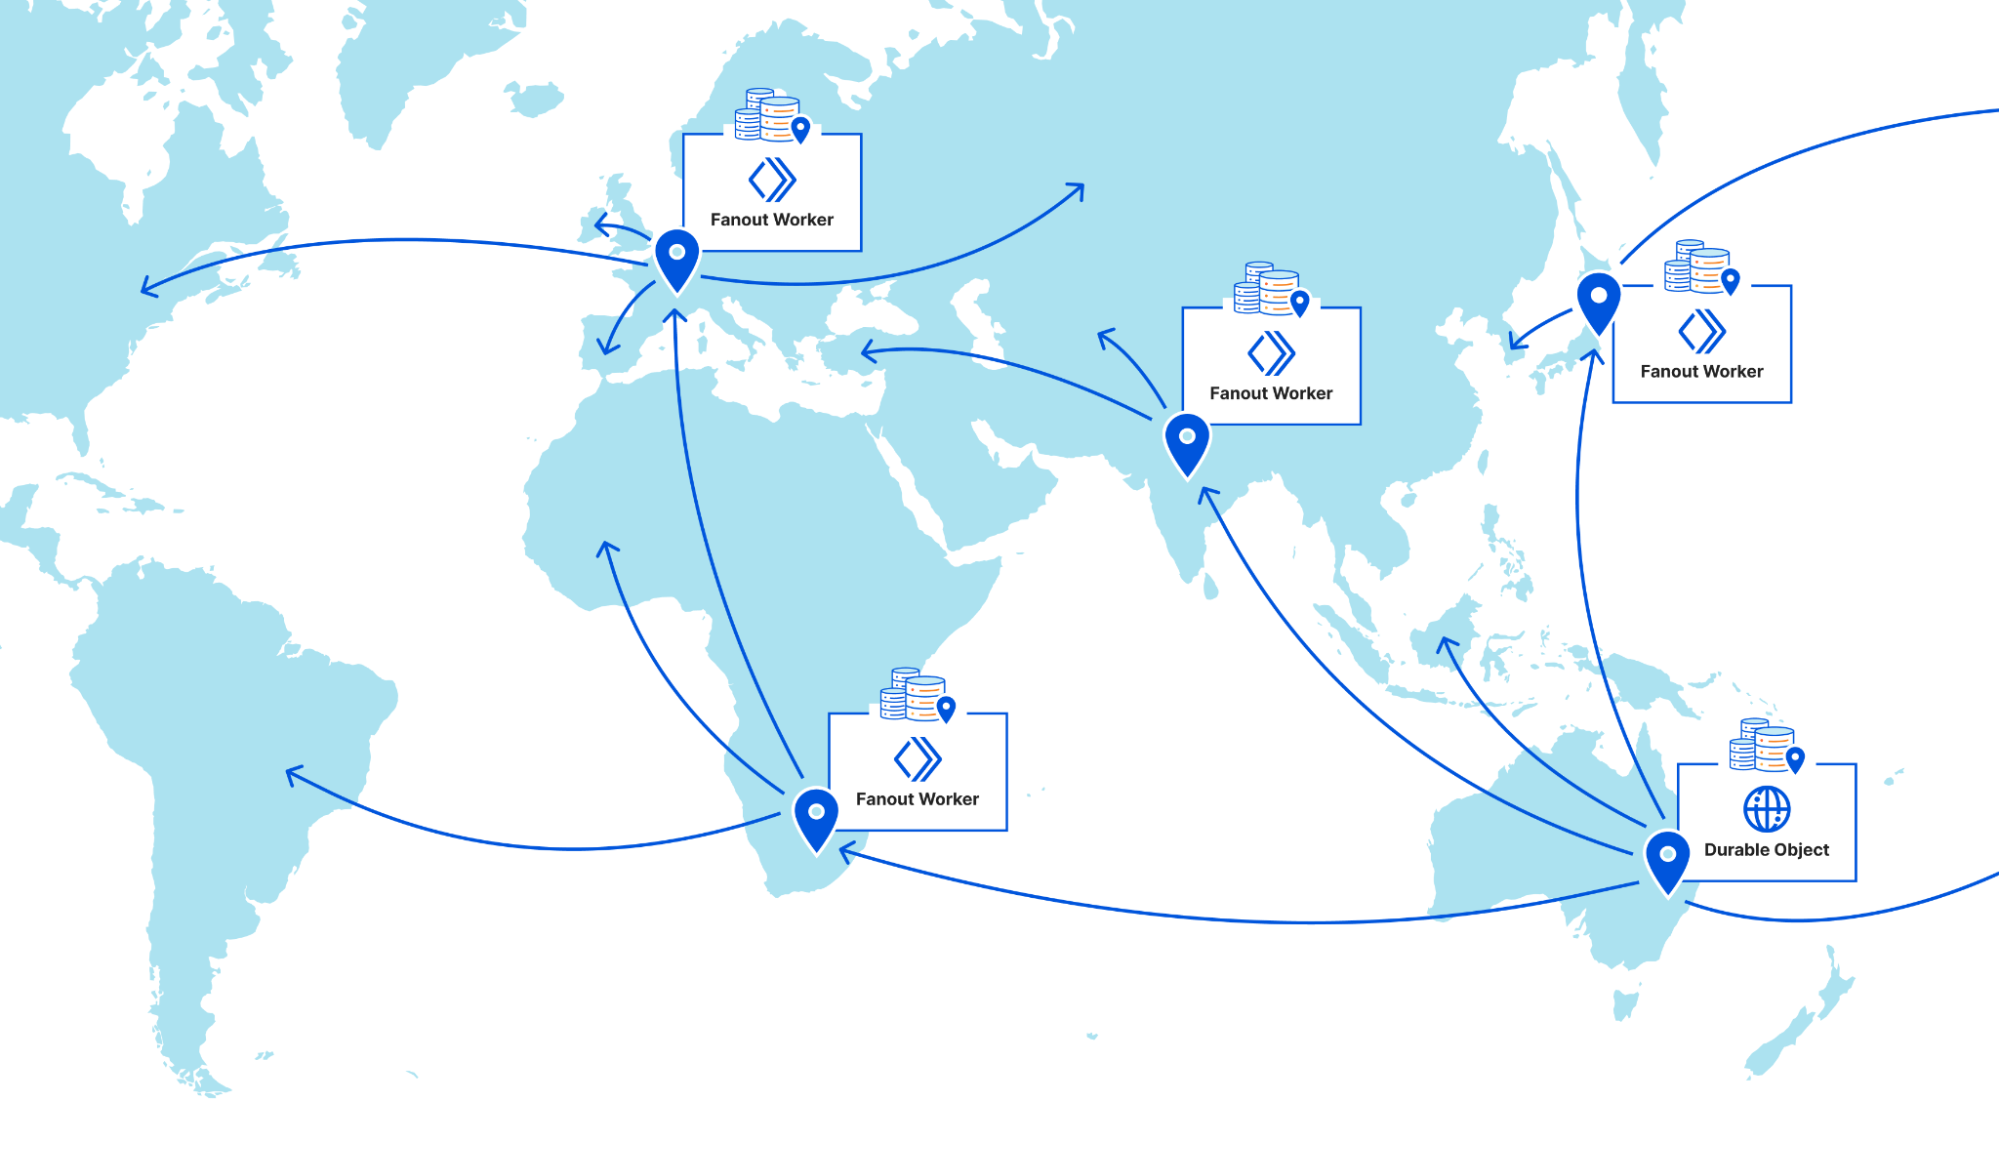
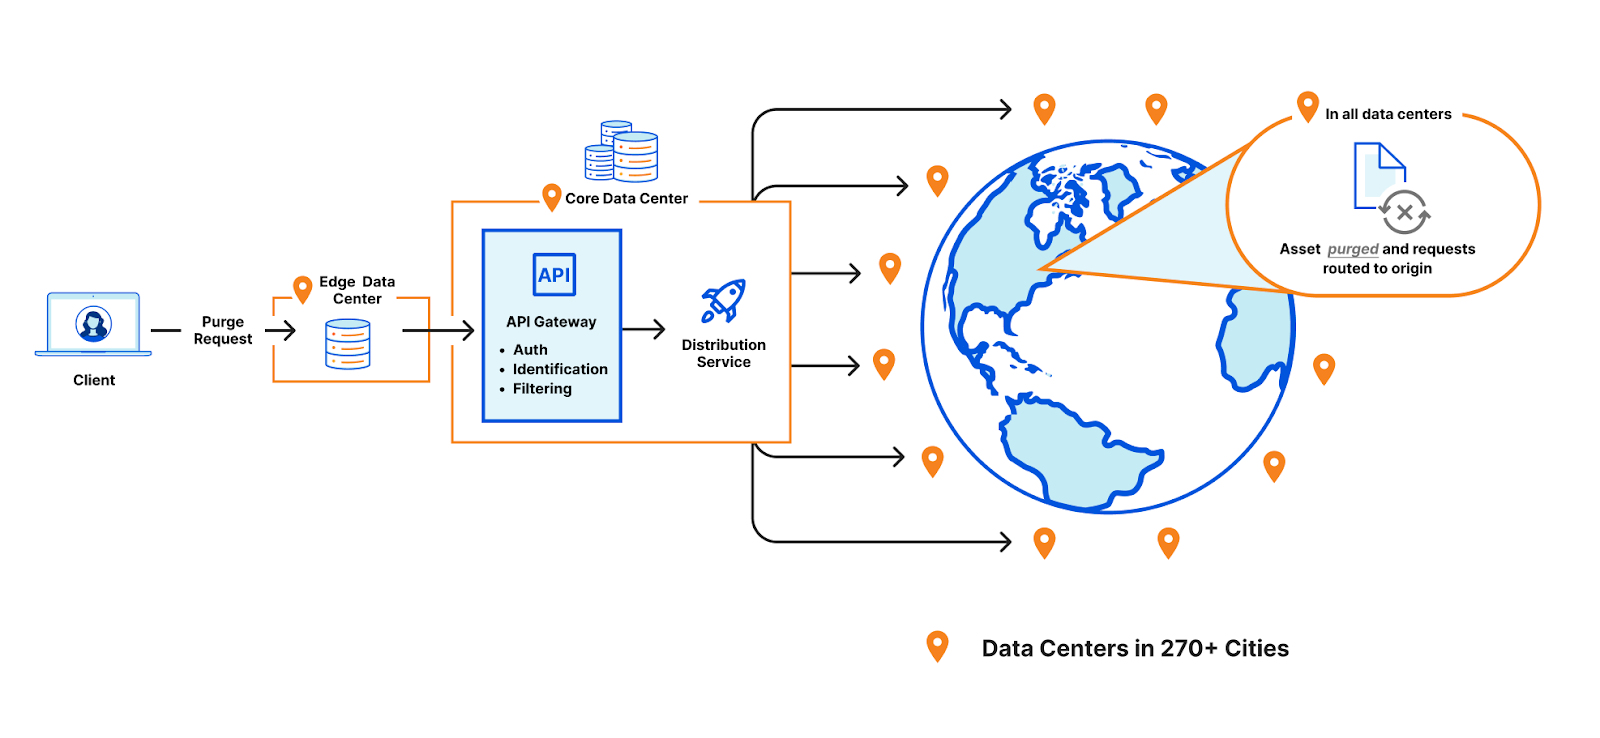
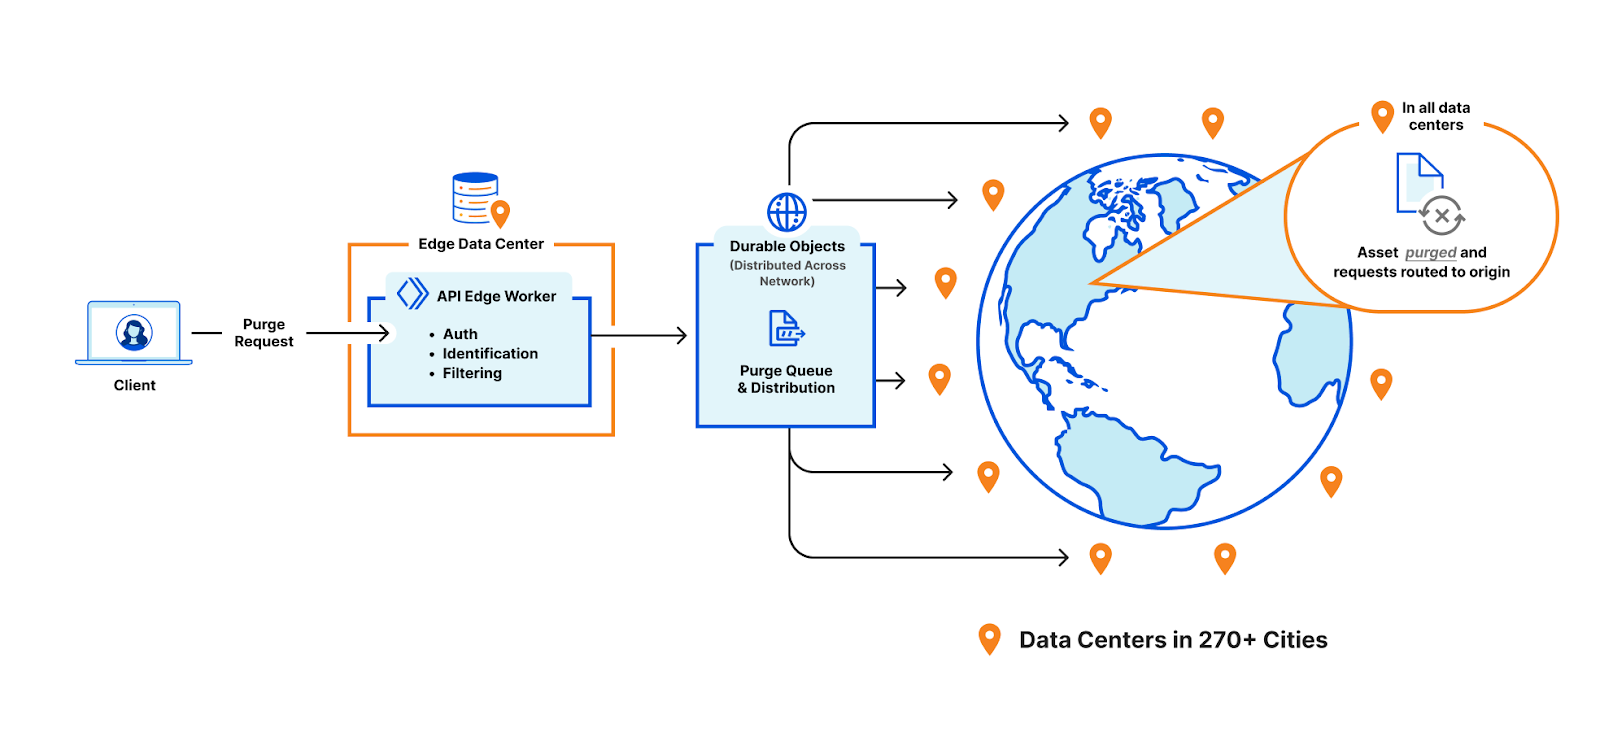
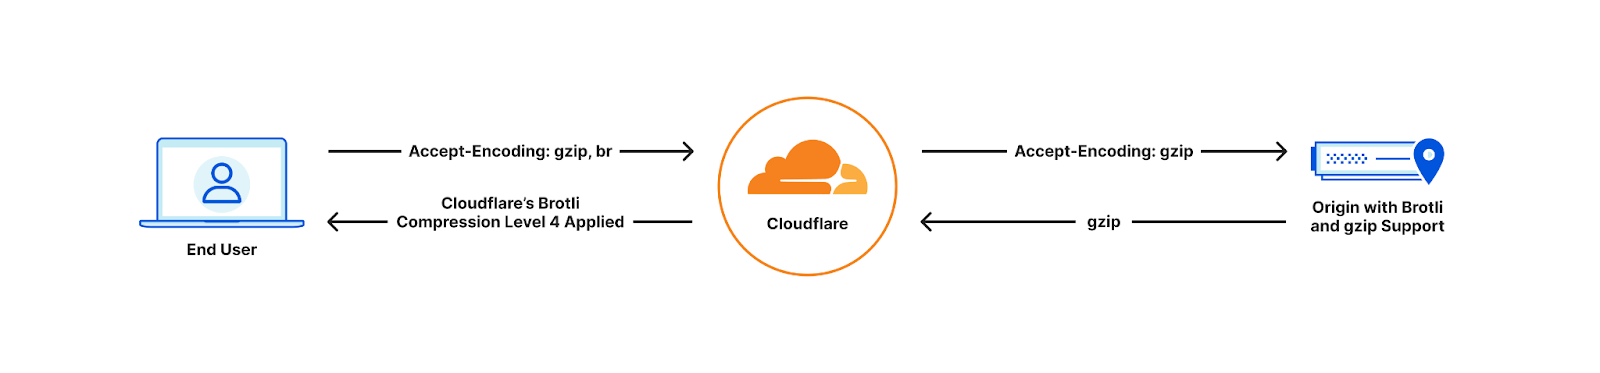
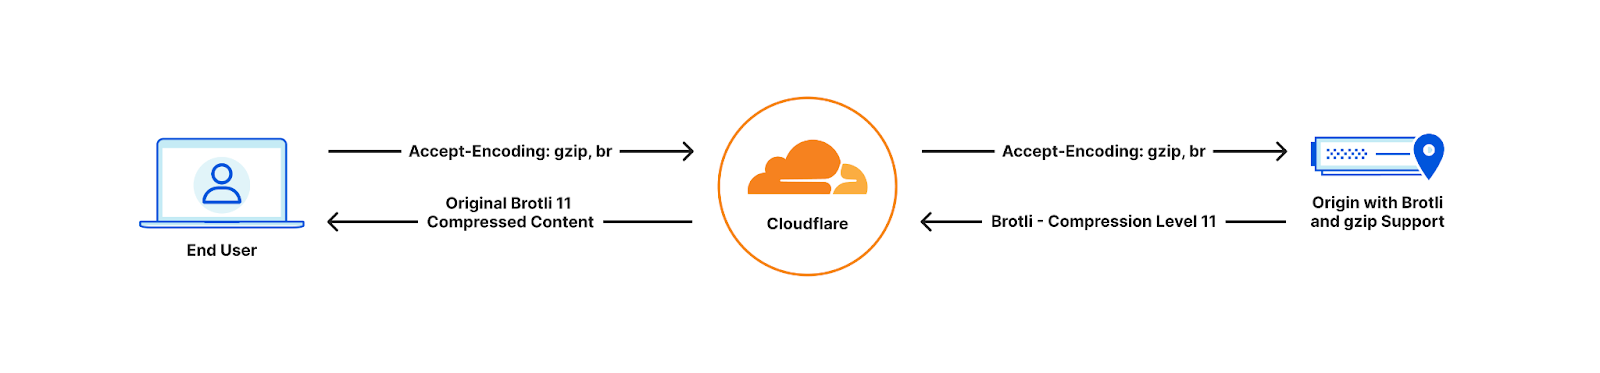
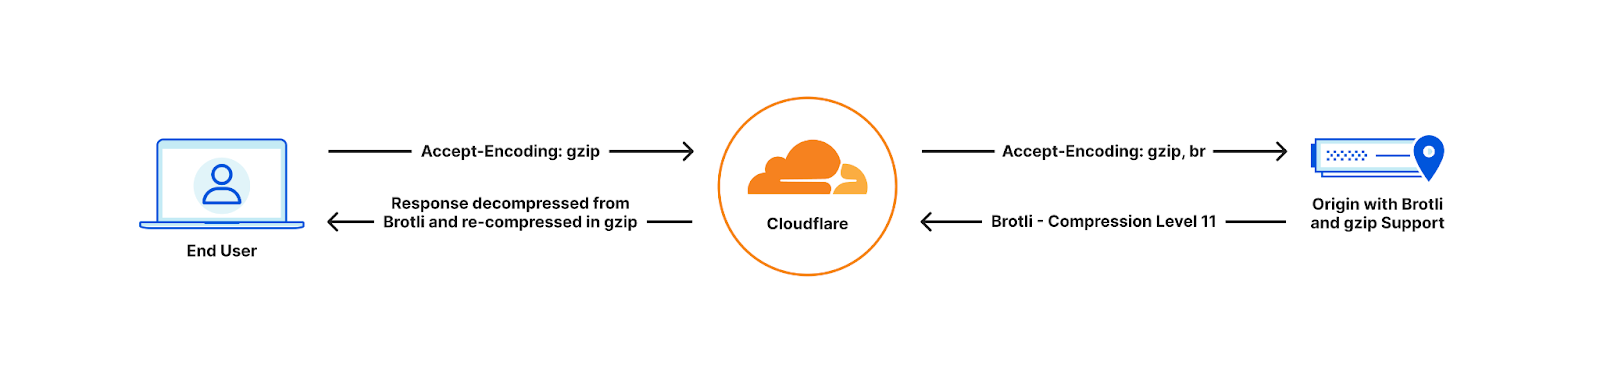
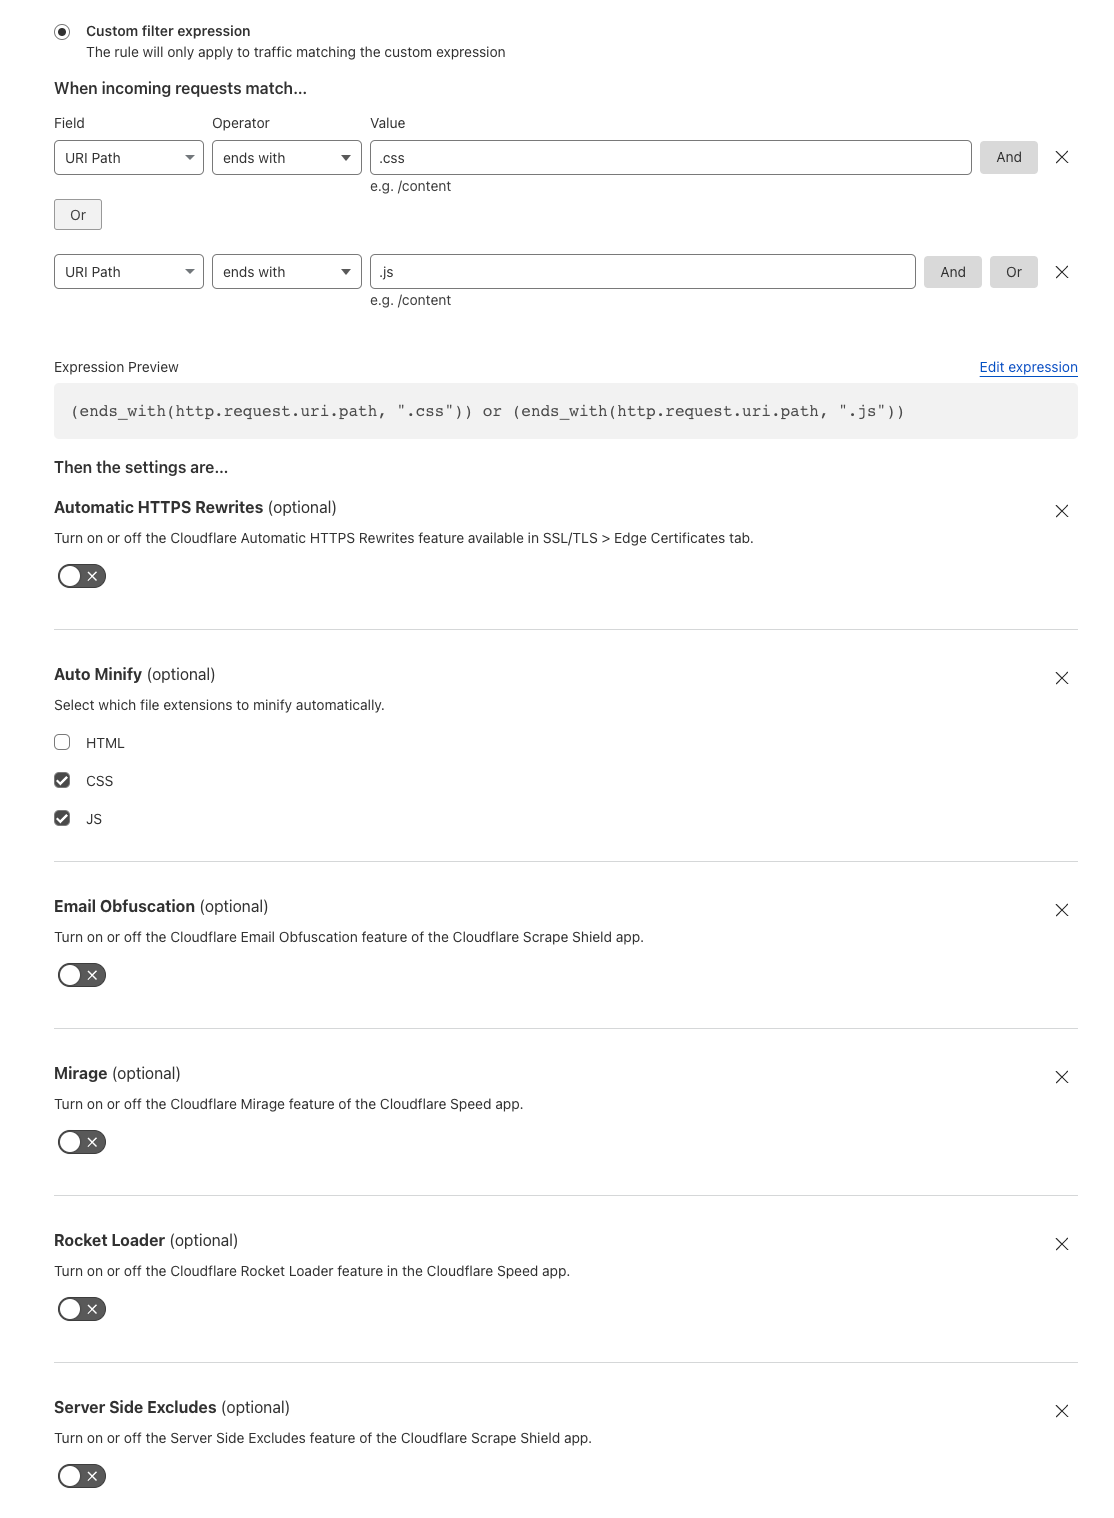
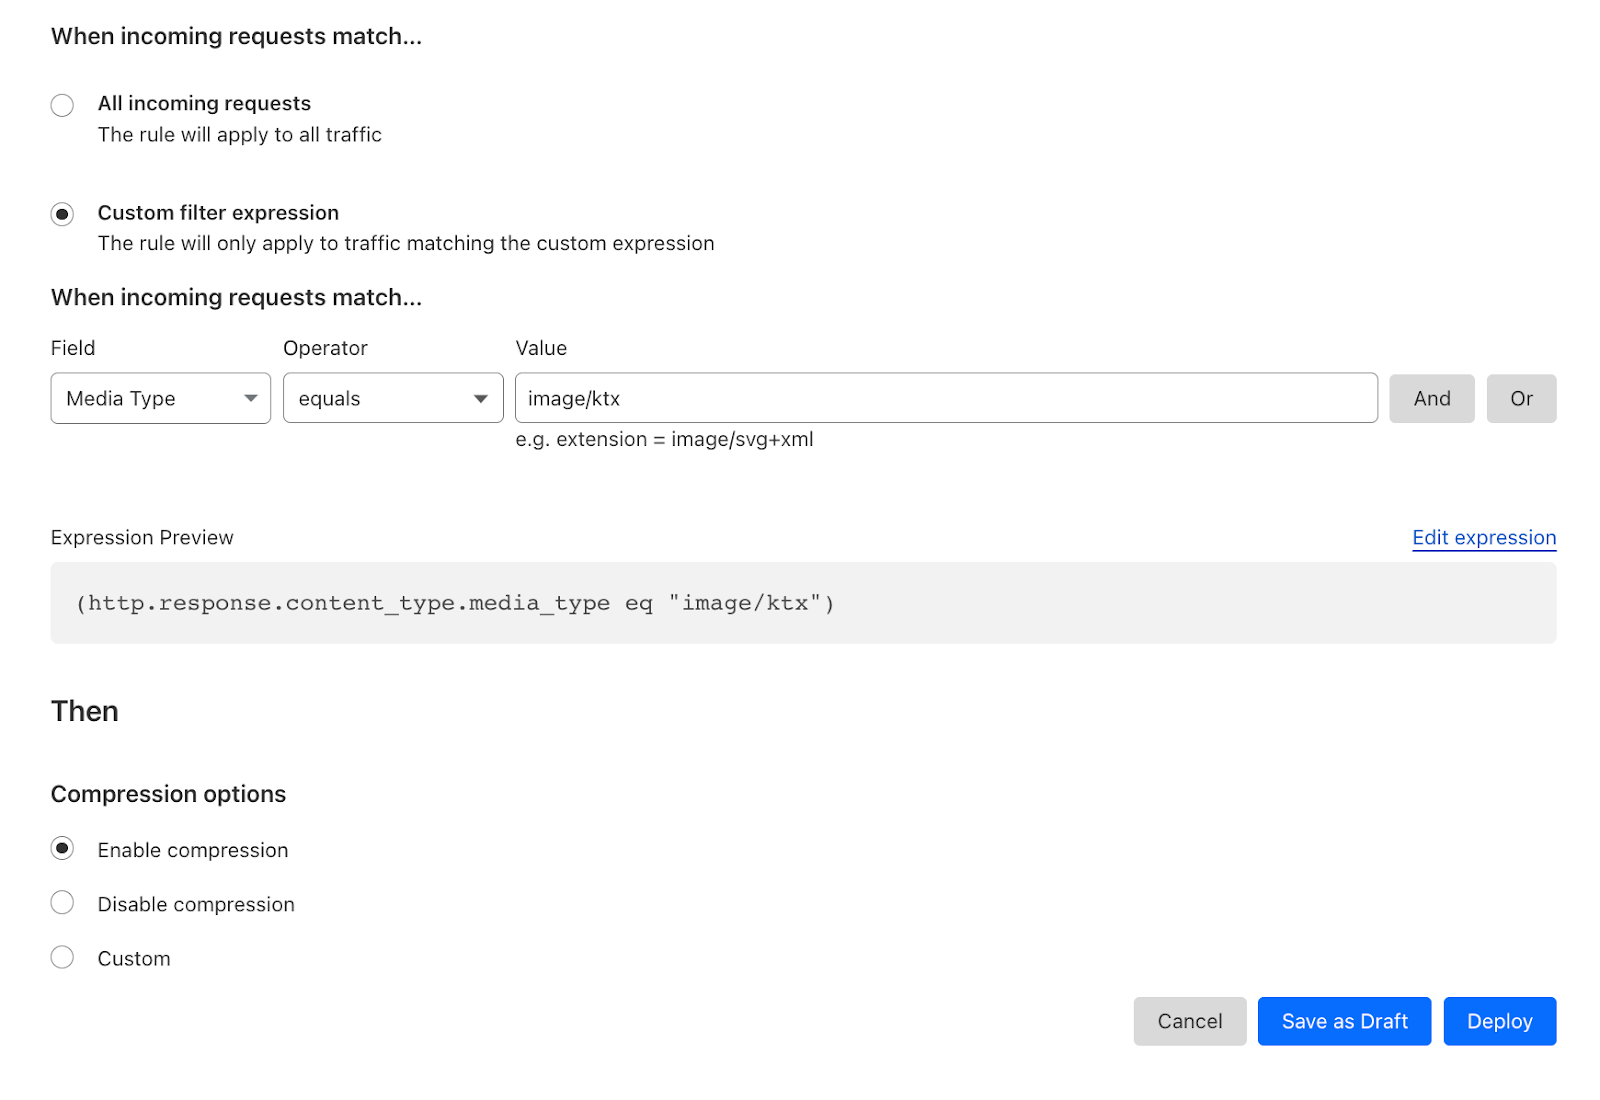
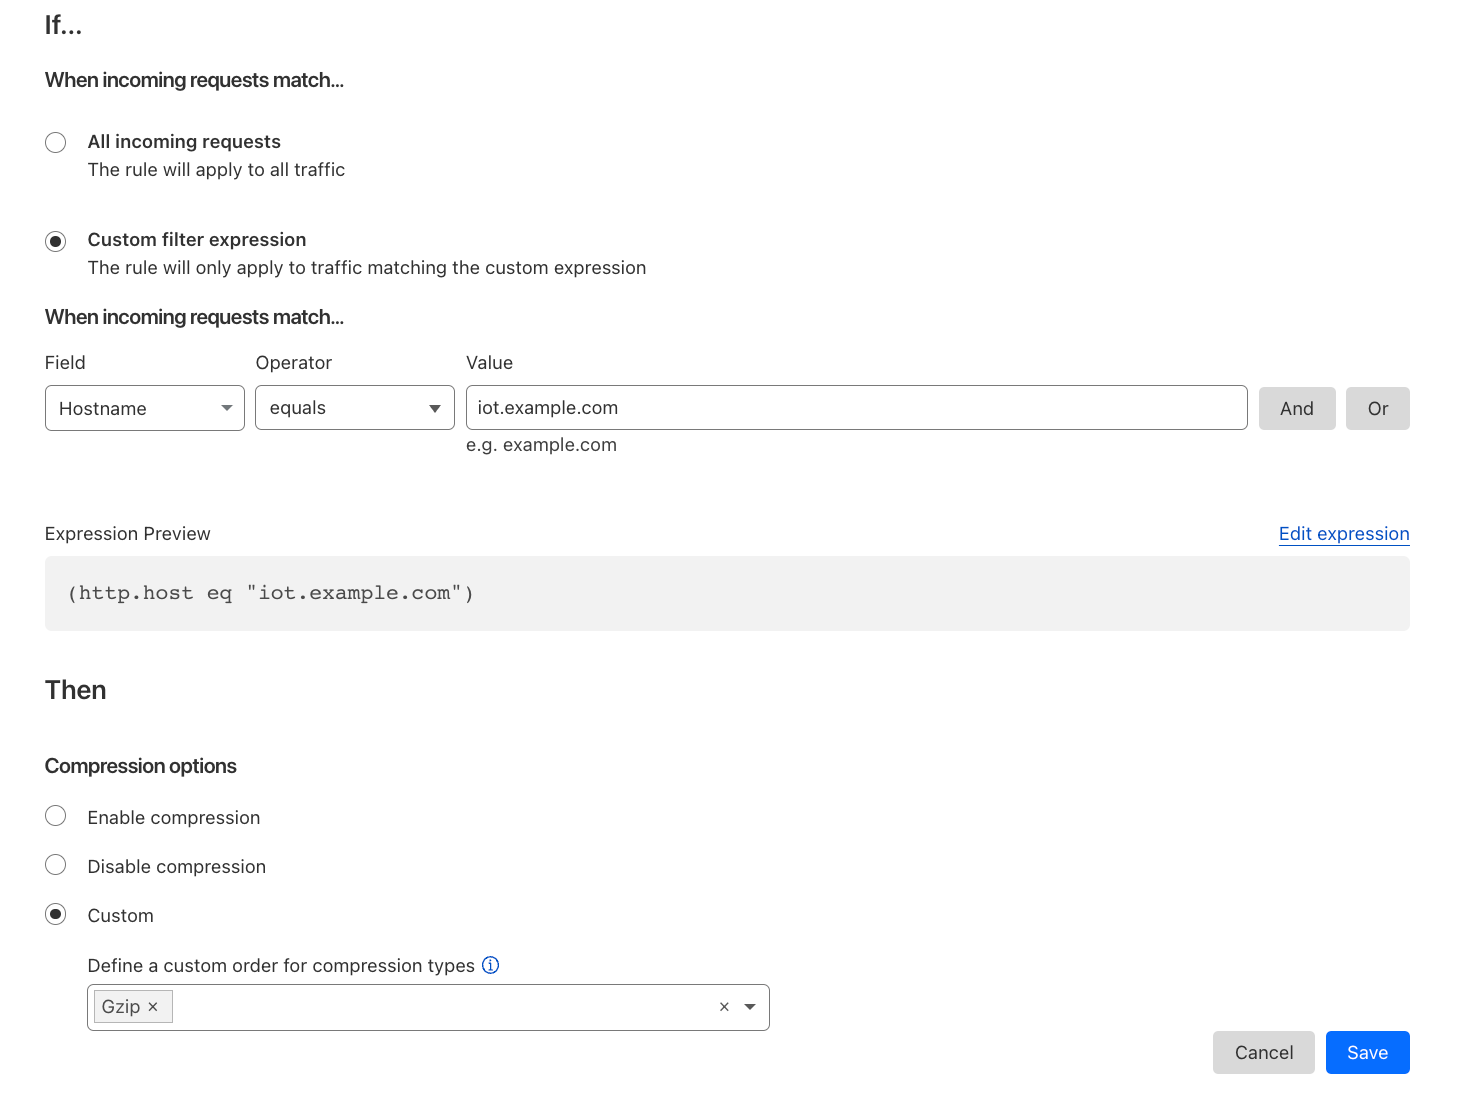
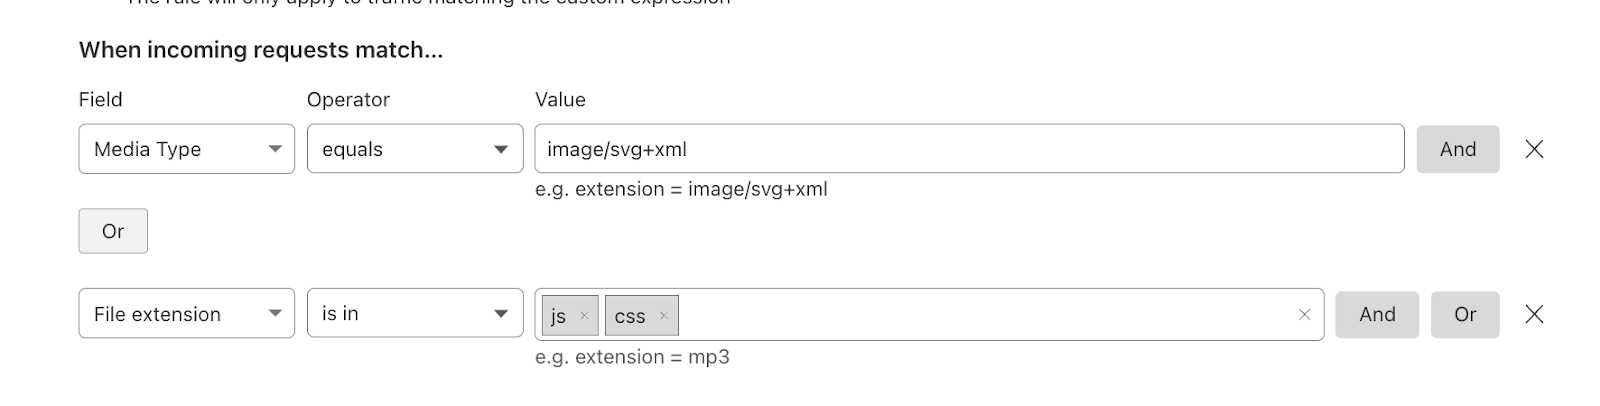
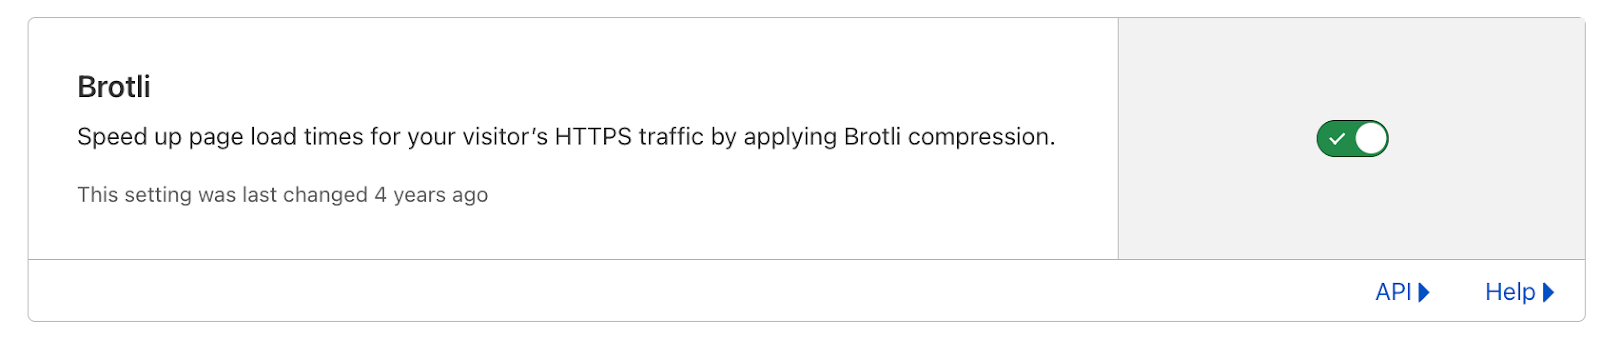
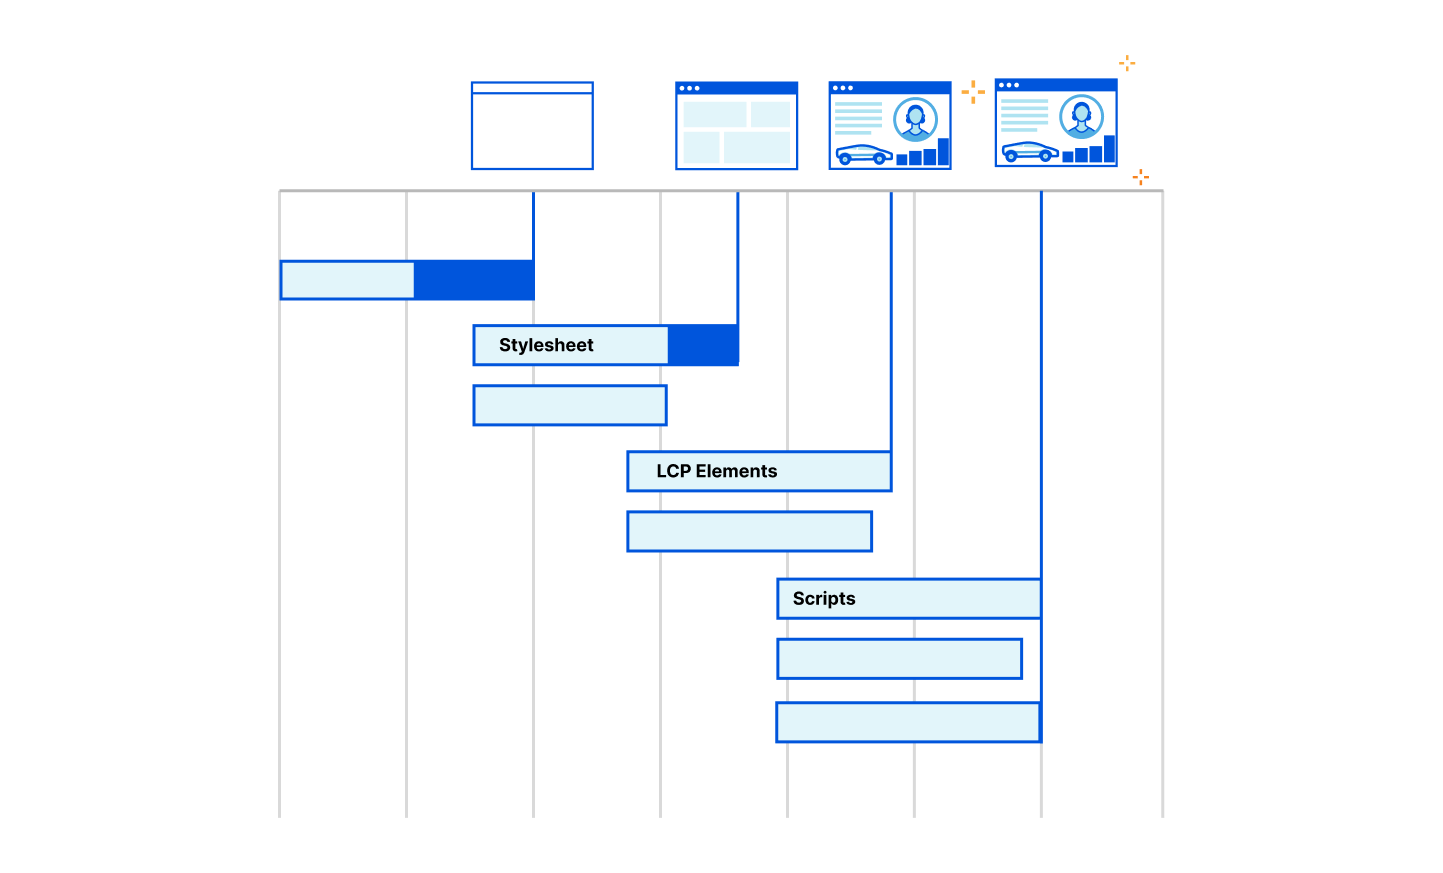
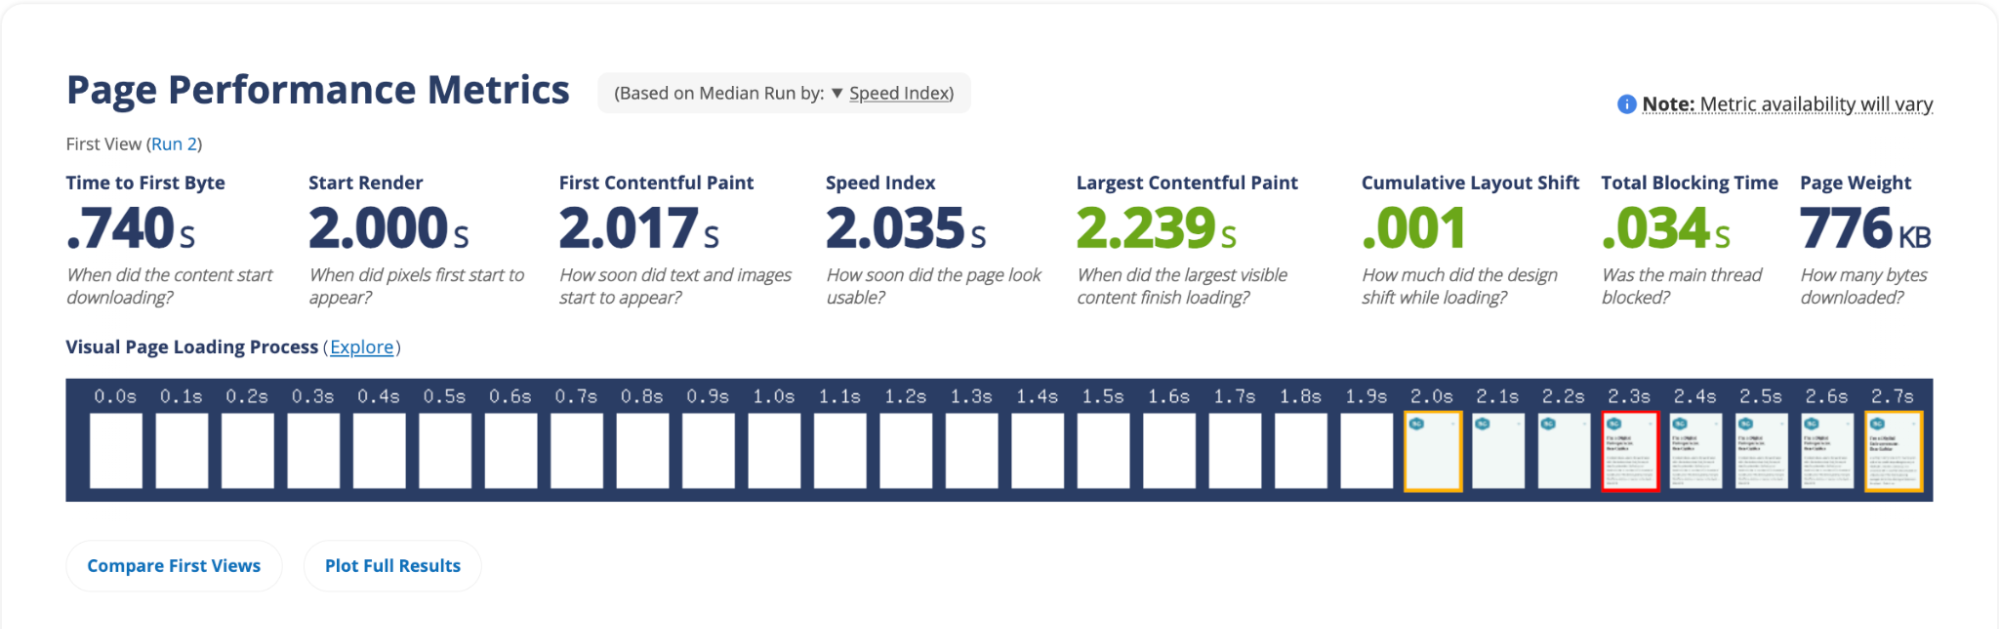

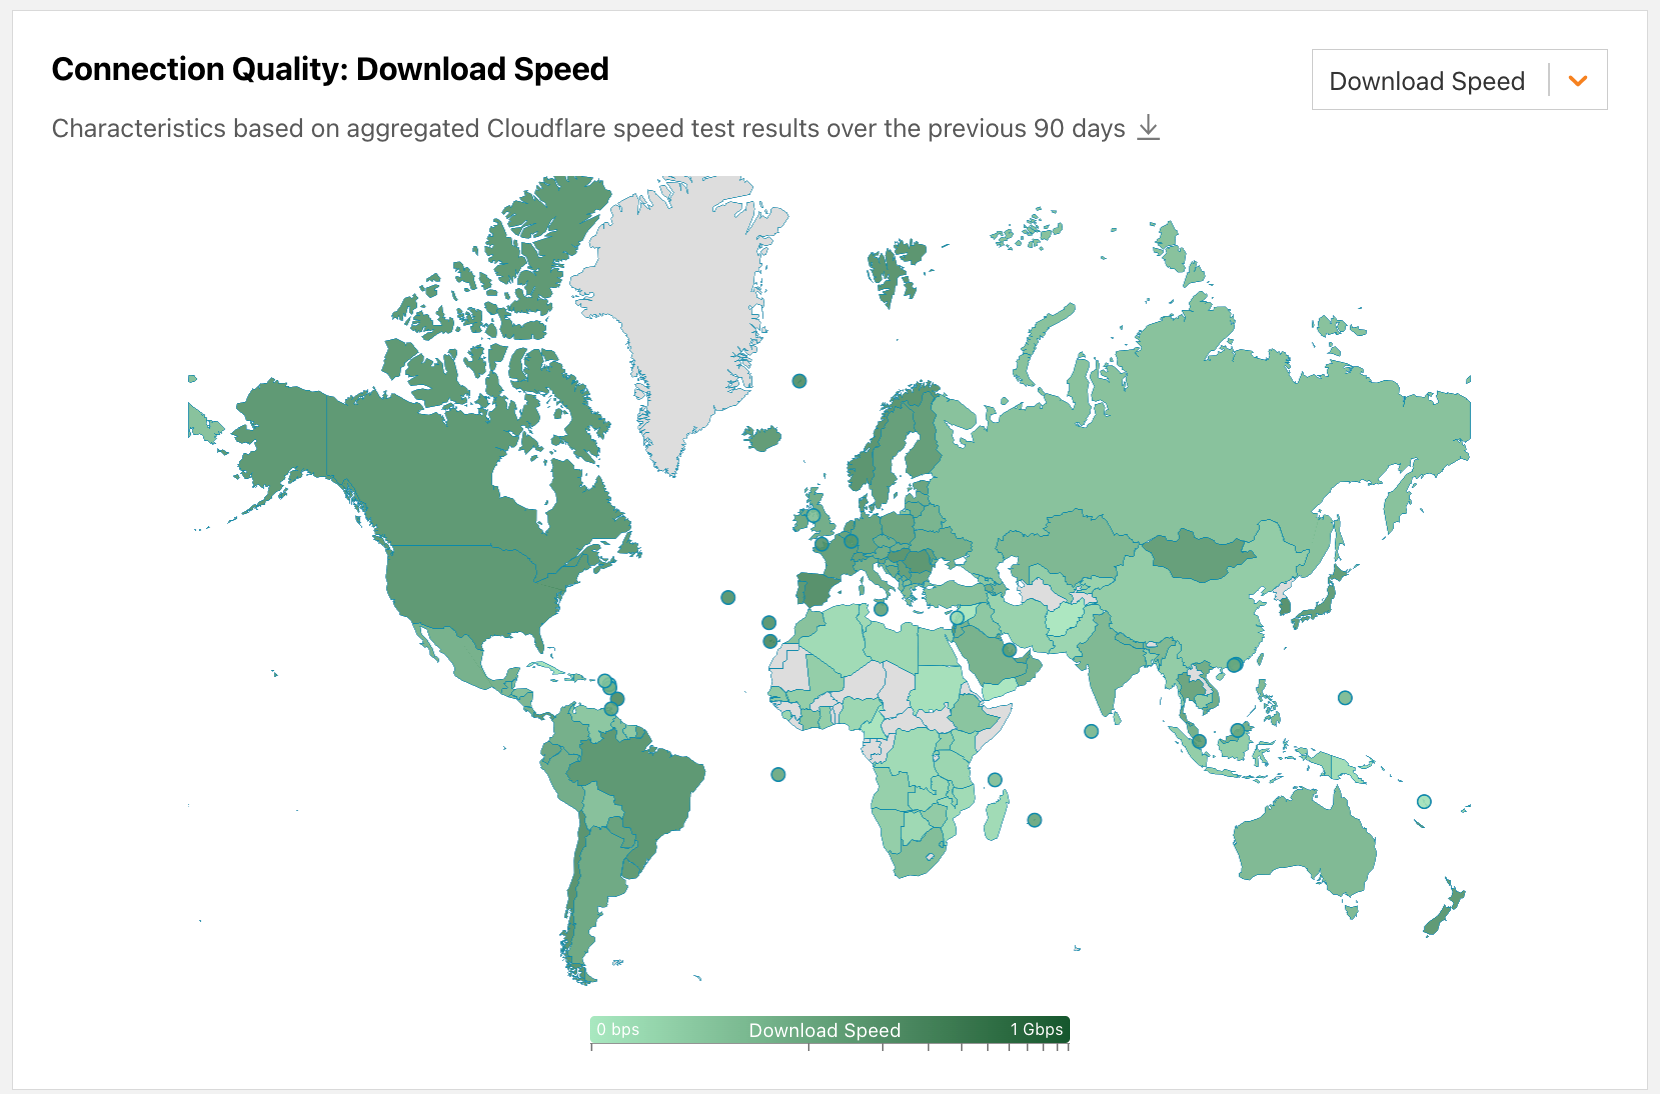
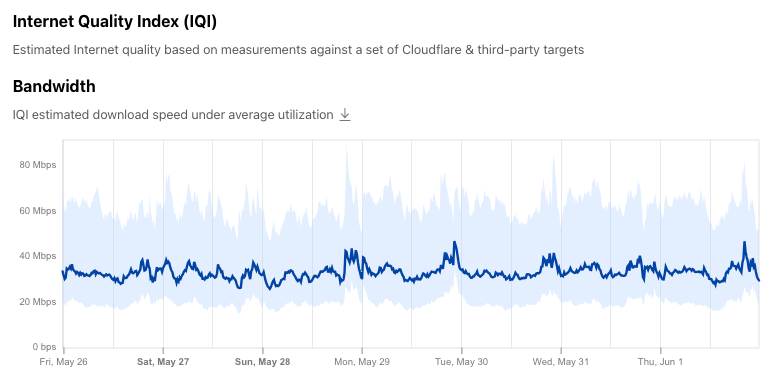
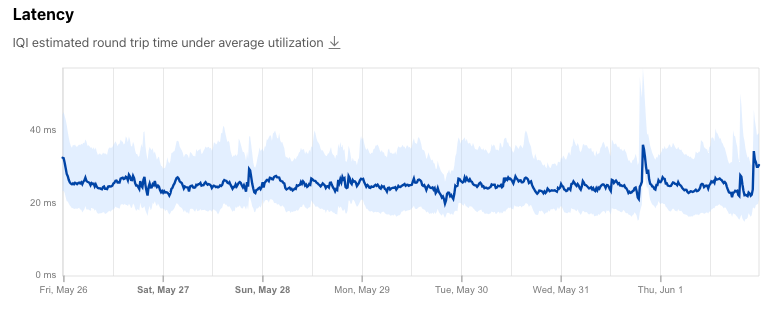

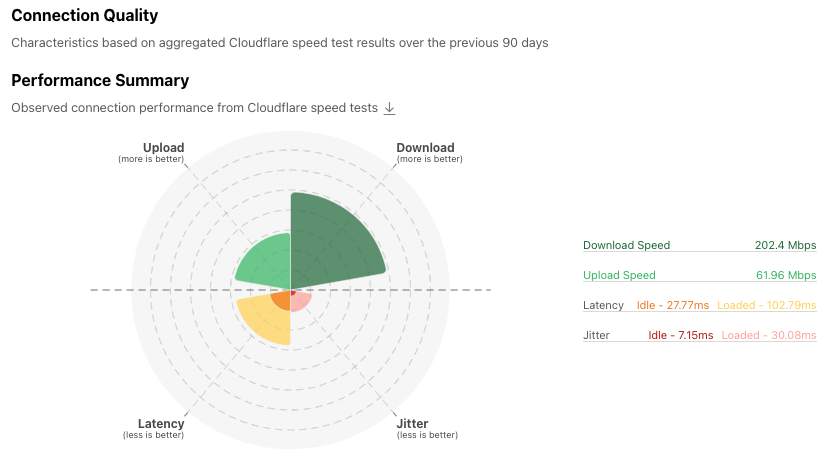

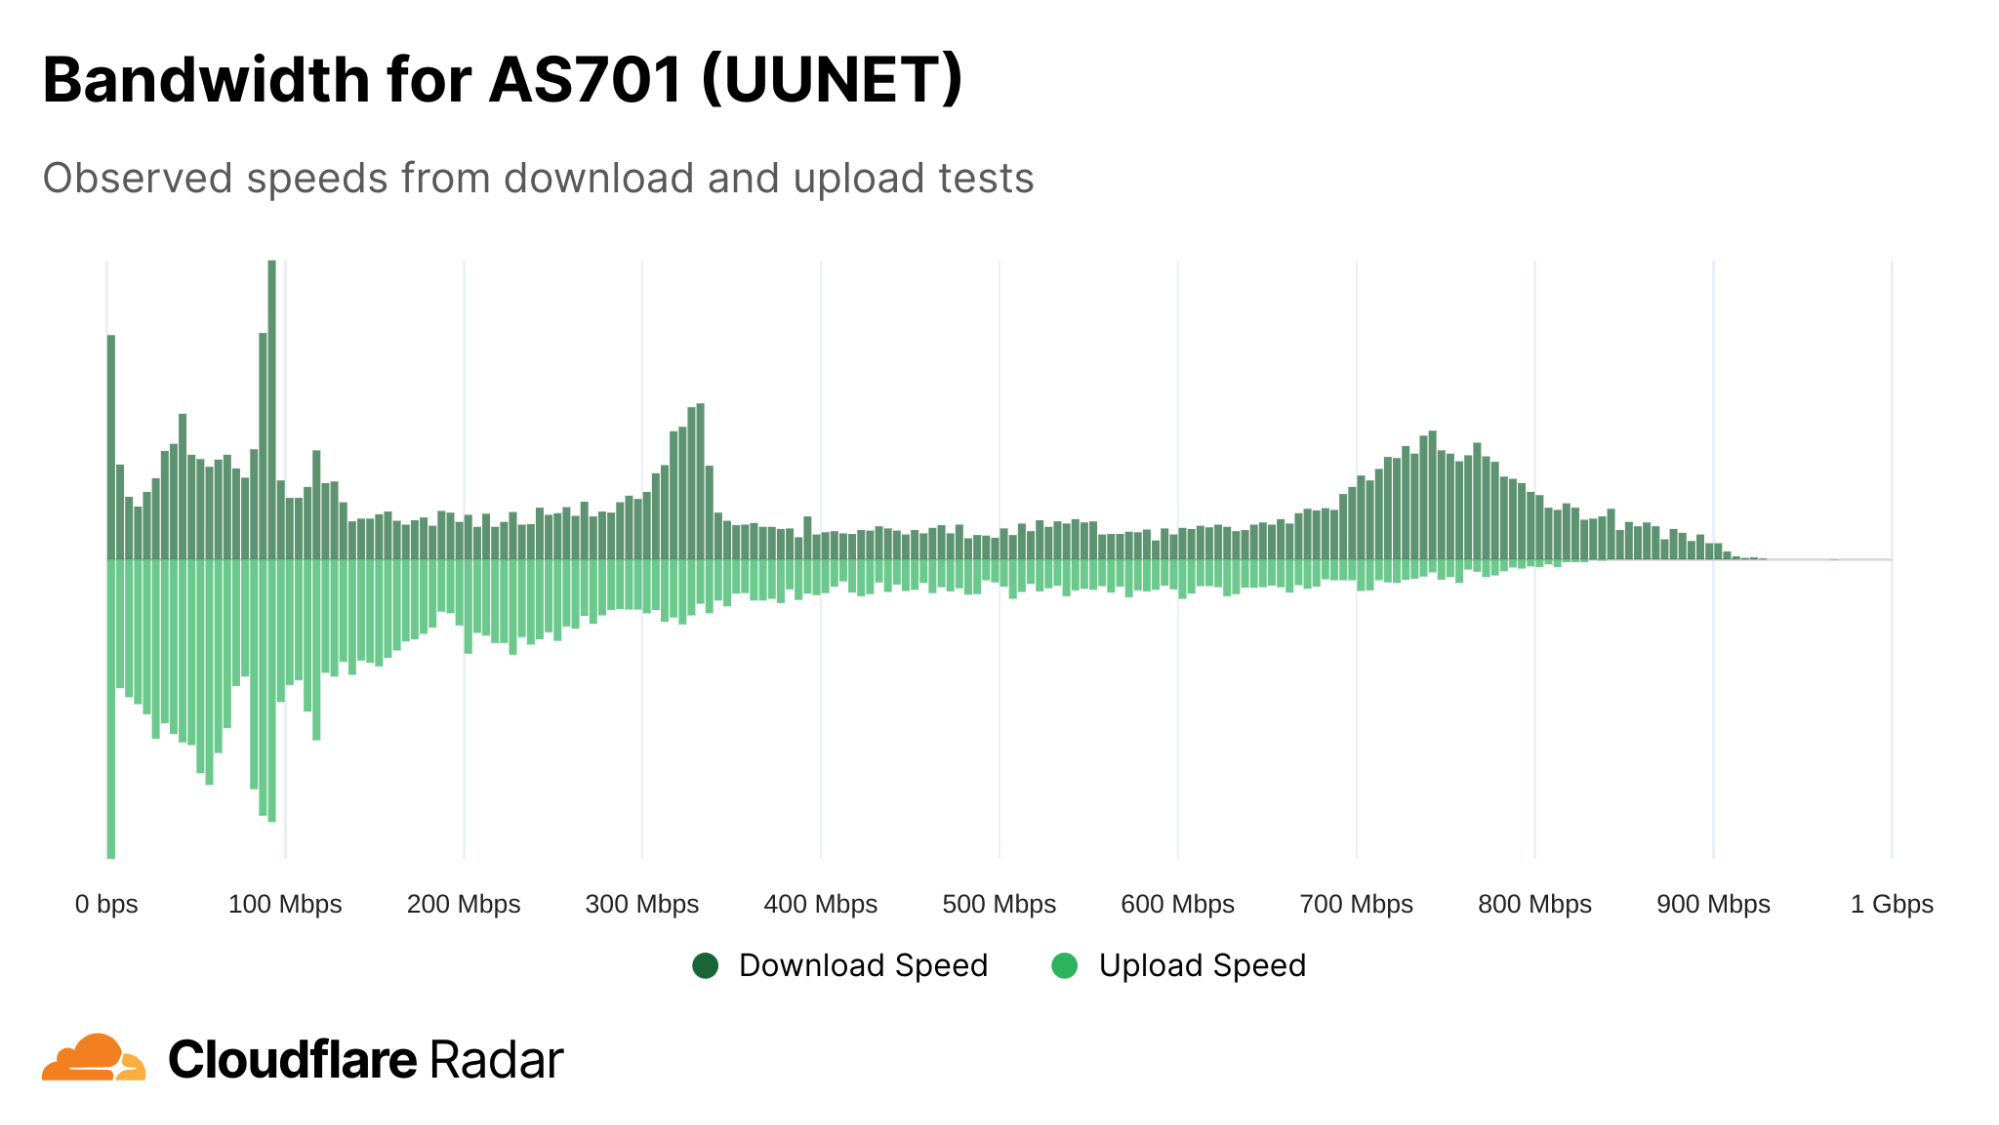

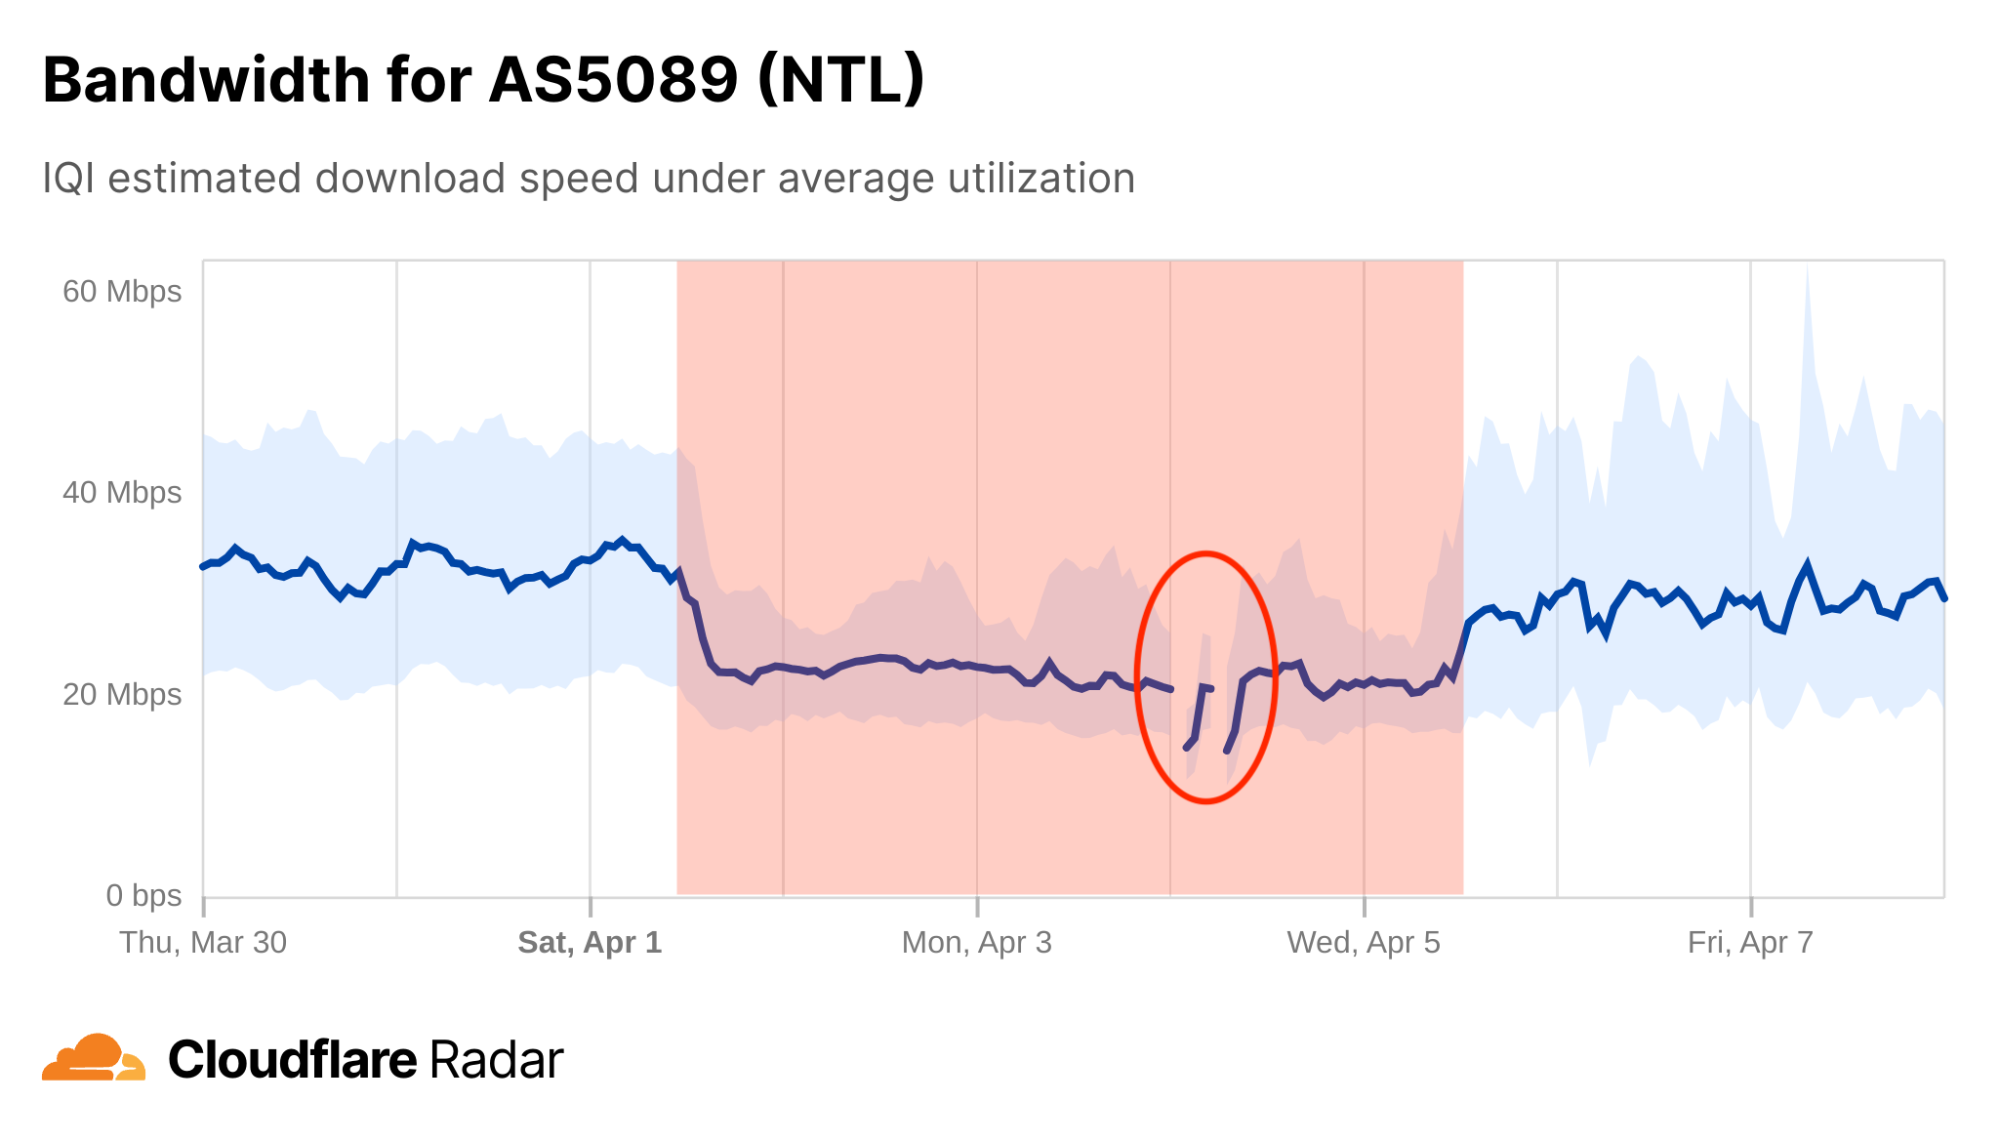

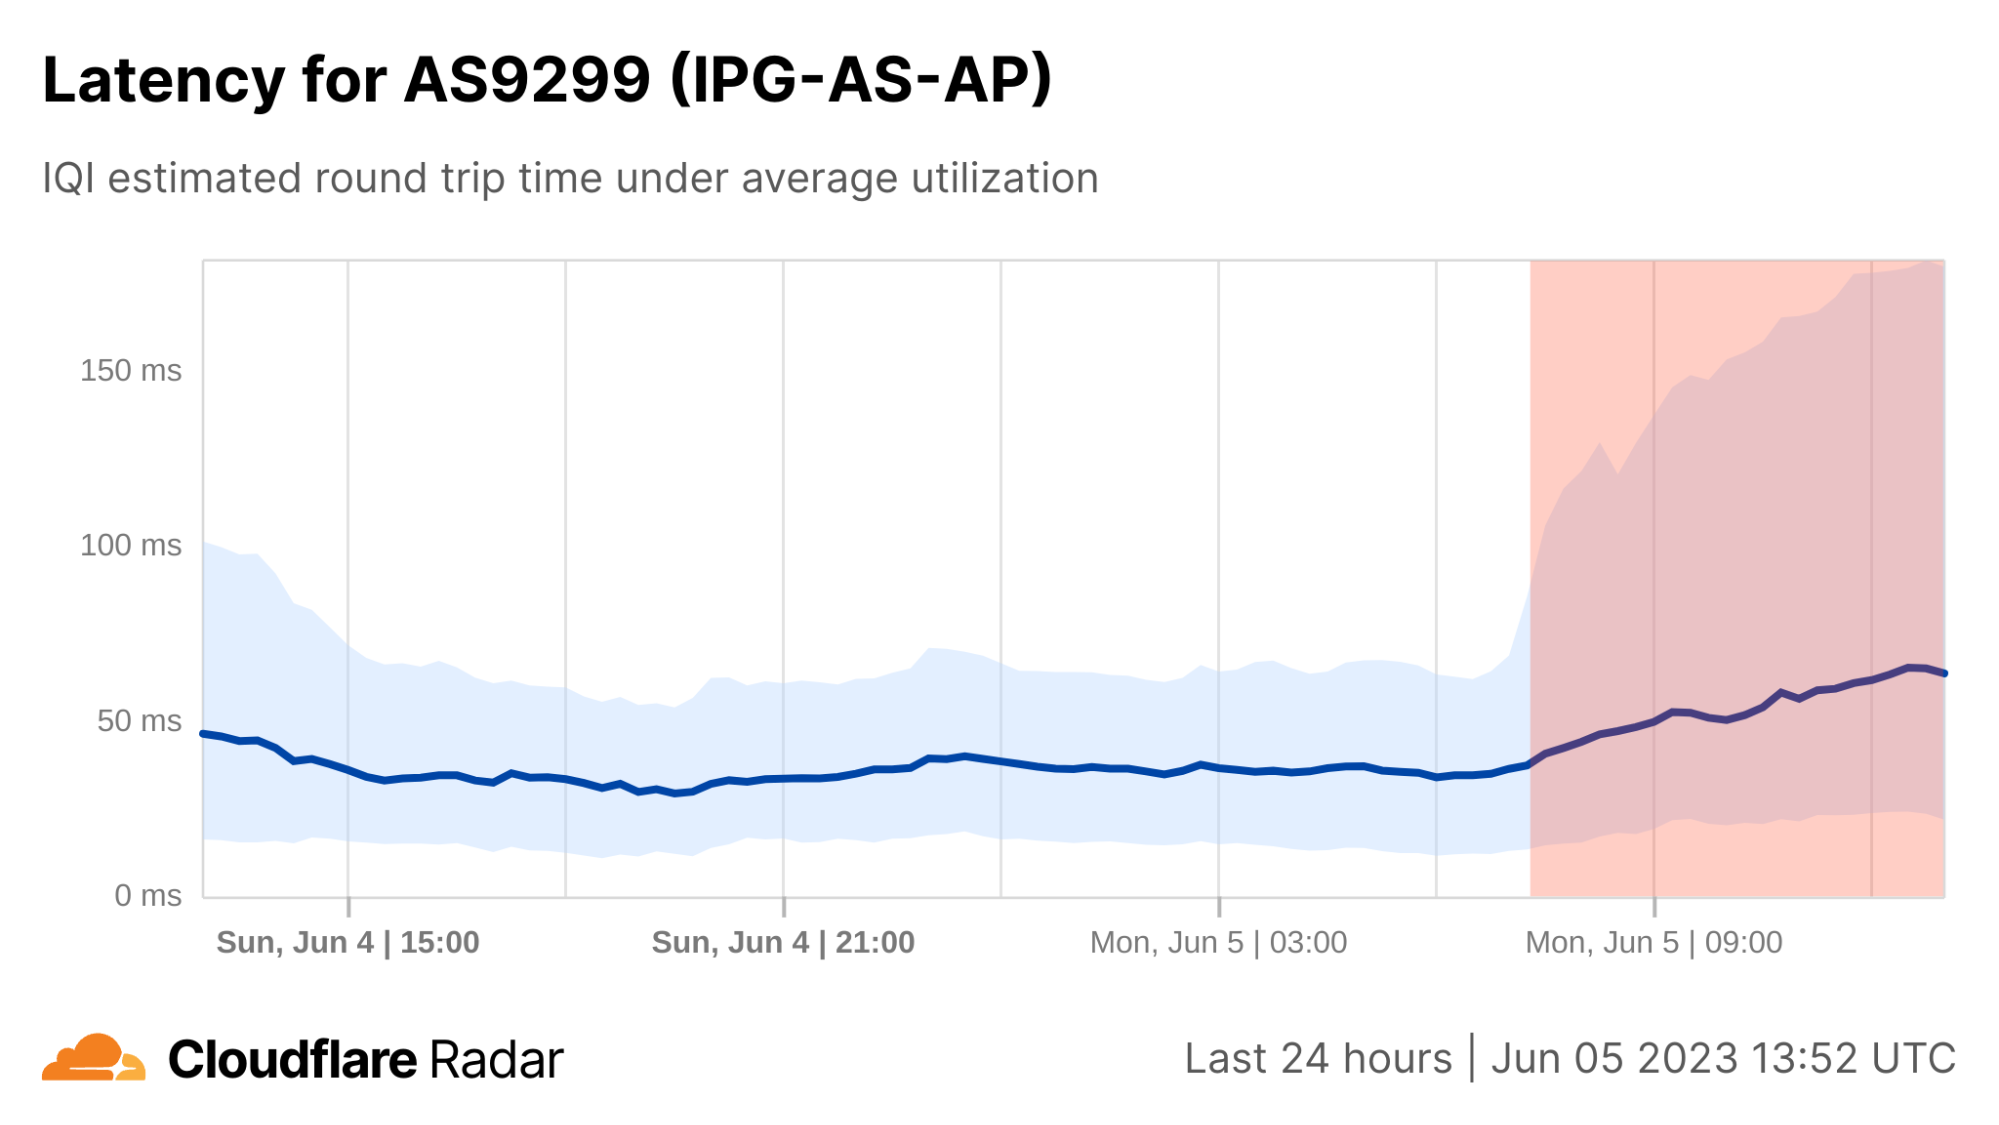

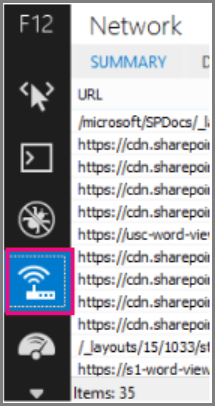
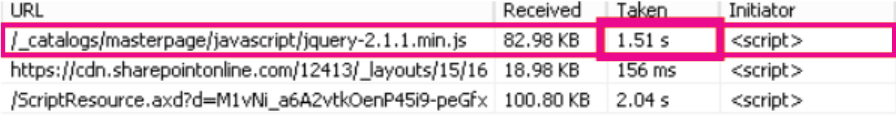
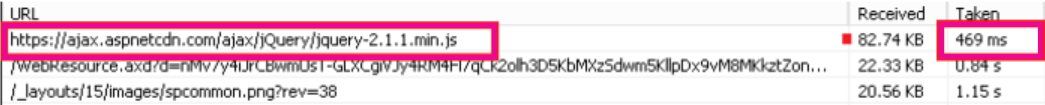


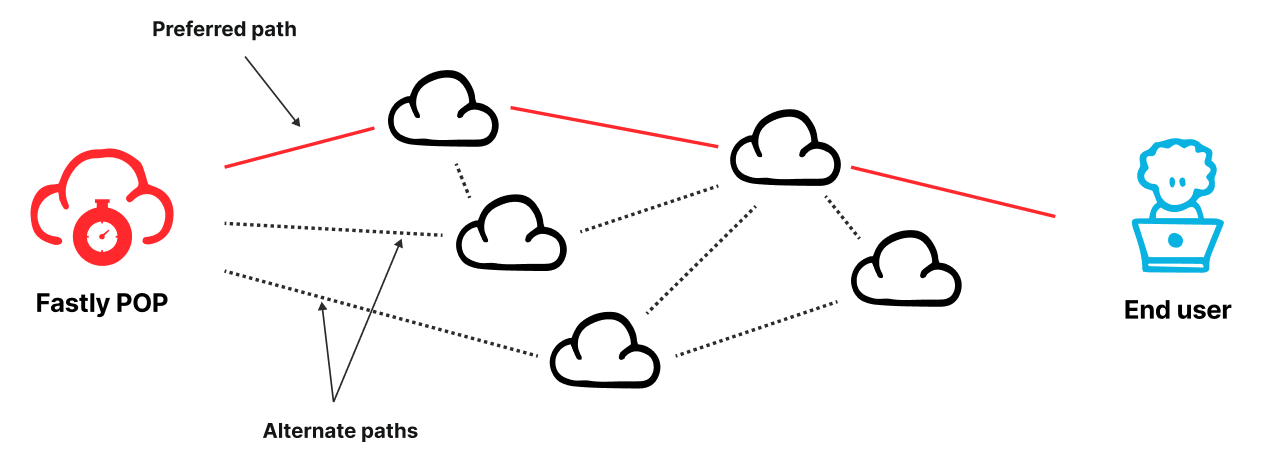
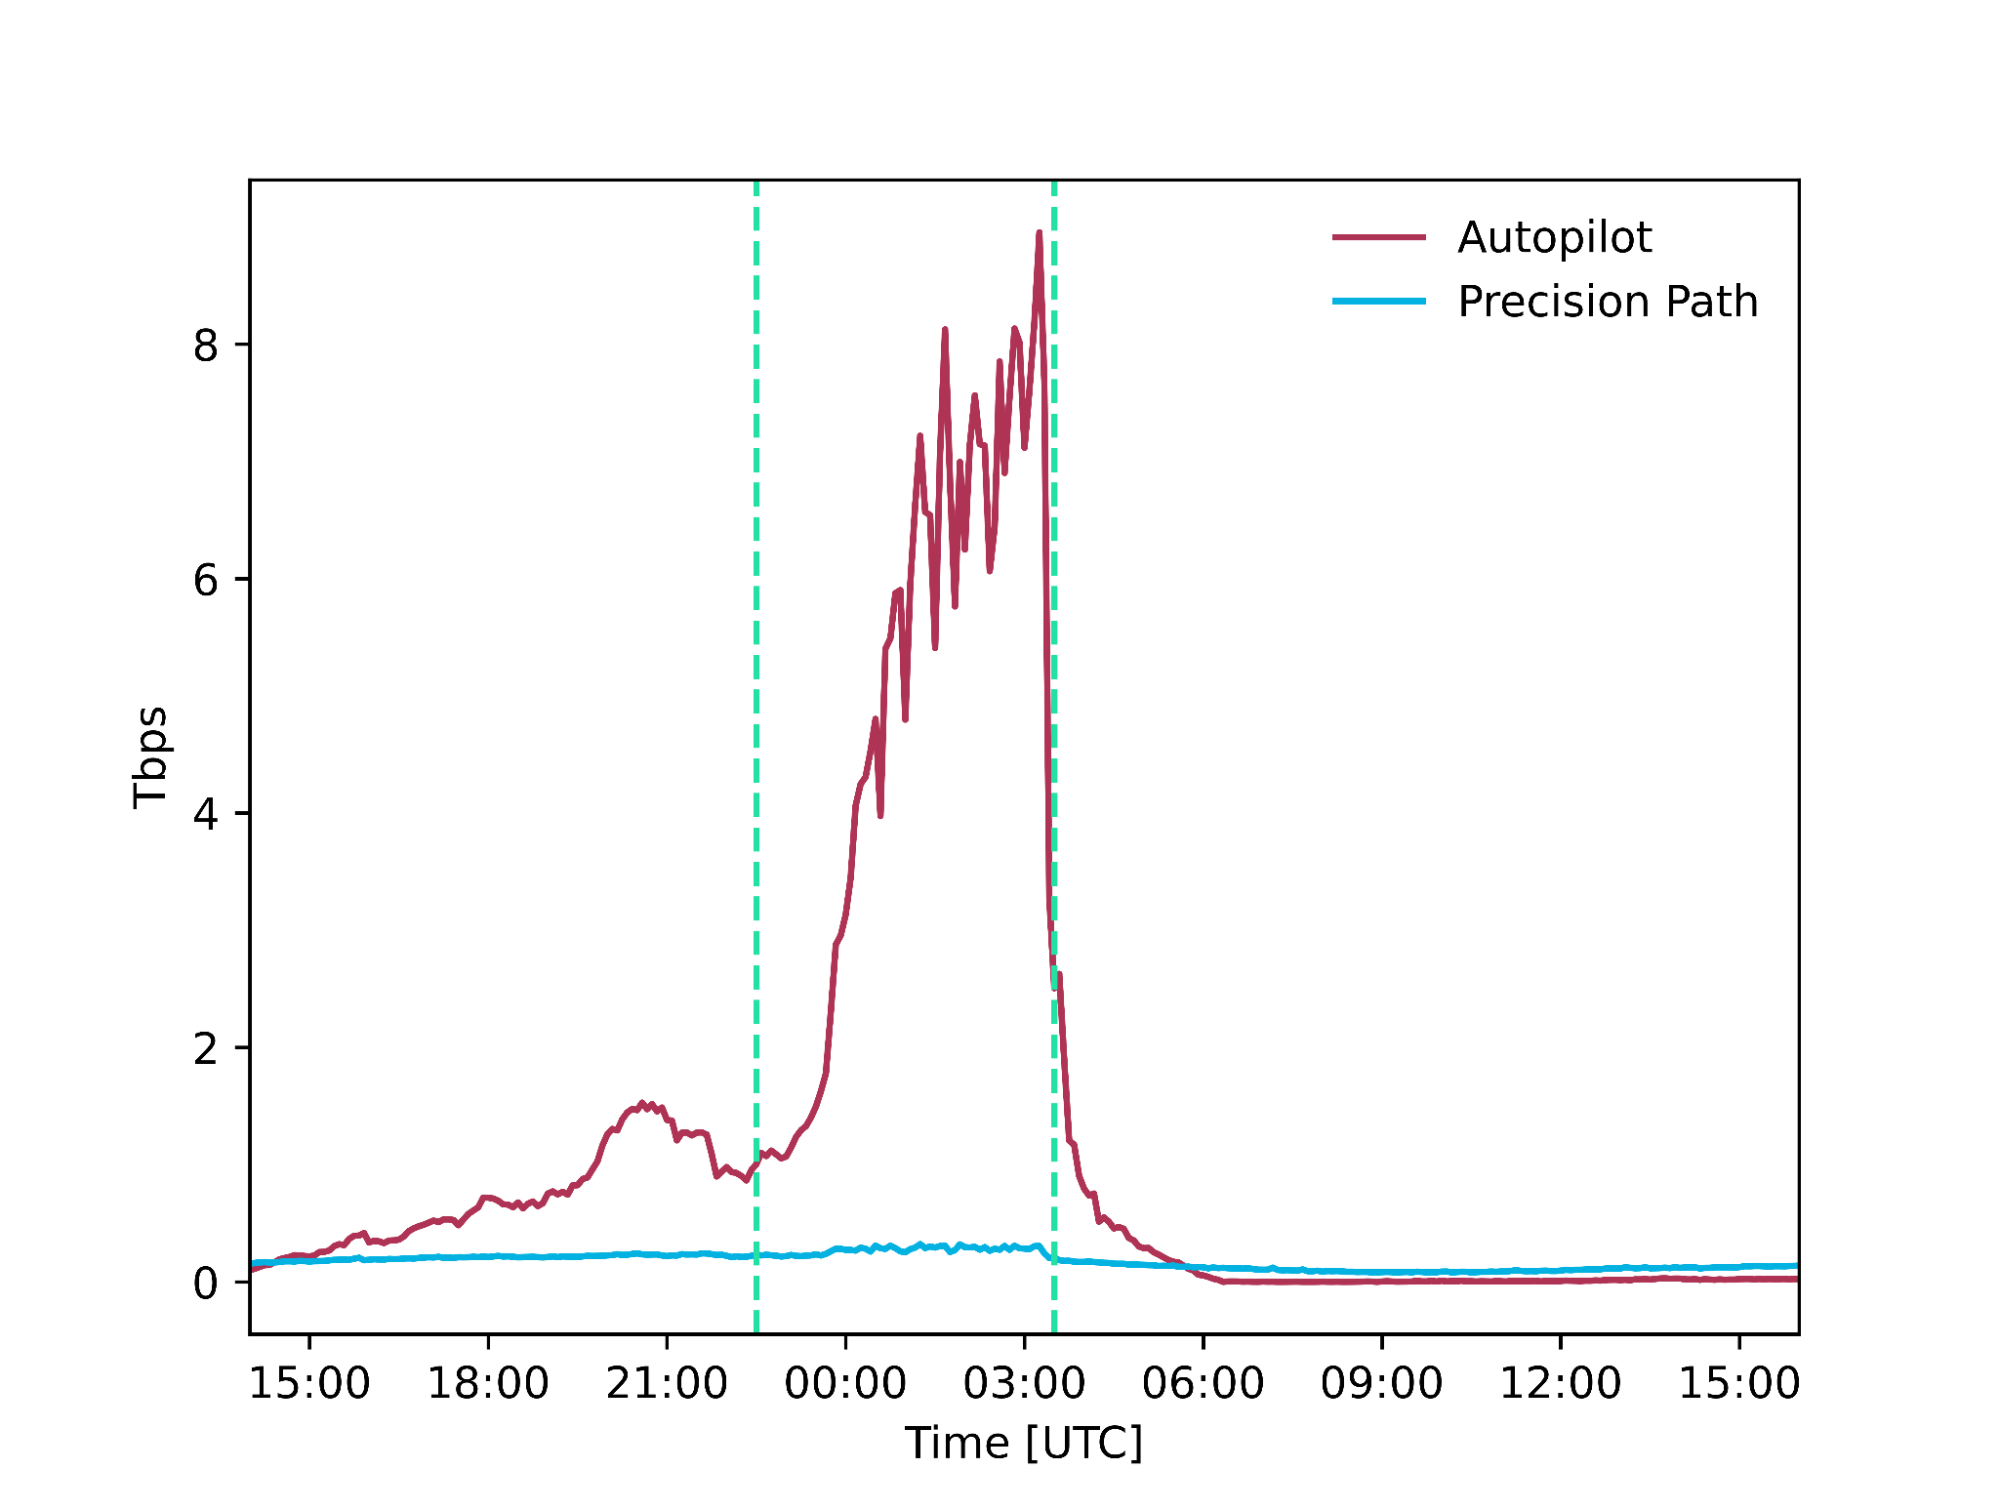
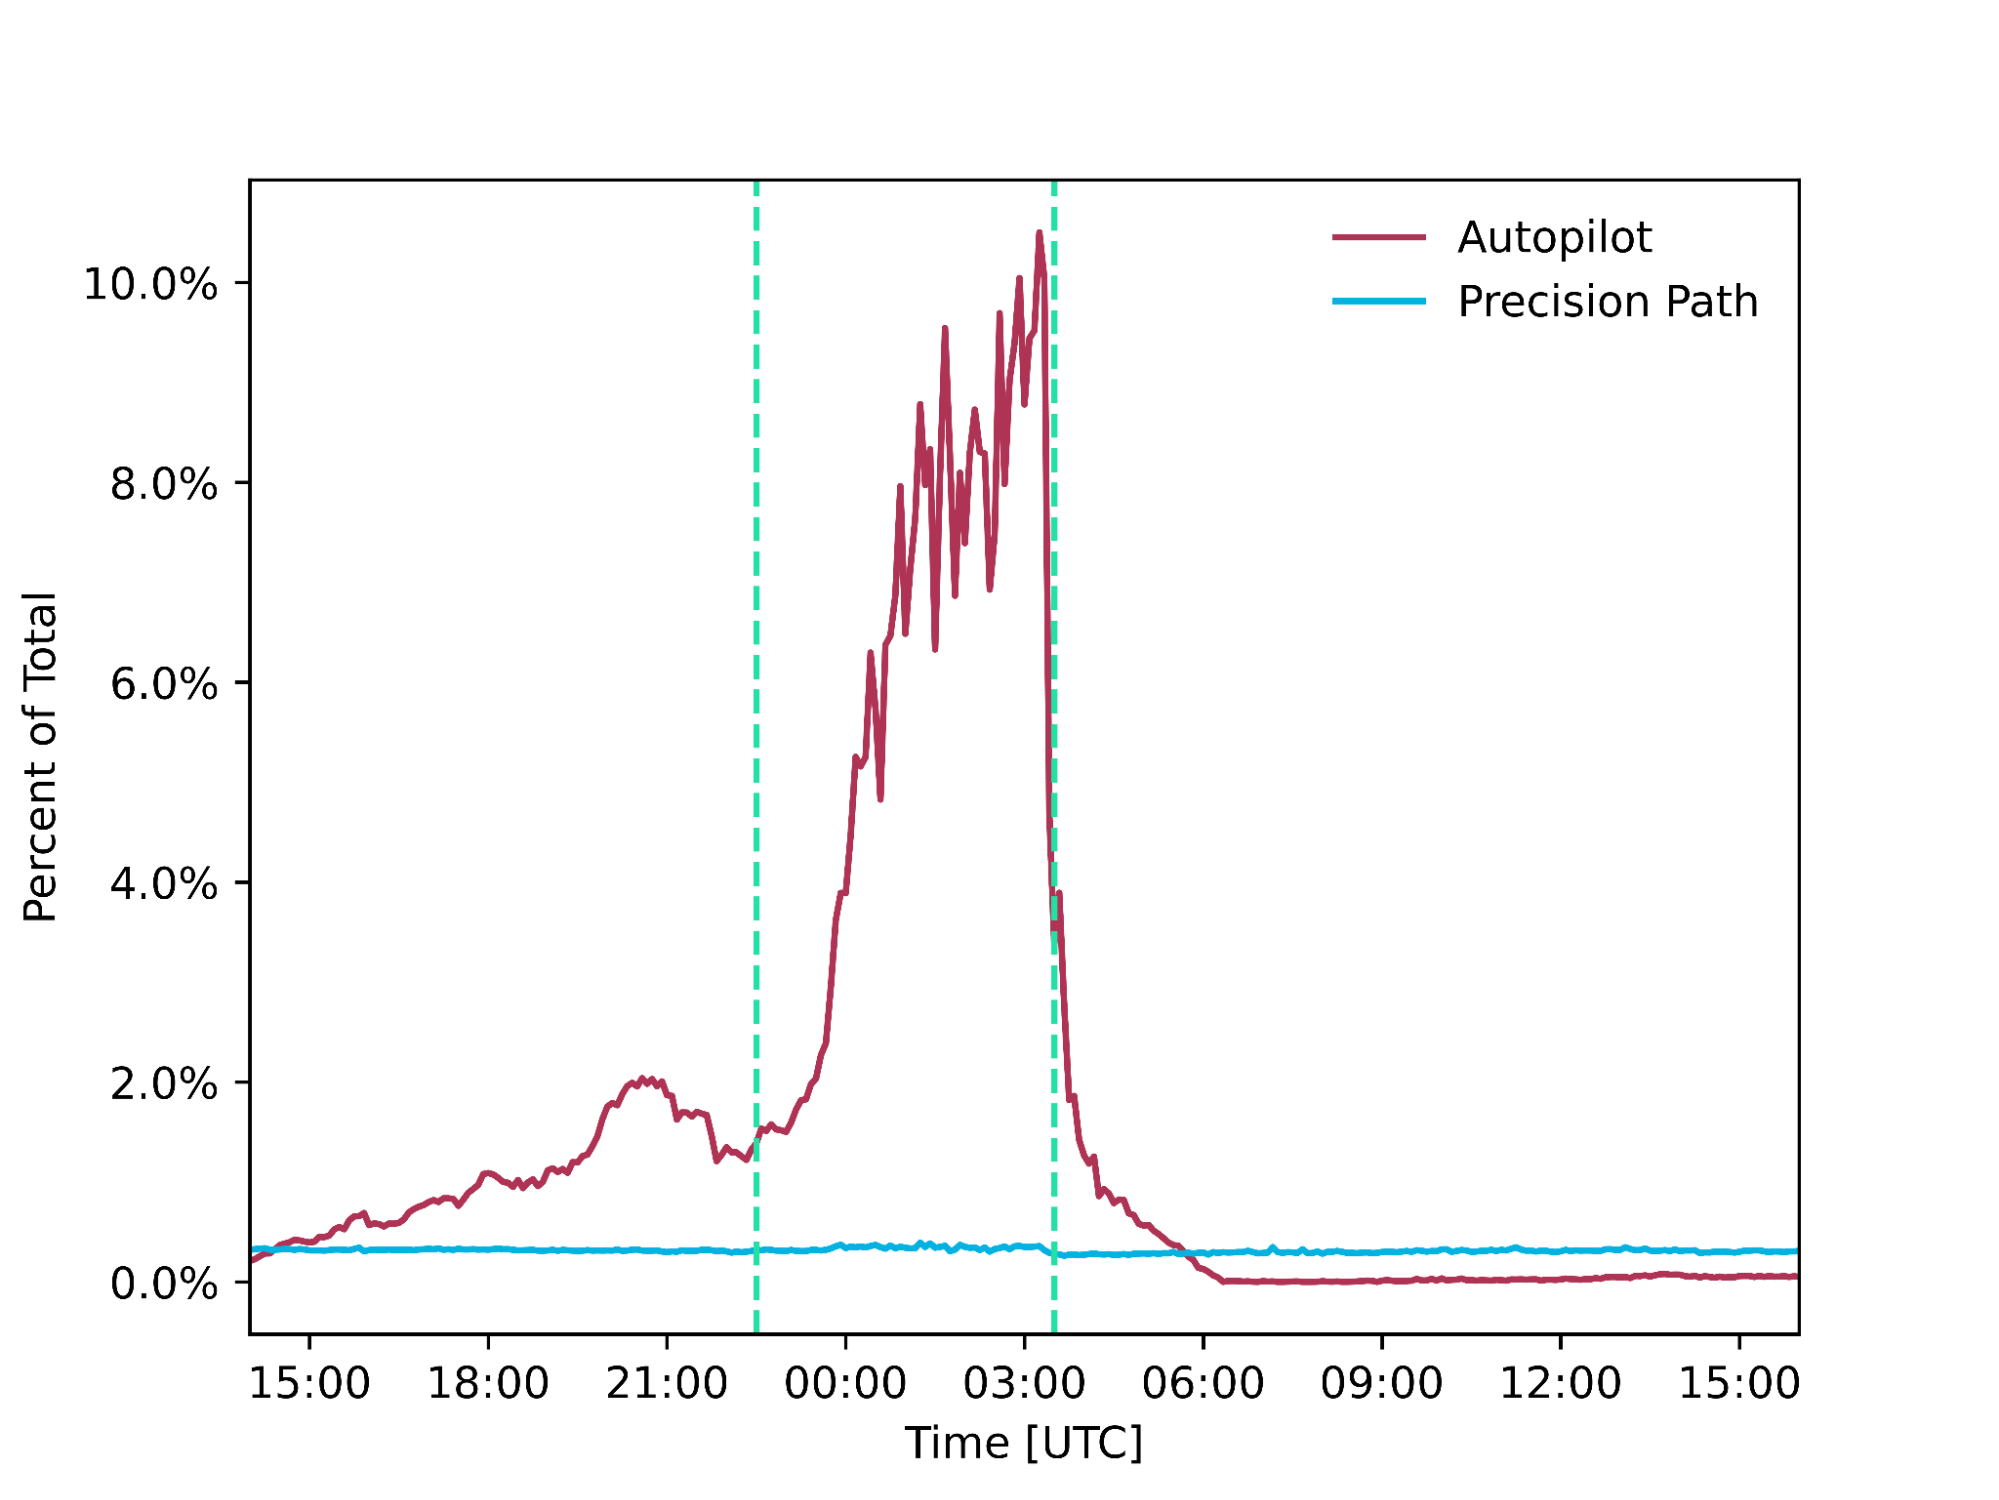
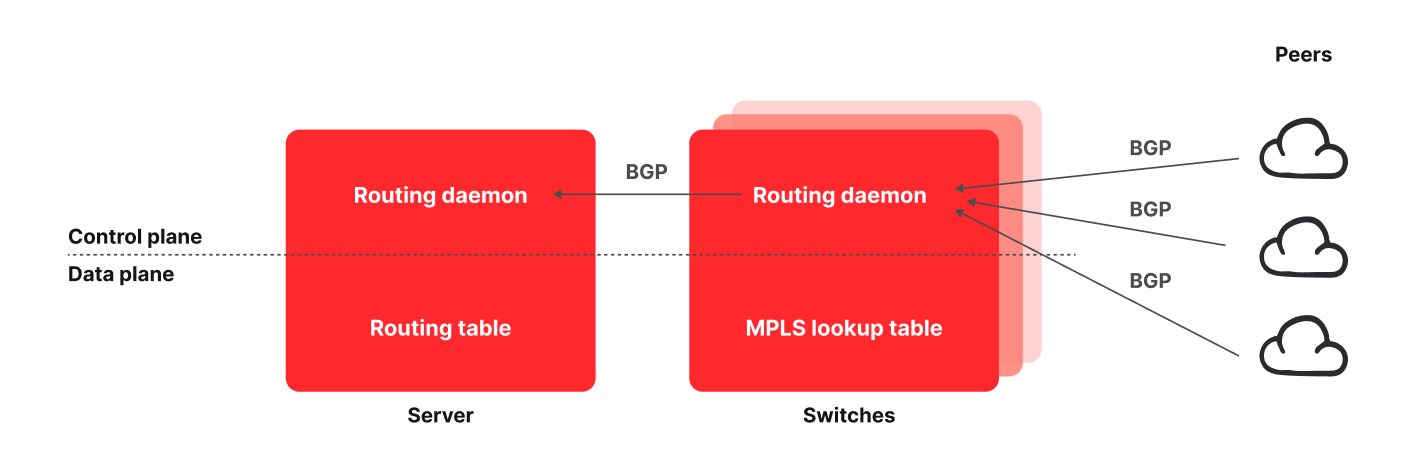
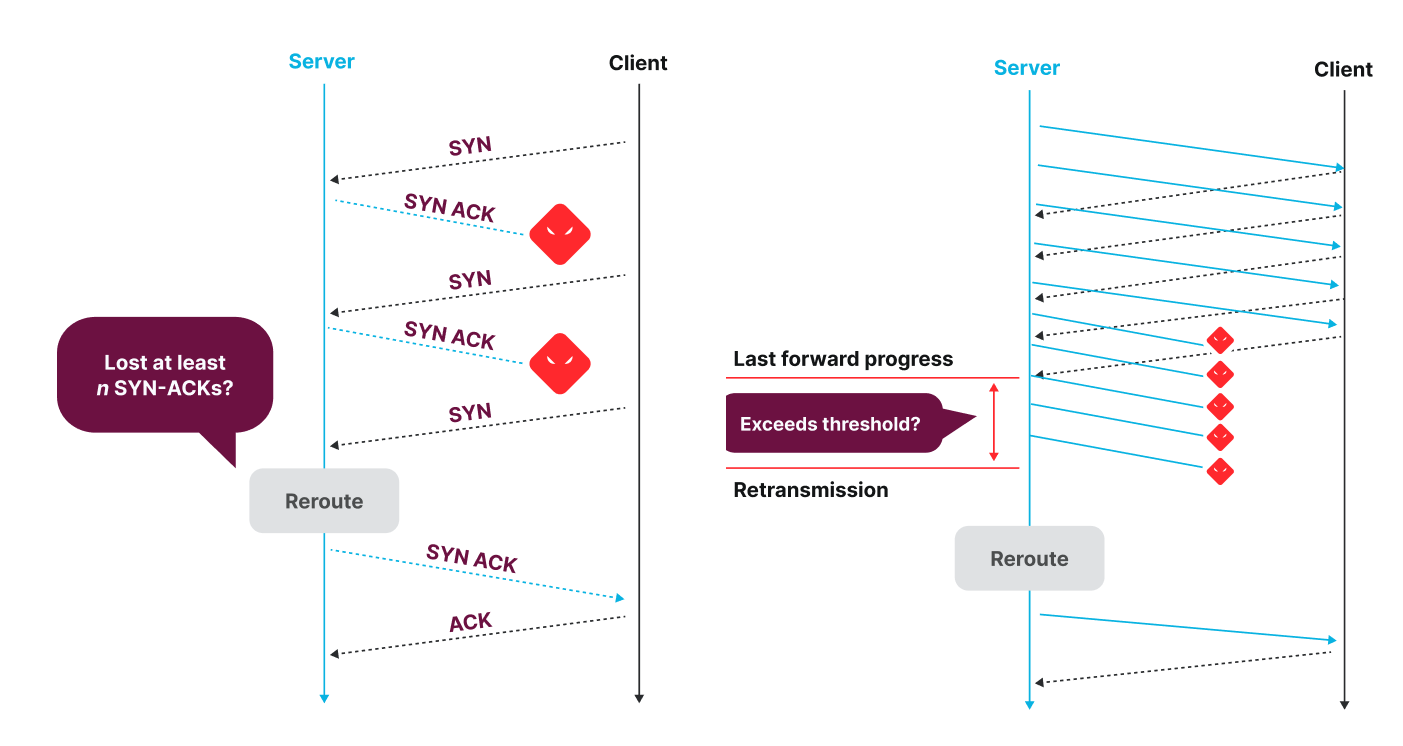
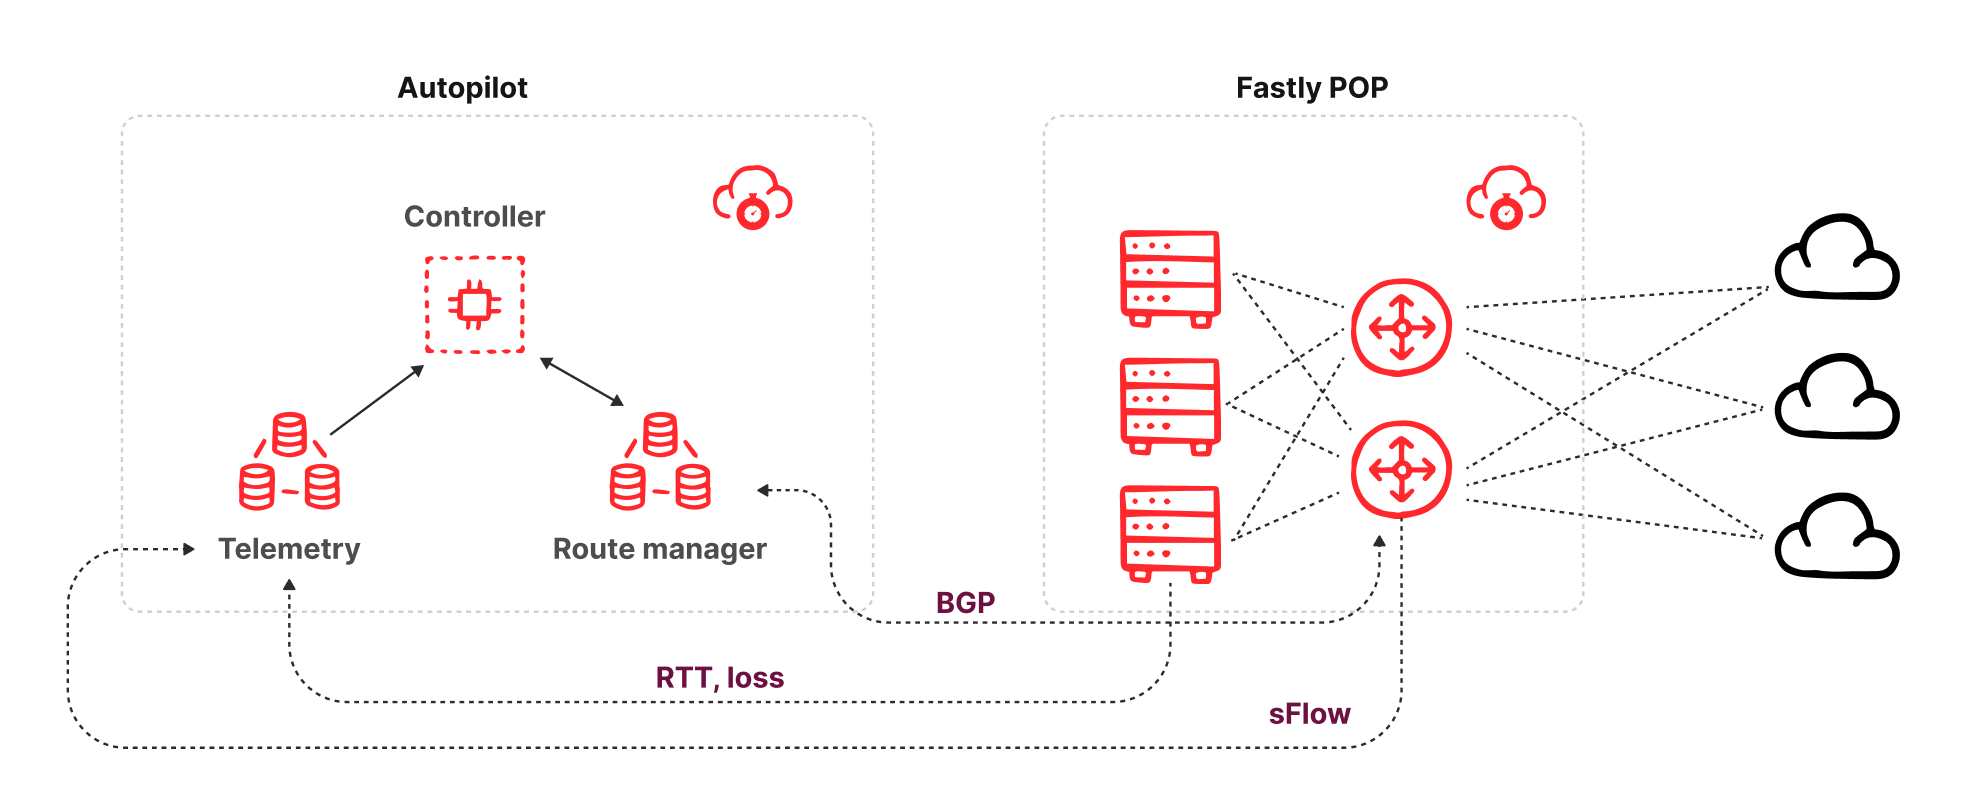
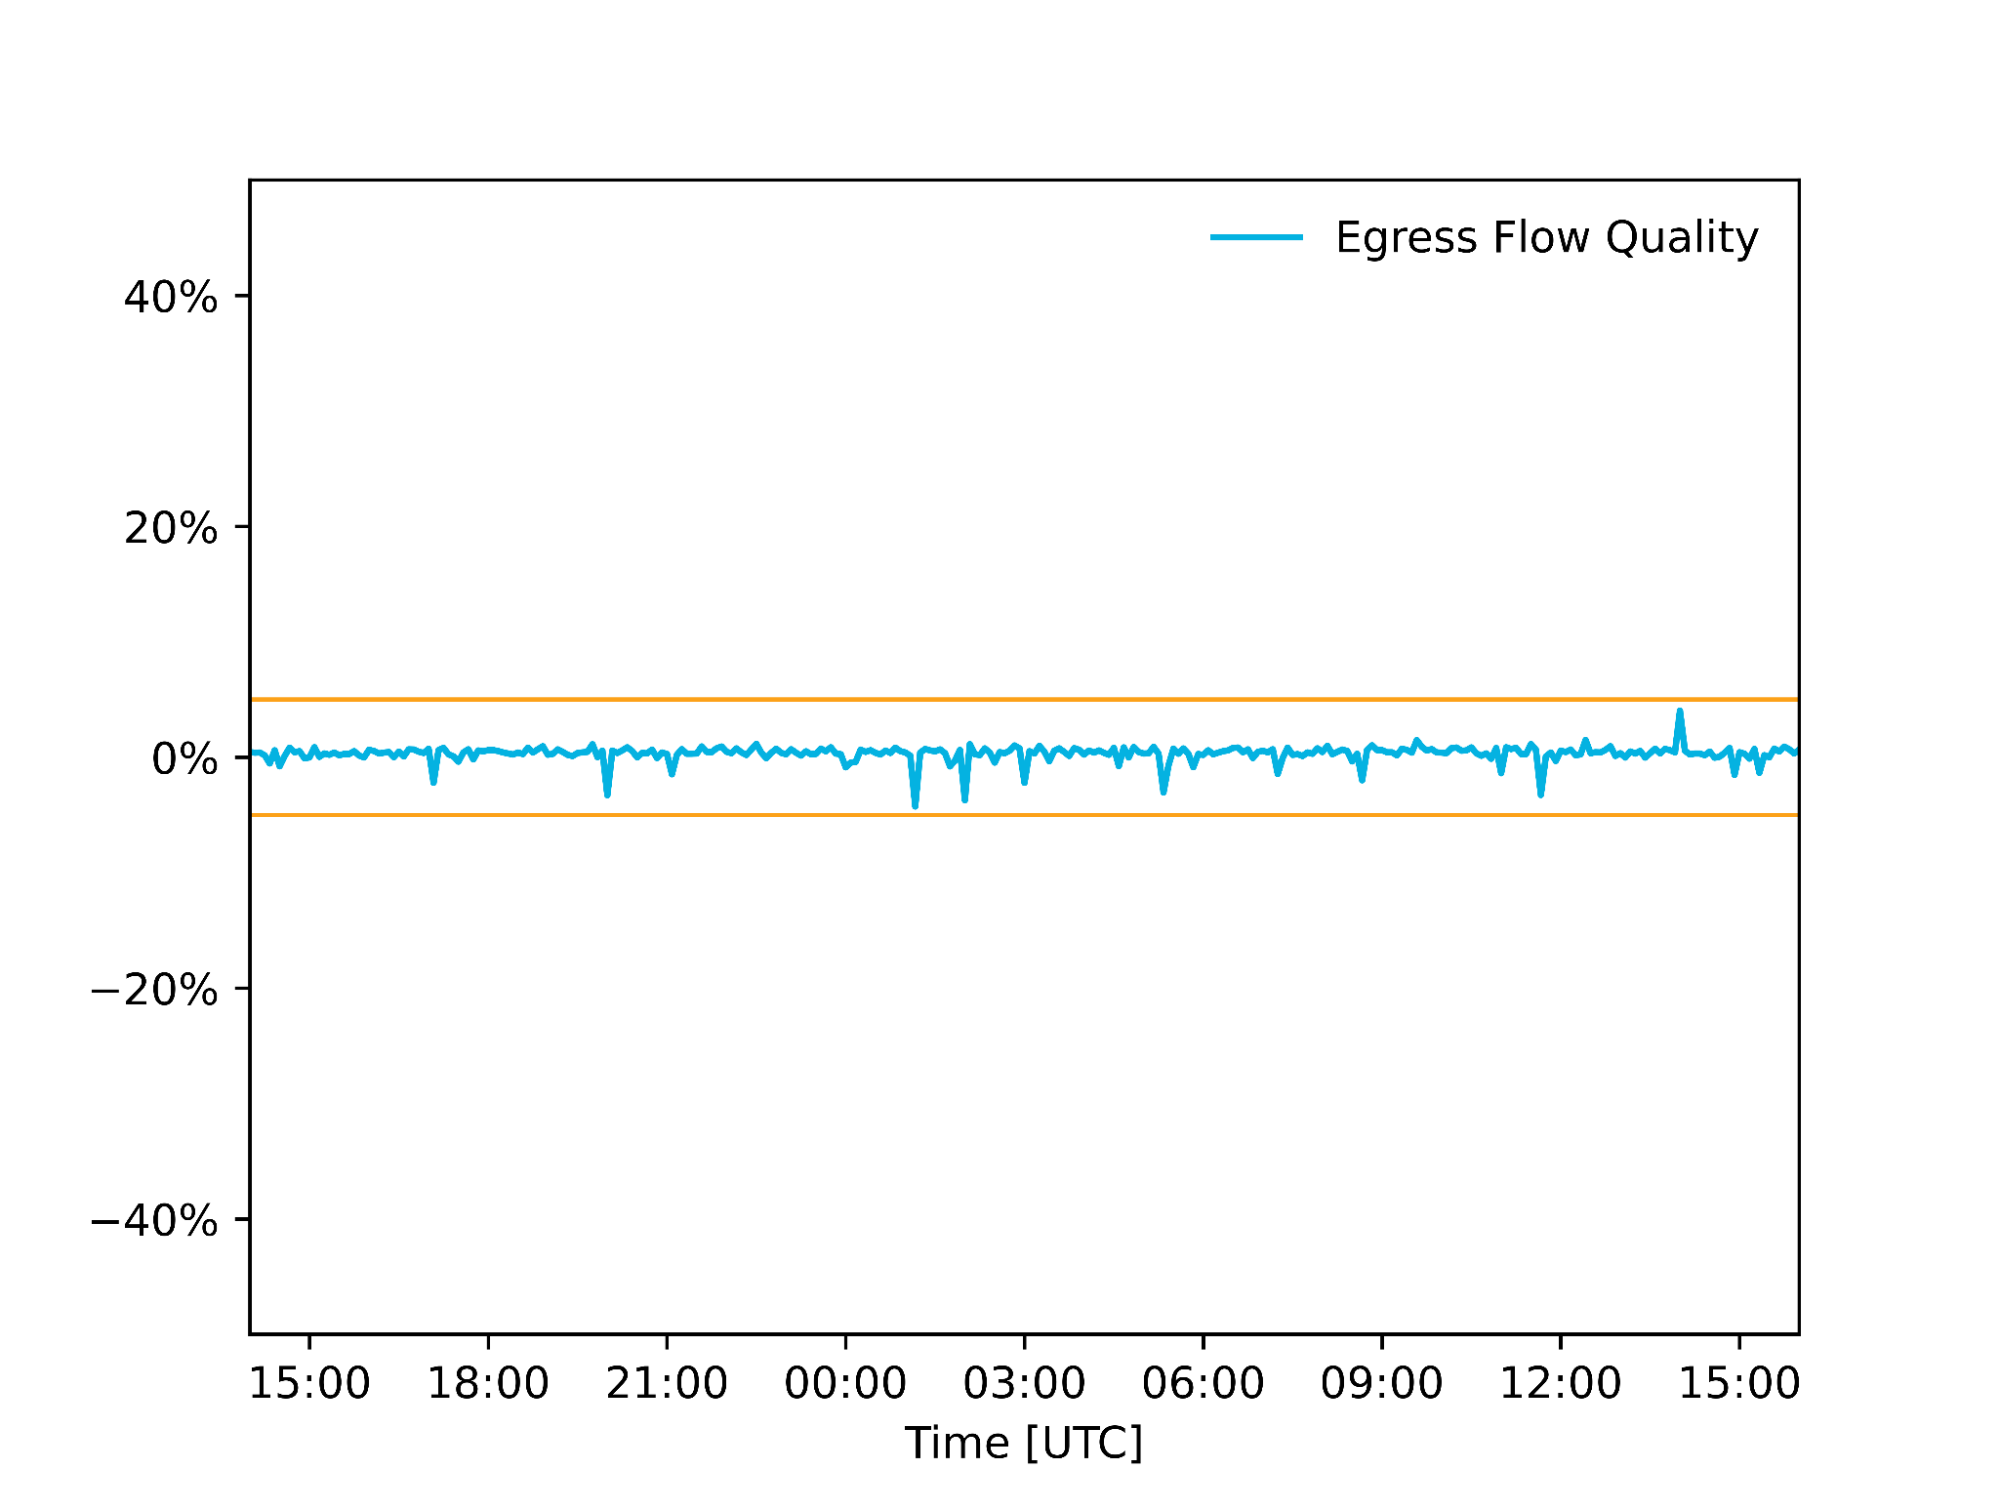