Helping build a safer Internet by measuring BGP RPKI Route Origin Validation

The Border Gateway Protocol (BGP) is the glue that keeps the entire Internet together. However, despite its vital function, BGP wasn’t originally designed to protect against malicious actors or routing mishaps. It has since been updated to account for this shortcoming with the Resource Public Key Infrastructure (RPKI) framework, but can we declare it to be safe yet?

If the question needs asking, you might suspect we can’t. There is a shortage of reliable data on how much of the Internet is protected from preventable routing problems. Today, we’re releasing a new method to measure exactly that: what percentage of Internet users are protected by their Internet Service Provider from these issues. We find that there is a long way to go before the Internet is protected from routing problems, though it varies dramatically by country.

Why RPKI is necessary to secure Internet routing

The Internet is a network of independently-managed networks, called Autonomous Systems (ASes). To achieve global reachability, ASes interconnect with each other and determine the feasible paths to a given destination IP address by exchanging routing information using BGP. BGP enables routers with only local network visibility to construct end-to-end paths based on the arbitrary preferences of each administrative entity that operates that equipment. Typically, Internet traffic between a user and a destination traverses multiple AS networks using paths constructed by BGP routers.

BGP, however, lacks built-in security mechanisms to protect the integrity of the exchanged routing information and to provide authentication and authorization of the advertised IP address space. Because of this, AS operators must implicitly trust that the routing information exchanged through BGP is accurate. As a result, the Internet is vulnerable to the injection of bogus routing information, which cannot be mitigated by security measures at the client or server level of the network.

An adversary with access to a BGP router can inject fraudulent routes into the routing system, which can be used to execute an array of attacks, including:

  • Denial-of-Service (DoS) through traffic blackholing or redirection,
  • Impersonation attacks to eavesdrop on communications,
  • Machine-in-the-Middle exploits to modify the exchanged data, and subvert reputation-based filtering systems.

Additionally, local misconfigurations and fat-finger errors can be propagated well beyond the source of the error and cause major disruption across the Internet.

Such an incident happened on June 24, 2019. Millions of users were unable to access Cloudflare address space when a regional ISP in Pennsylvania accidentally advertised routes to Cloudflare through their capacity-limited network. This was effectively the Internet equivalent of routing an entire freeway through a neighborhood street.

Traffic misdirections like these, either unintentional or intentional, are not uncommon. The Internet Society’s MANRS (Mutually Agreed Norms for Routing Security) initiative estimated that in 2020 alone there were over 3,000 route leaks and hijacks, and new occurrences can be observed every day through Cloudflare Radar.

The most prominent proposals to secure BGP routing, standardized by the IETF focus on validating the origin of the advertised routes using Resource Public Key Infrastructure (RPKI) and verifying the integrity of the paths with BGPsec. Specifically, RPKI (defined in RFC 7115) relies on a Public Key Infrastructure to validate that an AS advertising a route to a destination (an IP address space) is the legitimate owner of those IP addresses.

RPKI has been defined for a long time but lacks adoption. It requires network operators to cryptographically sign their prefixes, and routing networks to perform an RPKI Route Origin Validation (ROV) on their routers. This is a two-step operation that requires coordination and participation from many actors to be effective.

The two phases of RPKI adoption: signing origins and validating origins

RPKI has two phases of deployment: first, an AS that wants to protect its own IP prefixes can cryptographically sign Route Origin Authorization (ROA) records thereby attesting to be the legitimate origin of that signed IP space. Second, an AS can avoid selecting invalid routes by performing Route Origin Validation (ROV, defined in RFC 6483).

With ROV, a BGP route received by a neighbor is validated against the available RPKI records. A route that is valid or missing from RPKI is selected, while a route with RPKI records found to be invalid is typically rejected, thus preventing the use and propagation of hijacked and misconfigured routes.

One issue with RPKI is the fact that implementing ROA is meaningful only if other ASes implement ROV, and vice versa. Therefore, securing BGP routing requires a united effort and a lack of broader adoption disincentivizes ASes from commiting the resources to validate their own routes. Conversely, increasing RPKI adoption can lead to network effects and accelerate RPKI deployment. Projects like MANRS and Cloudflare’s isbgpsafeyet.com are promoting good Internet citizenship among network operators, and make the benefits of RPKI deployment known to the Internet. You can check whether your own ISP is being a good Internet citizen by testing it on isbgpsafeyet.com.

Measuring the extent to which both ROA (signing of addresses by the network that controls them) and ROV (filtering of invalid routes by ISPs) have been implemented is important to evaluating the impact of these initiatives, developing situational awareness, and predicting the impact of future misconfigurations or attacks.

Measuring ROAs is straightforward since ROA data is readily available from RPKI repositories. Querying RPKI repositories for publicly routed IP prefixes (e.g. prefixes visible in the RouteViews and RIPE RIS routing tables) allows us to estimate the percentage of addresses covered by ROA objects. Currently, there are 393,344 IPv4 and 86,306 IPv6 ROAs in the global RPKI system, covering about 40% of the globally routed prefix-AS origin pairs1.

Measuring ROV, however, is significantly more challenging given it is configured inside the BGP routers of each AS, not accessible by anyone other than each router’s administrator.

Measuring ROV deployment

Although we do not have direct access to the configuration of everyone’s BGP routers, it is possible to infer the use of ROV by comparing the reachability of RPKI-valid and RPKI-invalid prefixes from measurement points within an AS2.

Consider the following toy topology as an example, where an RPKI-invalid origin is advertised through AS0 to AS1 and AS2. If AS1 filters and rejects RPKI-invalid routes, a user behind AS1 would not be able to connect to that origin. By contrast, if AS2 does not reject RPKI invalids, a user behind AS2 would be able to connect to that origin.

While occasionally a user may be unable to access an origin due to transient network issues, if multiple users act as vantage points for a measurement system, we would be able to collect a large number of data points to infer which ASes deploy ROV.

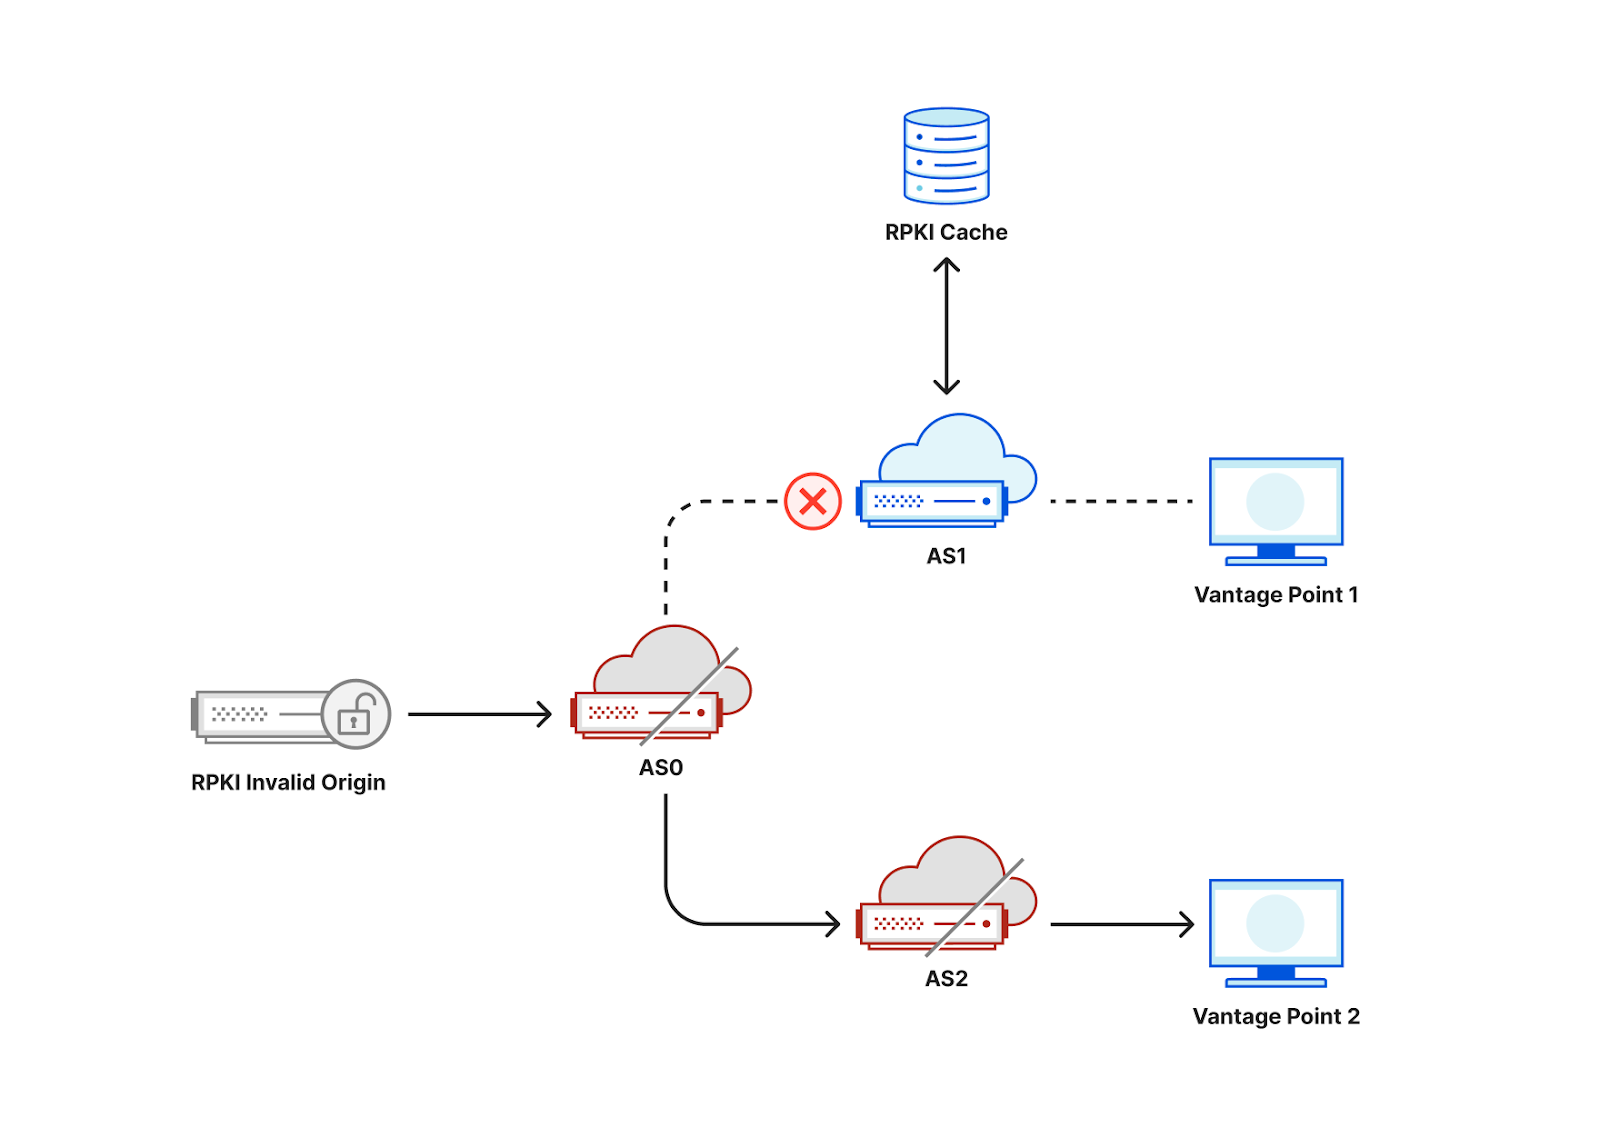
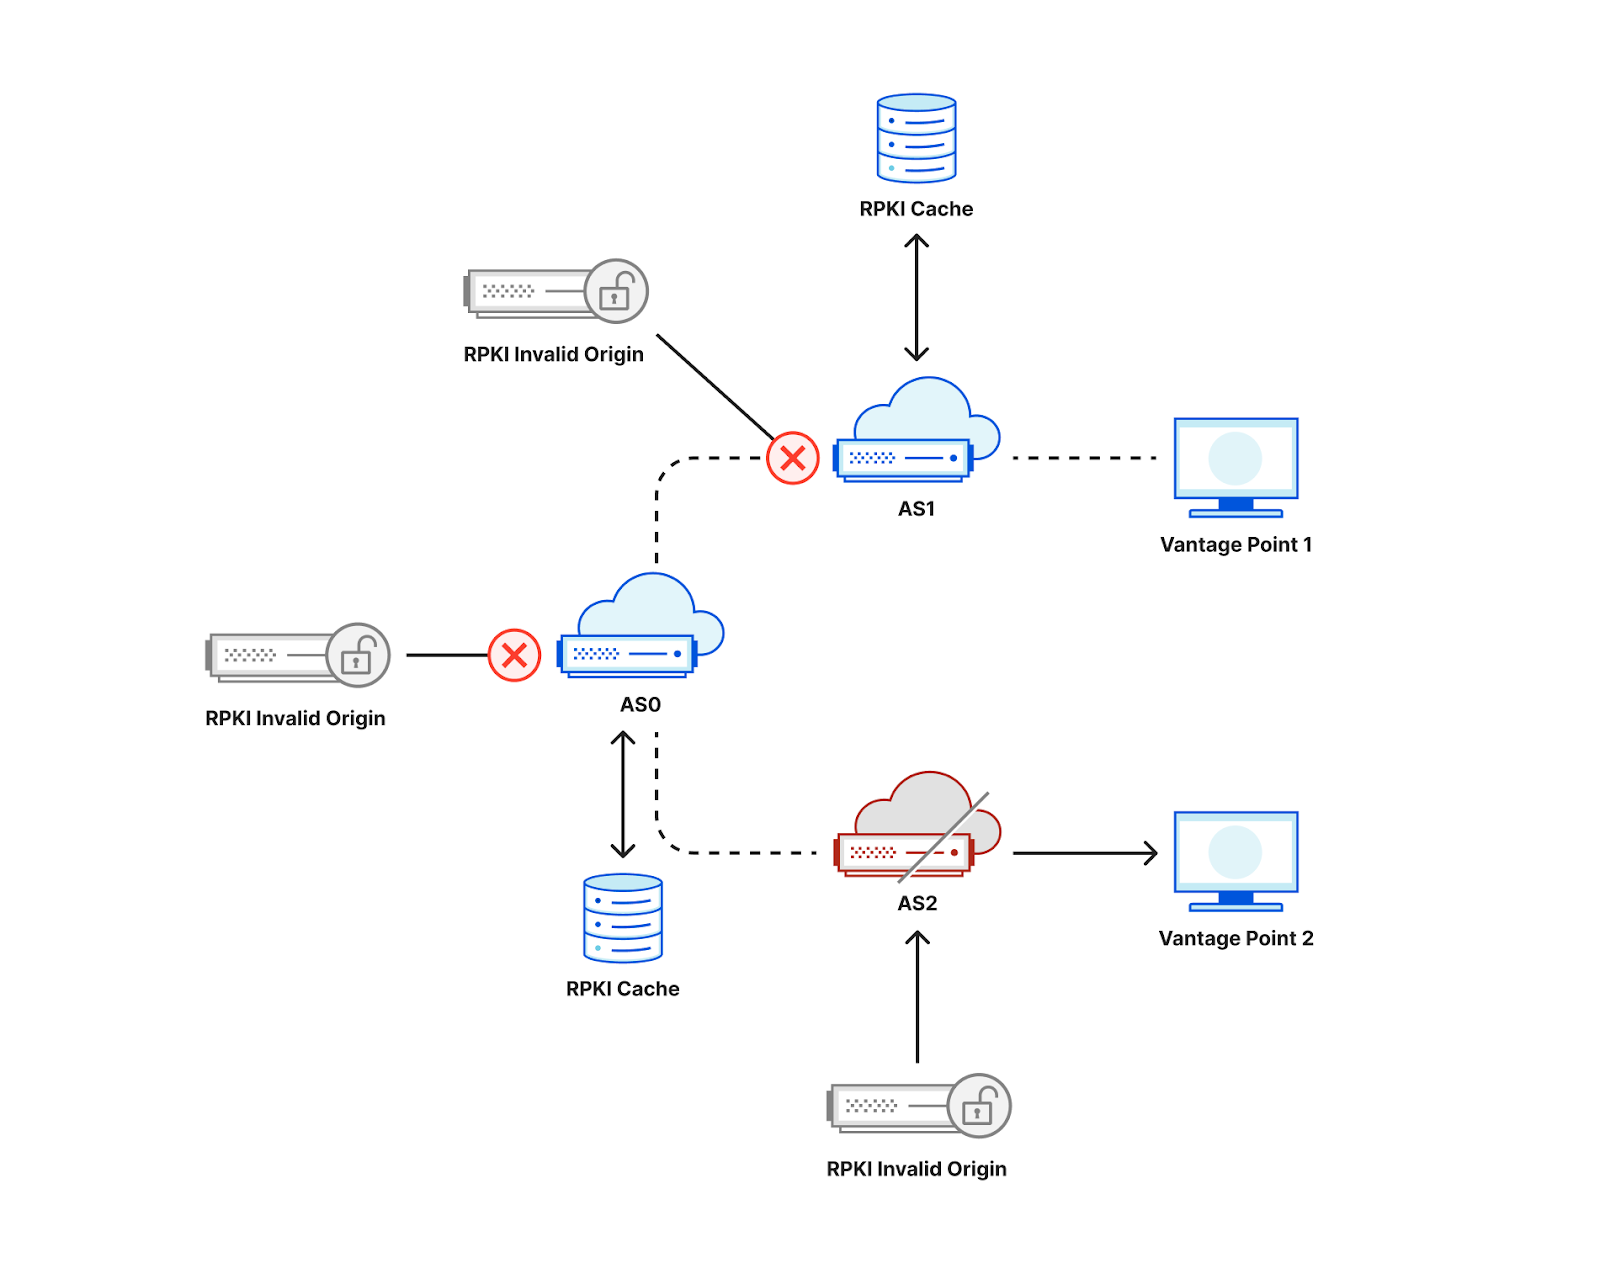
If, in the figure above, AS0 filters invalid RPKI routes, then vantage points in both AS1 and AS2 would be unable to connect to the RPKI-invalid origin, making it hard to distinguish if ROV is deployed at the ASes of our vantage points or in an AS along the path. One way to mitigate this limitation is to announce the RPKI-invalid origin from multiple locations from an anycast network taking advantage of its direct interconnections to the measurement vantage points as shown in the figure below. As a result, an AS that does not itself deploy ROV is less likely to observe the benefits of upstream ASes using ROV, and we would be able to accurately infer ROV deployment per AS3.

Note that it’s also important that the IP address of the RPKI-invalid origin should not be covered by a less specific prefix for which there is a valid or unknown RPKI route, otherwise even if an AS filters invalid RPKI routes its users would still be able to find a route to that IP.

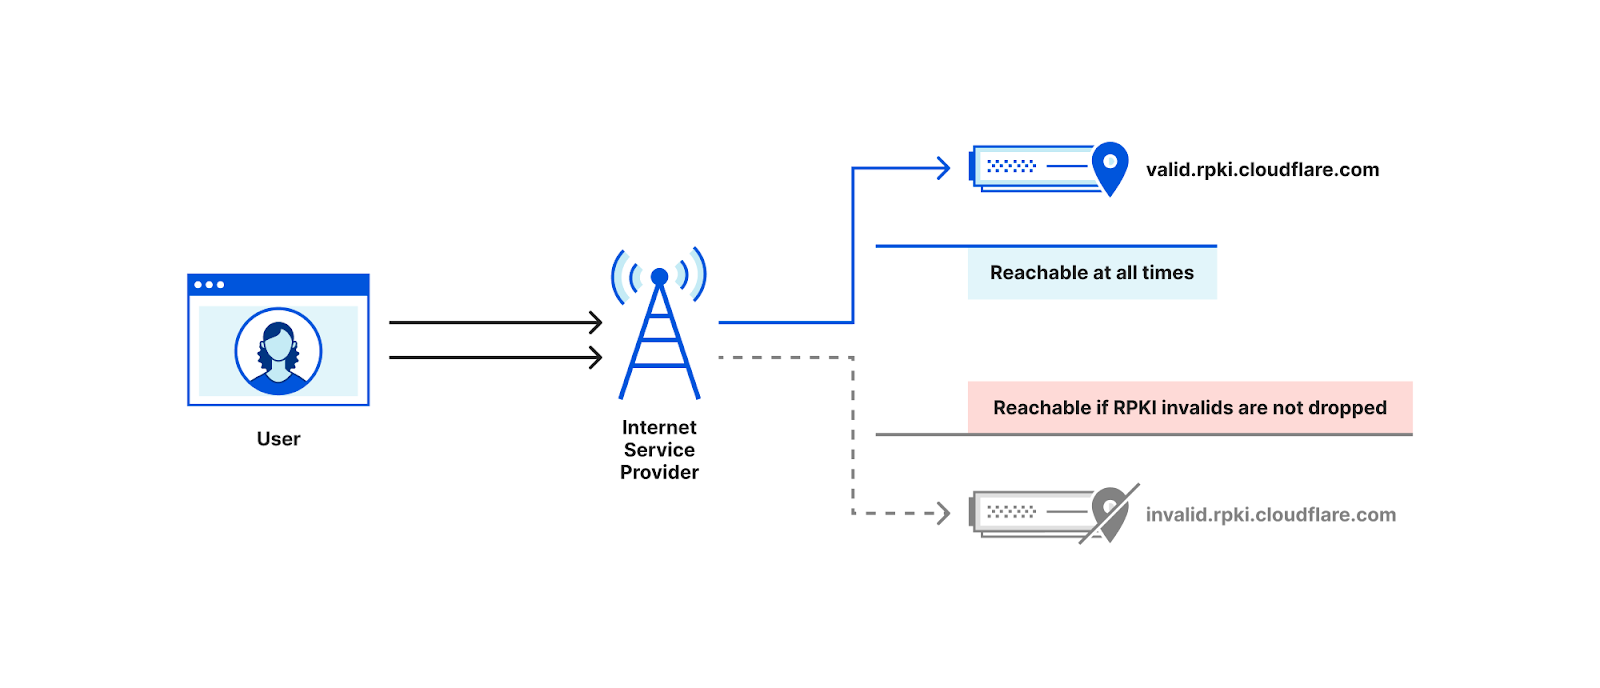
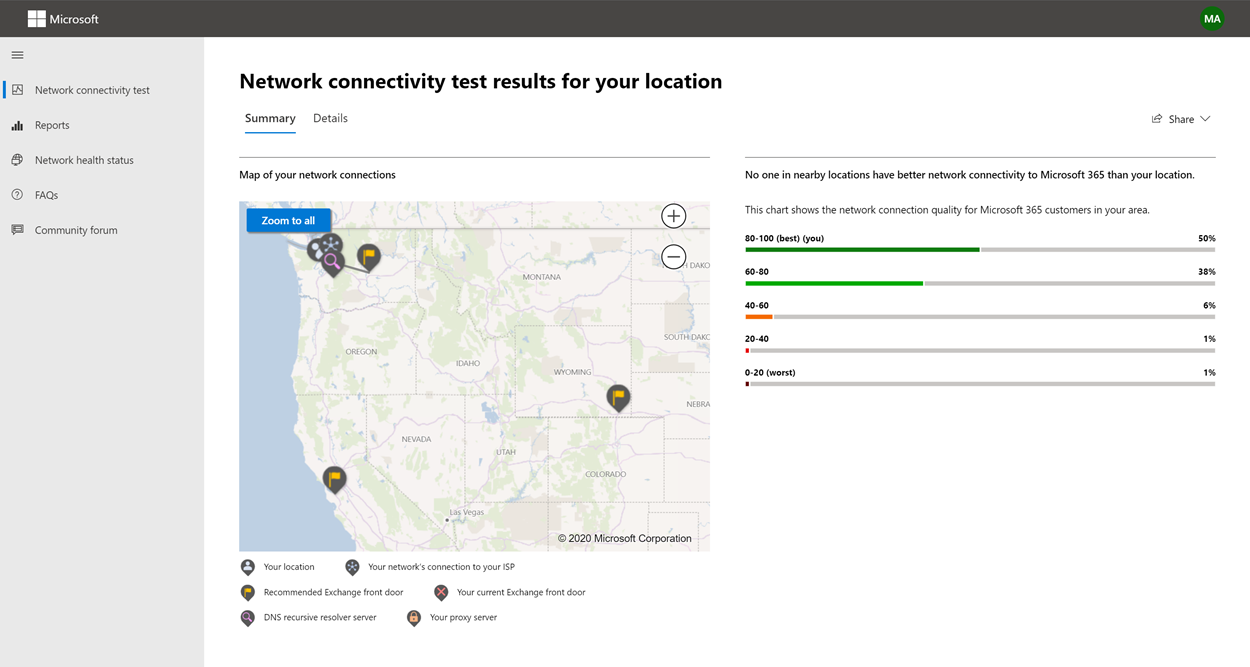
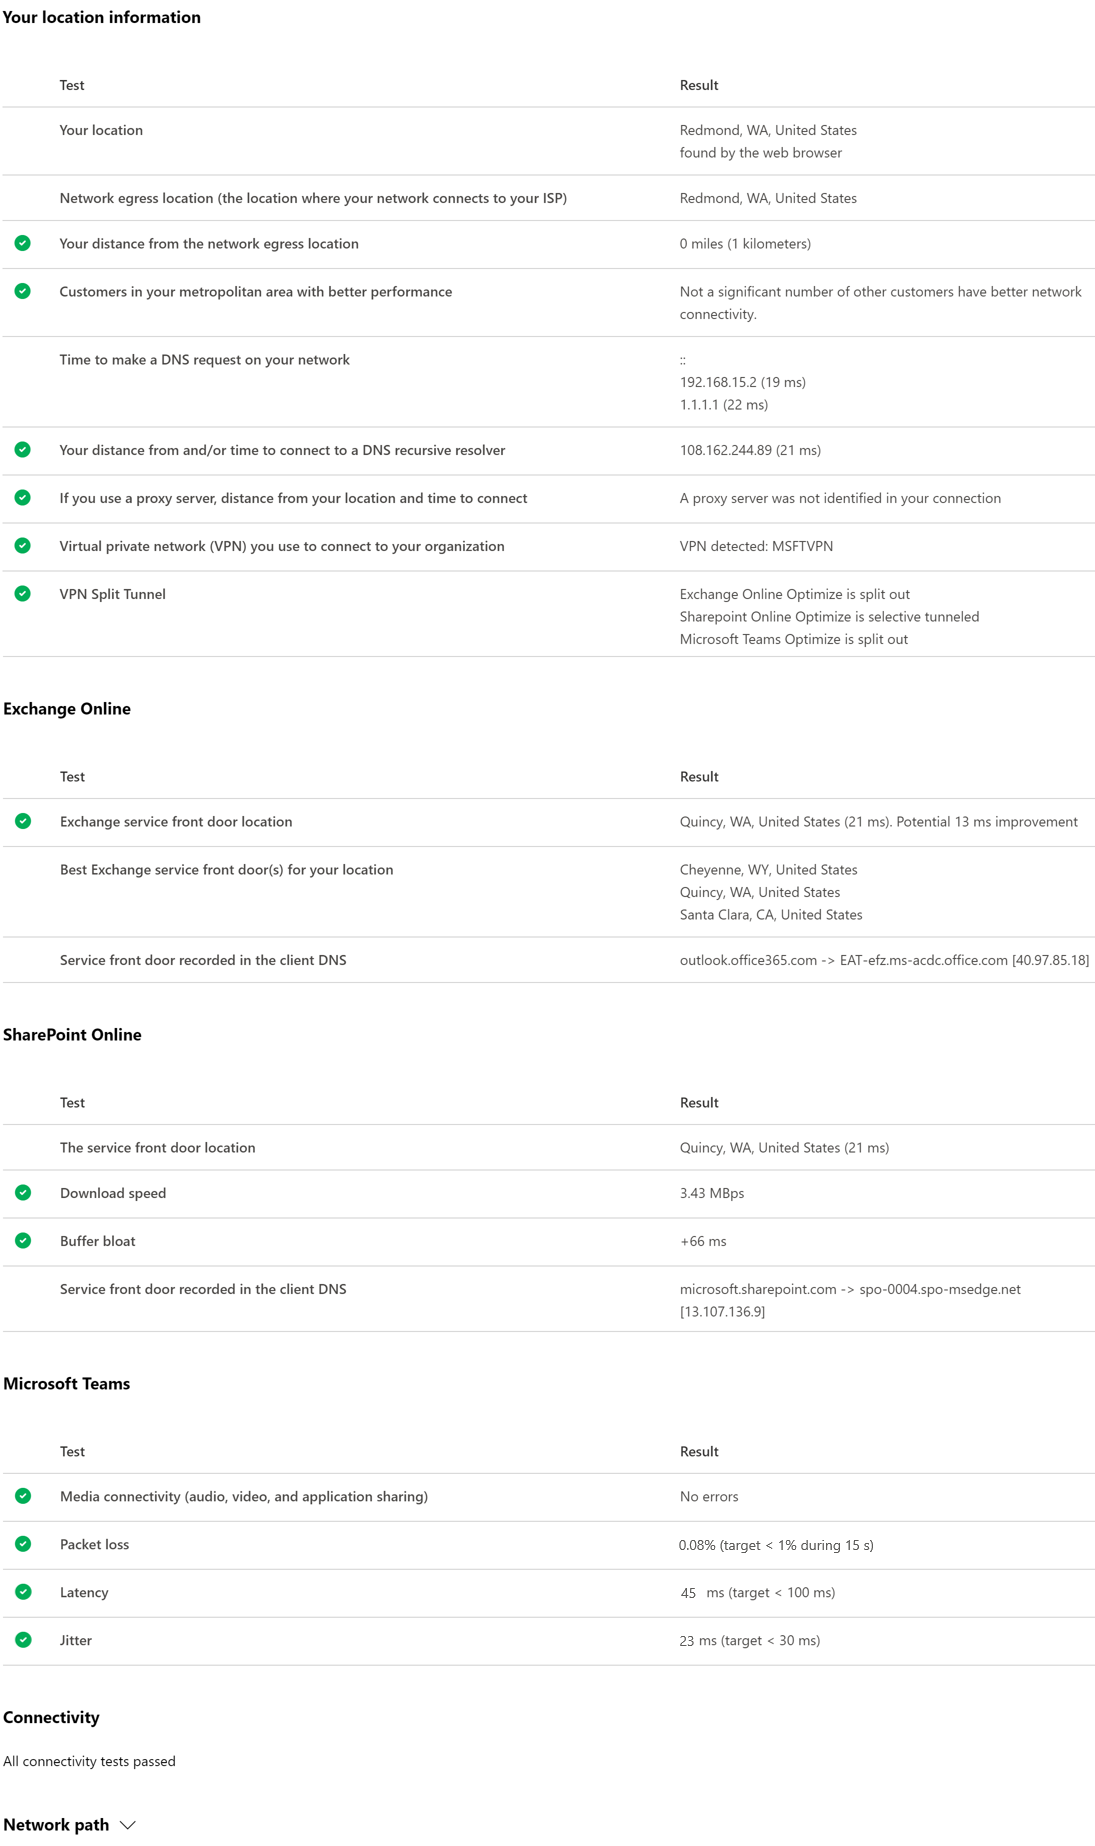
The measurement technique described here is the one implemented by Cloudflare’s isbgpsafeyet.com website, allowing end users to assess whether or not their ISPs have deployed BGP ROV.

The isbgpsafeyet.com website itself doesn’t submit any data back to Cloudflare, but recently we started measuring whether end users’ browsers can successfully connect to invalid RPKI origins when ROV is present. We use the same mechanism as is used for global performance data4. In particular, every measurement session (an individual end user at some point in time) attempts a request to both valid.rpki.cloudflare.com, which should always succeed as it’s RPKI-valid, and invalid.rpki.cloudflare.com, which is RPKI-invalid and should fail when the user’s ISP uses ROV.

This allows us to have continuous and up-to-date measurements from hundreds of thousands of browsers on a daily basis, and develop a greater understanding of the state of ROV deployment.

The state of global ROV deployment

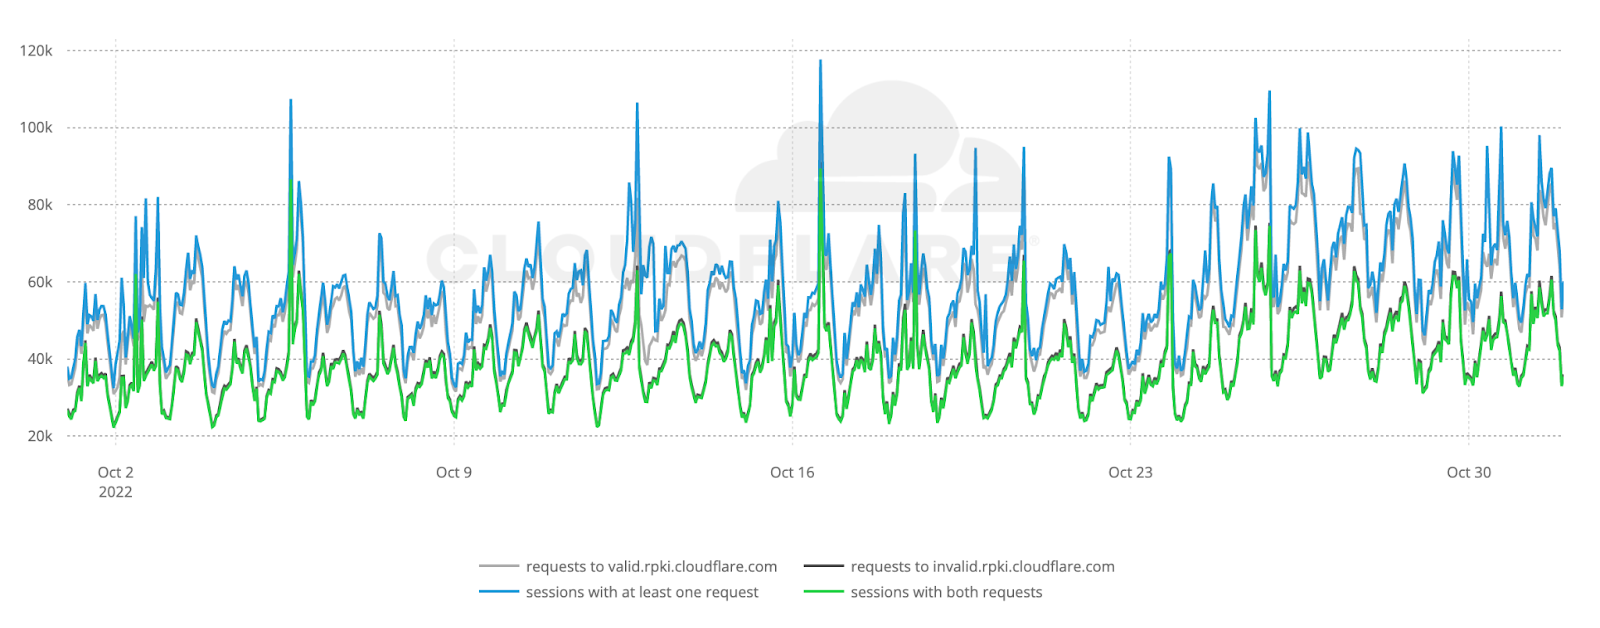
The figure below shows the raw number of ROV probe requests per hour during October 2022 to valid.rpki.cloudflare.com and invalid.rpki.cloudflare.com. In total, we observed 69.7 million successful probes from 41,531 ASNs.

Based on APNIC’s estimates on the number of end users per ASN, our weighted5 analysis covers 96.5% of the world’s Internet population. As expected, the number of requests follow a diurnal pattern which reflects established user behavior in daily and weekly Internet activity6.

We can also see that the number of successful requests to valid.rpki.cloudflare.com (gray line) closely follows the number of sessions that issued at least one request (blue line), which works as a smoke test for the correctness of our measurements.

As we don’t store the IP addresses that contribute measurements, we don’t have any way to count individual clients and large spikes in the data may introduce unwanted bias. We account for that by capturing those instants and excluding them.

Overall, we estimate that out of the four billion Internet users, only 261 million (6.5%) are protected by BGP Route Origin Validation, but the true state of global ROV deployment is more subtle than this.

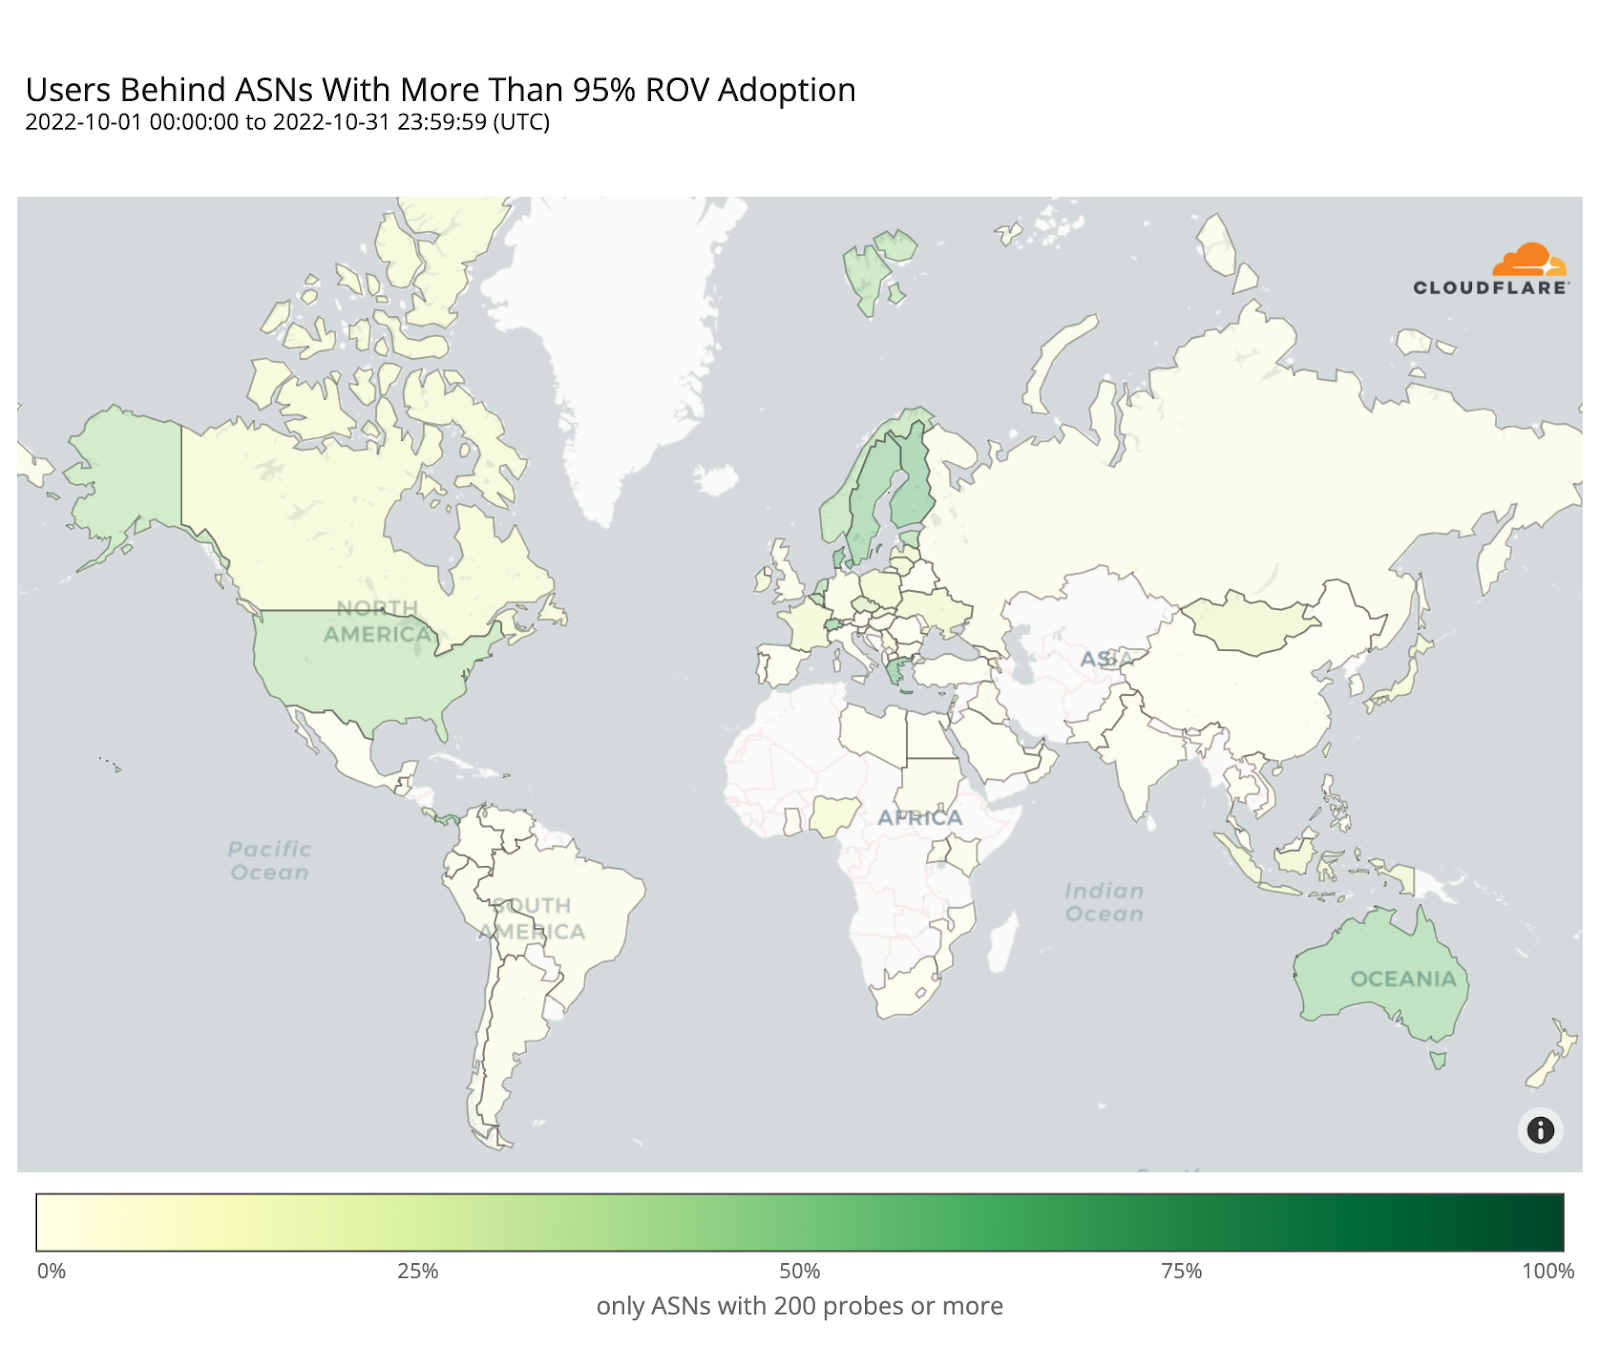
The following map shows the fraction of dropped RPKI-invalid requests from ASes with over 200 probes over the month of October. It depicts how far along each country is in adopting ROV but doesn’t necessarily represent the fraction of protected users in each country, as we will discover.

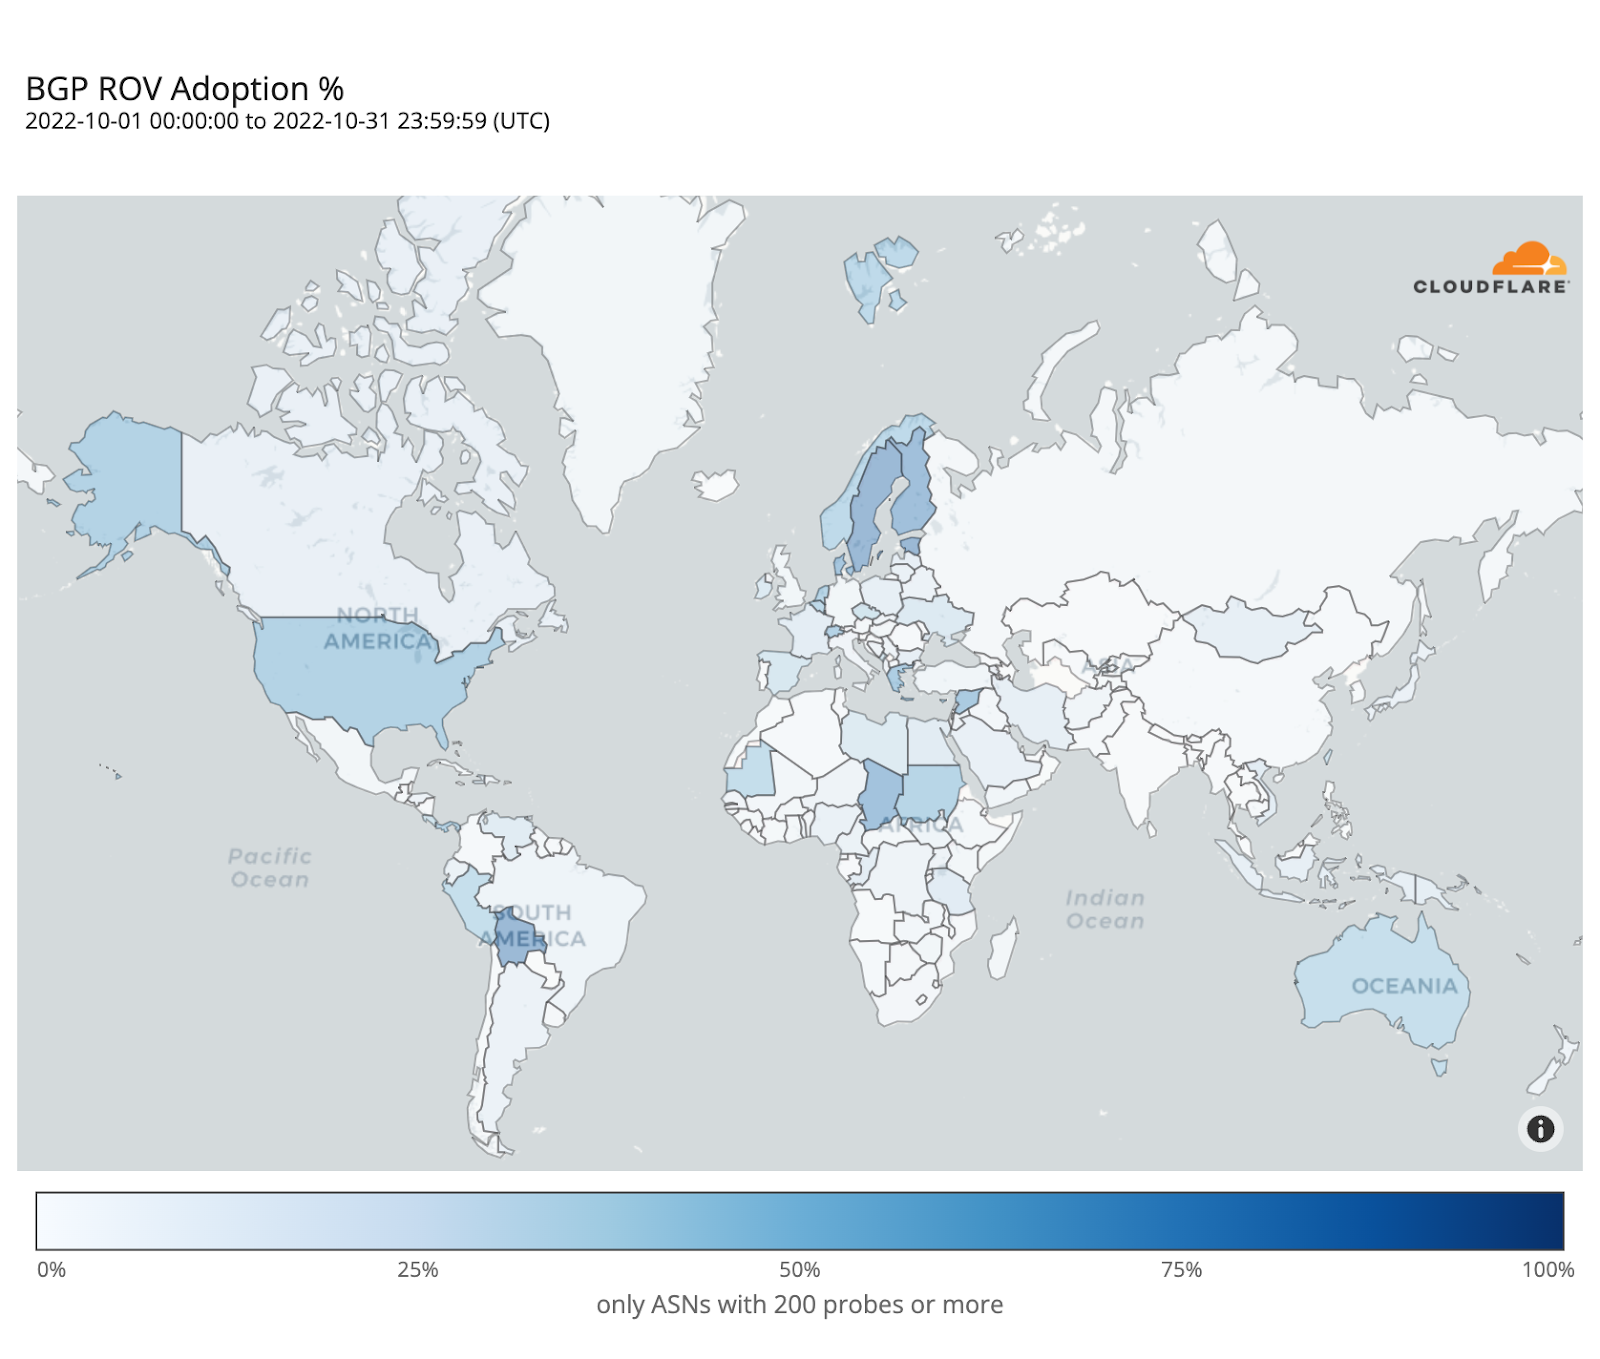
Sweden and Bolivia appear to be the countries with the highest level of adoption (over 80%), while only a few other countries have crossed the 50% mark (e.g. Finland, Denmark, Chad, Greece, the United States).

ROV adoption may be driven by a few ASes hosting large user populations, or by many ASes hosting small user populations. To understand such disparities, the map below plots the contrast between overall adoption in a country (as in the previous map) and median adoption over the individual ASes within that country. Countries with stronger reds have relatively few ASes deploying ROV with high impact, while countries with stronger blues have more ASes deploying ROV but with lower impact per AS.

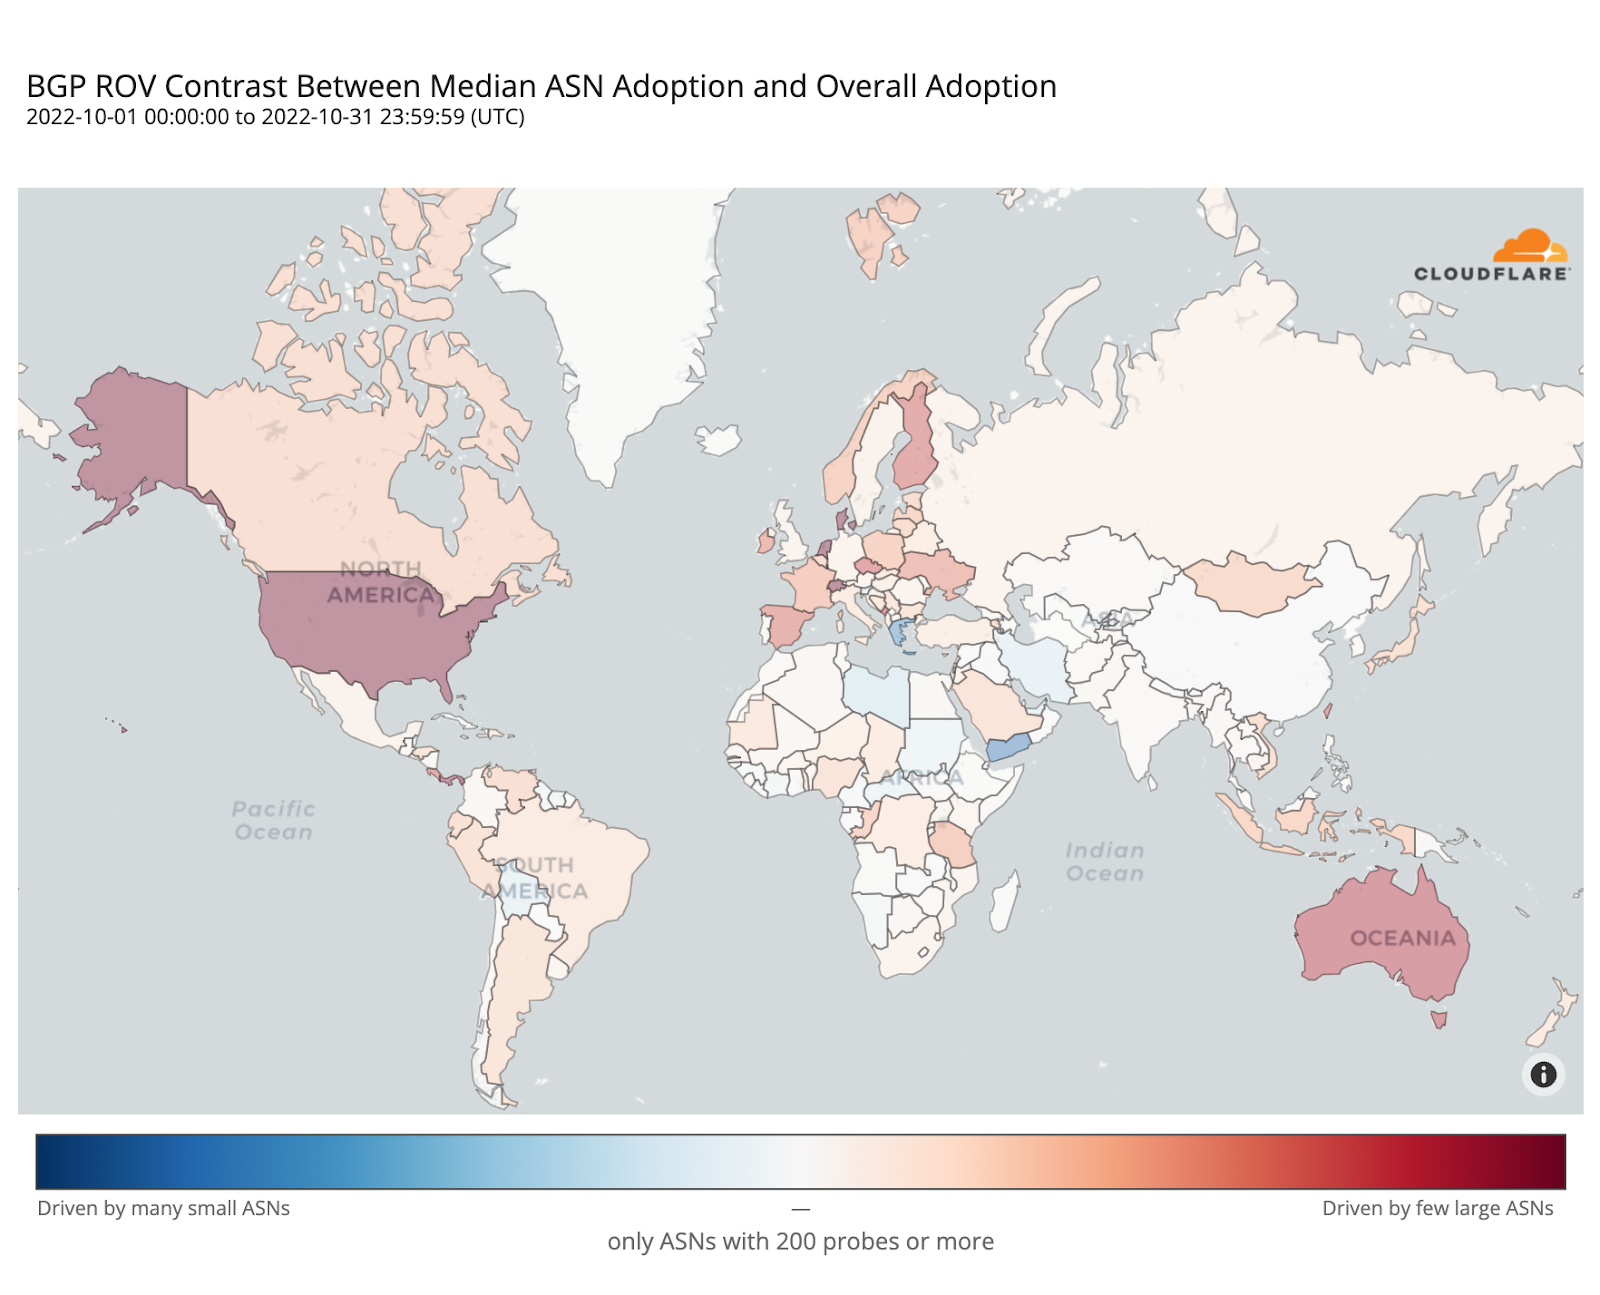
In the Netherlands, Denmark, Switzerland, or the United States, adoption appears mostly driven by their larger ASes, while in Greece or Yemen it’s the smaller ones that are adopting ROV.

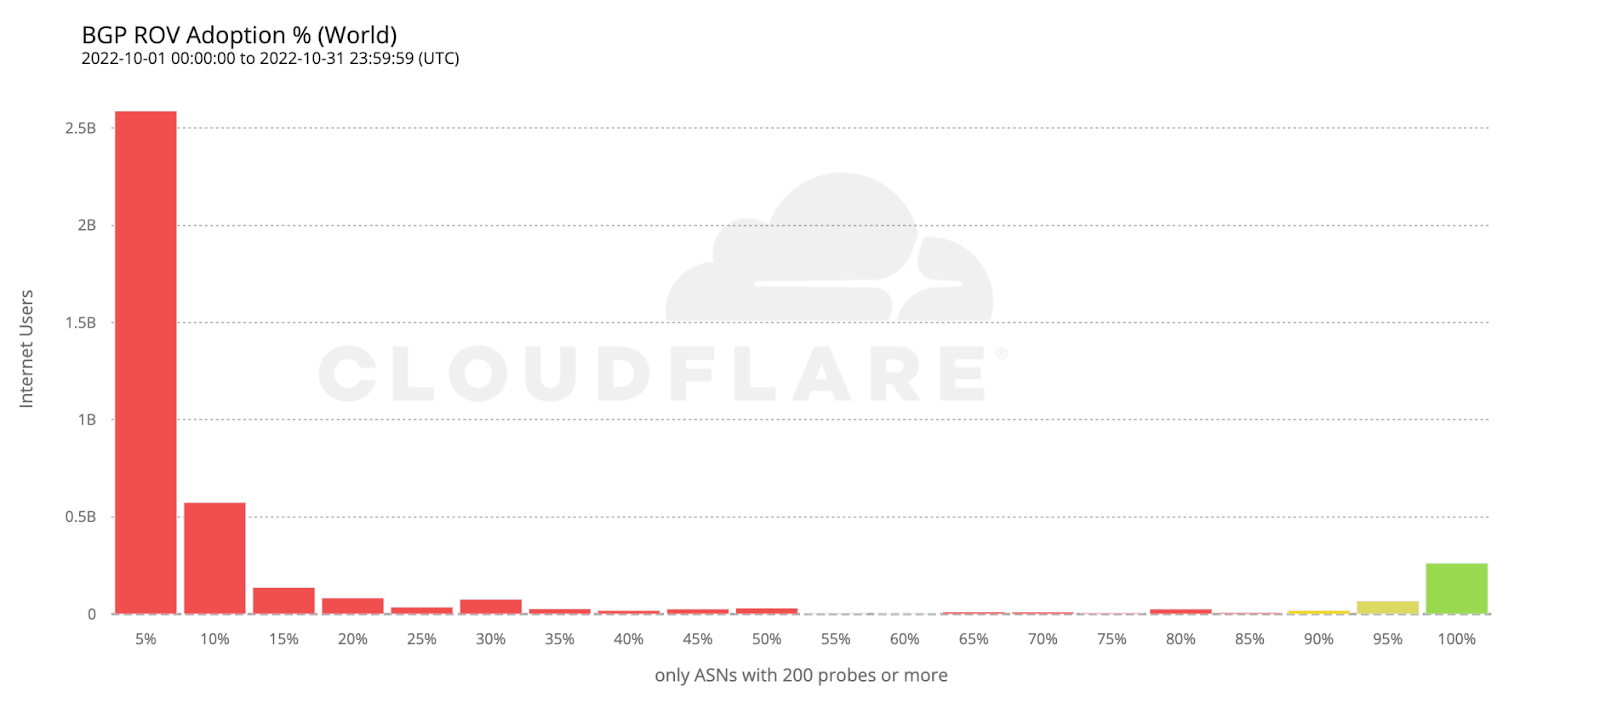
The following histogram summarizes the worldwide level of adoption for the 6,765 ASes covered by the previous two maps.

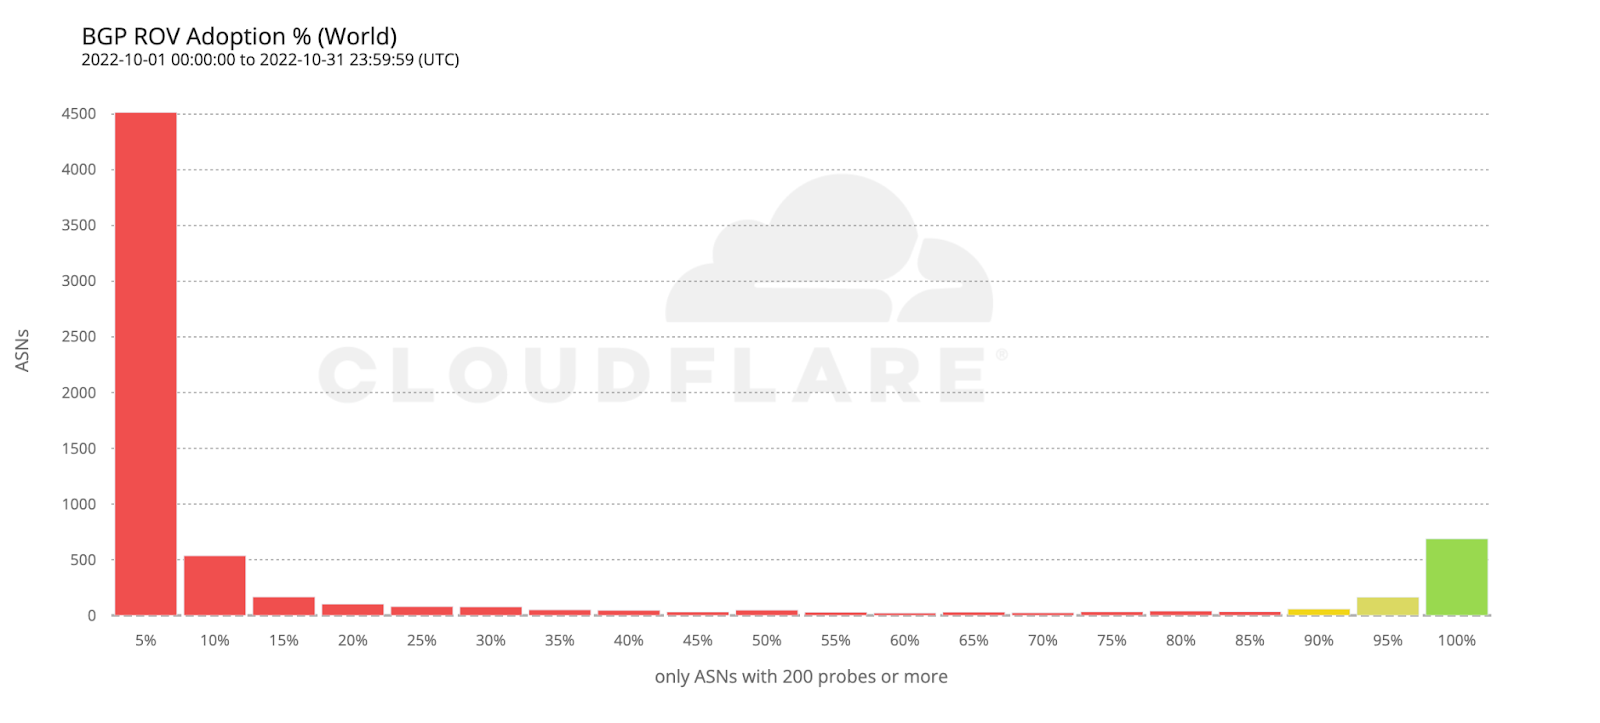
Most ASes either don’t validate at all, or have close to 100% adoption, which is what we’d intuitively expect. However, it’s interesting to observe that there are small numbers of ASes all across the scale. ASes that exhibit partial RPKI-invalid drop rate compared to total requests may either implement ROV partially (on some, but not all, of their BGP routers), or appear as dropping RPKI invalids due to ROV deployment by other ASes in their upstream path.

To estimate the number of users protected by ROV we only considered ASes with an observed adoption above 95%, as an AS with an incomplete deployment still leaves its users vulnerable to route leaks from its BGP peers.

If we take the previous histogram and summarize by the number of users behind each AS, the green bar on the right corresponds to the 261 million users currently protected by ROV according to the above criteria (686 ASes).

Looking back at the country adoption map one would perhaps expect the number of protected users to be larger. But worldwide ROV deployment is still mostly partial, lacking larger ASes, or both. This becomes even more clear when compared with the next map, plotting just the fraction of fully protected users.

To wrap up our analysis, we look at two world economies chosen for their contrasting, almost symmetrical, stages of deployment: the United States and the European Union.

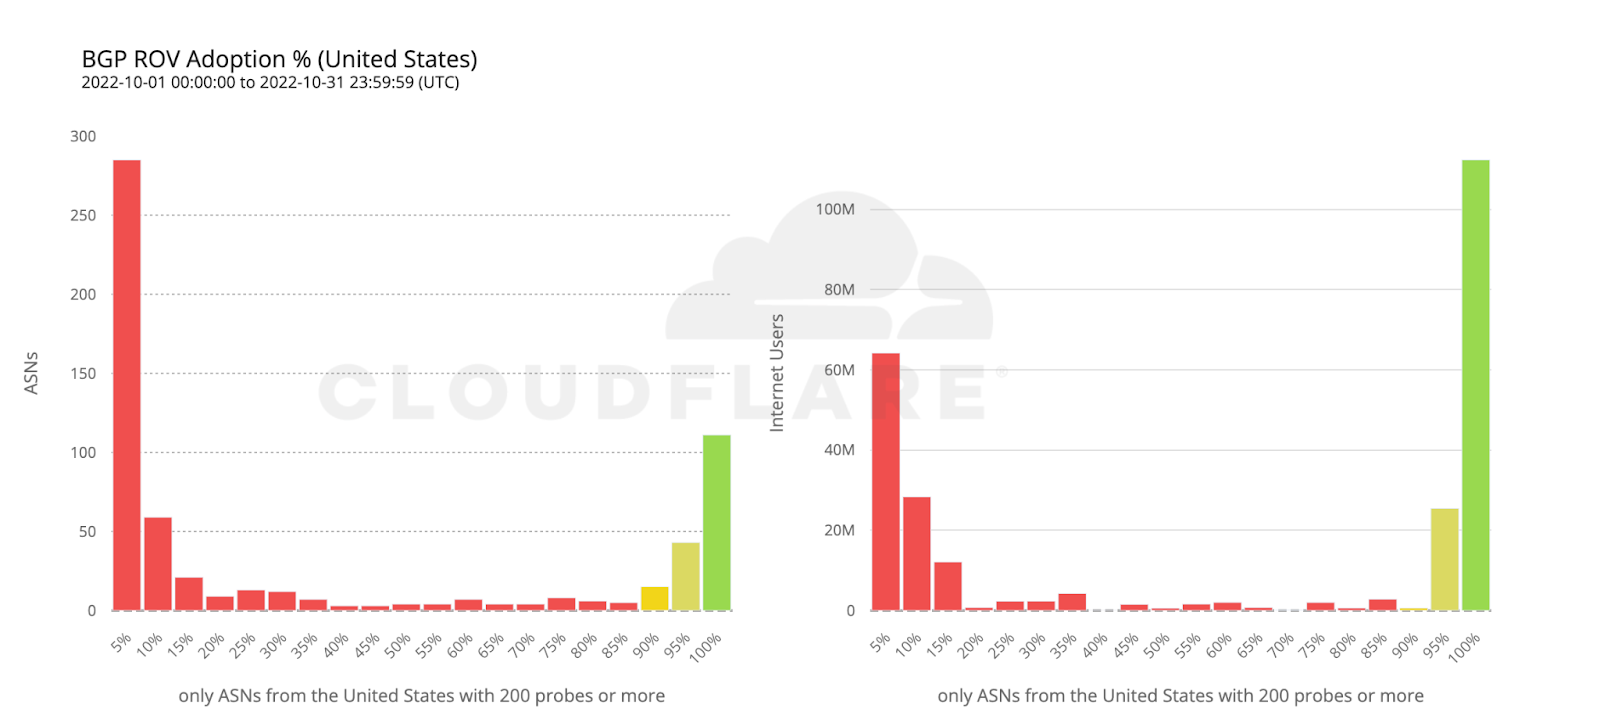
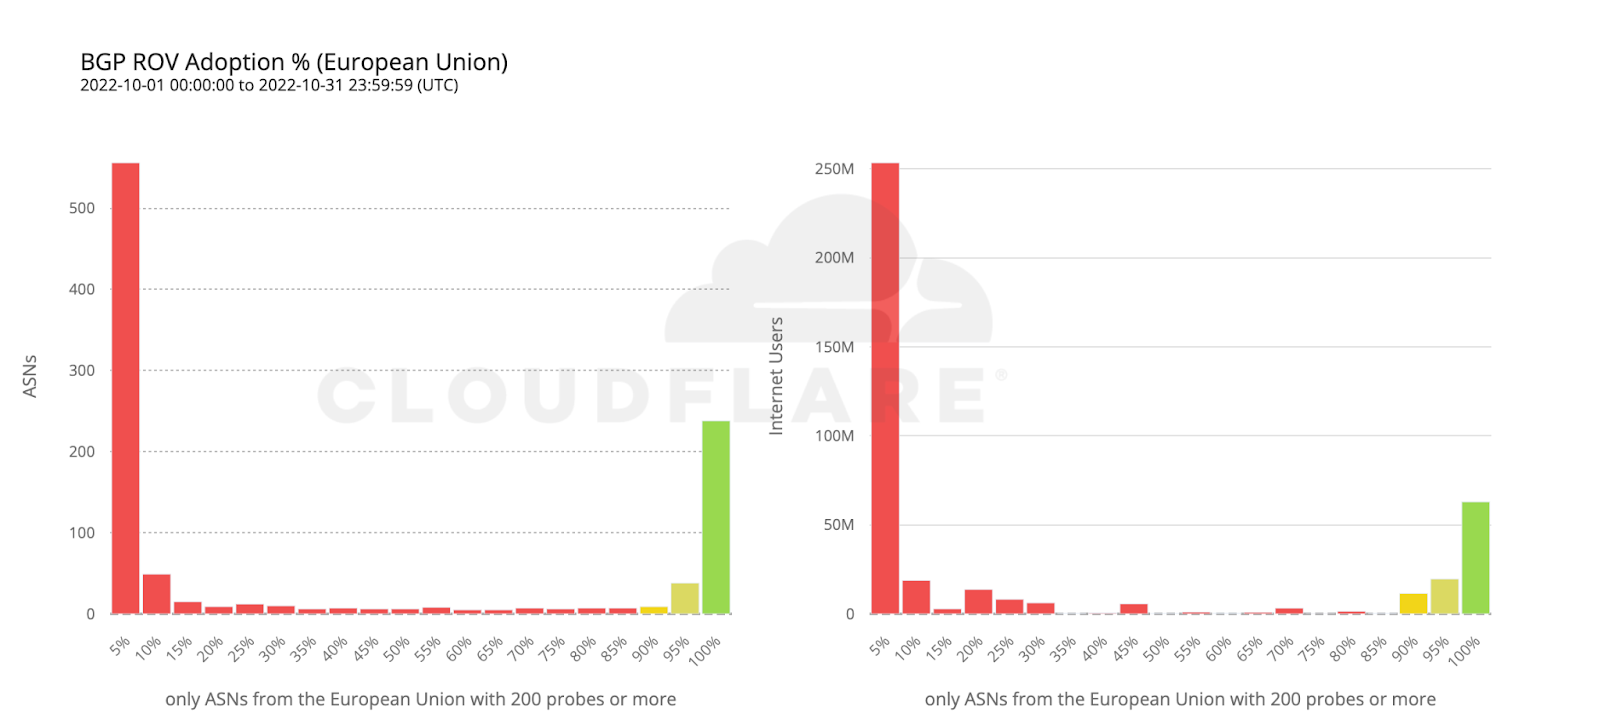
112 million Internet users are protected by 111 ASes from the United States with comprehensive ROV deployments. Conversely, more than twice as many ASes from countries making up the European Union have fully deployed ROV, but end up covering only half as many users. This can be reasonably explained by end user ASes being more likely to operate within a single country rather than span multiple countries.

Conclusion

Probe requests were performed from end user browsers and very few measurements were collected from transit providers (which have few end users, if any). Also, paths between end user ASes and Cloudflare are often very short (a nice outcome of our extensive peering) and don’t traverse upper-tier networks that they would otherwise use to reach the rest of the Internet.

In other words, the methodology used focuses on ROV adoption by end user networks (e.g. ISPs) and isn’t meant to reflect the eventual effect of indirect validation from (perhaps validating) upper-tier transit networks. While indirect validation may limit the “blast radius” of (malicious or accidental) route leaks, it still leaves non-validating ASes vulnerable to leaks coming from their peers.

As with indirect validation, an AS remains vulnerable until its ROV deployment reaches a sufficient level of completion. We chose to only consider AS deployments above 95% as truly comprehensive, and Cloudflare Radar will soon begin using this threshold to track ROV adoption worldwide, as part of our mission to help build a better Internet.

When considering only comprehensive ROV deployments, some countries such as Denmark, Greece, Switzerland, Sweden, or Australia, already show an effective coverage above 50% of their respective Internet populations, with others like the Netherlands or the United States slightly above 40%, mostly driven by few large ASes rather than many smaller ones.

Worldwide we observe a very low effective coverage of just 6.5% over the measured ASes, corresponding to 261 million end users currently safe from (malicious and accidental) route leaks, which means there’s still a long way to go before we can declare BGP to be safe.

……
1https://rpki.cloudflare.com/
2Gilad, Yossi, Avichai Cohen, Amir Herzberg, Michael Schapira, and Haya Shulman. “Are we there yet? On RPKI’s deployment and security.” Cryptology ePrint Archive (2016).
3Geoff Huston. “Measuring ROAs and ROV”. https://blog.apnic.net/2021/03/24/measuring-roas-and-rov/
4Measurements are issued stochastically when users encounter 1xxx error pages from default (non-customer) configurations.
5Probe requests are weighted by AS size as calculated from Cloudflare’s worldwide HTTP traffic.
6Quan, Lin, John Heidemann, and Yuri Pradkin. “When the Internet sleeps: Correlating diurnal networks with external factors.” In Proceedings of the 2014 Conference on Internet Measurement Conference, pp. 87-100. 2014.

We protect entire corporate networks, help customers build Internet-scale applications efficiently, accelerate any website or Internet applicationward off DDoS attacks, keep hackers at bay, and can help you on your journey to Zero Trust.

Visit 1.1.1.1 from any device to get started with our free app that makes your Internet faster and safer.

To learn more about our mission to help build a better Internet, start here. If you’re looking for a new career direction, check out our open positions.

Source :
https://blog.cloudflare.com/rpki-updates-data/

Microsoft 365 network connectivity test tool

The Microsoft 365 network connectivity test tool is located at https://connectivity.office.com. It’s an adjunct tool to the network assessment and network insights available in the Microsoft 365 admin center under the Health | Connectivity menu.

 Important

It’s important to sign in to your Microsoft 365 tenant as all test reports are shared with your administrator and uploaded to the tenant while you are signed in.

Connectivity test tool.

 Note

The network connectivity test tool supports tenants in WW Commercial but not GCC Moderate, GCC High, DoD or China.

Network insights in the Microsoft 365 Admin Center are based on regular in-product measurements for your Microsoft 365 tenant, aggregated each day. In comparison, network insights from the Microsoft 365 network connectivity test are run locally in the tool.

In-product testing is limited, and running tests local to the user collects more data resulting in deeper insights. Network insights in the Microsoft 365 Admin Center will show that there’s a networking problem at a specific office location. The Microsoft 365 connectivity test can help to identify the root cause of that problem and provide a targeted performance improvement action.

We recommend that these insights be used together where networking quality status can be assessed for each office location in the Microsoft 365 Admin Center and more specifics can be found after deployment of testing based on the Microsoft 365 connectivity test.

What happens at each test step

Office location identification

When you click the Run test button, we show the running test page and identify the office location. You can type in your location by city, state, and country or choose to have it detected for you. If you detect the office location, the tool requests the latitude and longitude from the web browser and limits the accuracy to 300 meters by 300 meters before use. It’s not necessary to identify the location more accurately than the building to measure network performance.

JavaScript tests

After office location identification, we run a TCP latency test in JavaScript and we request data from the service about in-use and recommended Microsoft 365 service front door servers. When these tests are completed, we show them on the map and in the details tab where they can be viewed before the next step.

Download the advanced tests client application

Next, we start the download of the advanced tests client application. We rely on the user to launch the client application and they must also have .NET 6.0 Runtime installed.

There are two parts to the Microsoft 365 network connectivity test: the web site https://connectivity.office.com and a downloadable Windows client application that runs advanced network connectivity tests. Most of the tests require the application to be run. It will populate results back into the web page as it runs.

You’ll be prompted to download the advanced client test application from the web site after the web browser tests have completed. Open and run the file when prompted.

Advanced tests client application.

Start the advanced tests client application

Once the client application starts, the web page will update to show this result. Test data will start to be received to the web page. The page updates each time new-data is received and you can review the data as it arrives.

Advanced tests completed and test report upload

When the tests are completed, the web page and the advanced tests client will both show that. If the user is signed in, the test report will be uploaded to the customer’s tenant.

Sharing your test report

The test report requires authentication to your Microsoft 365 account. Your administrator selects how you can share your test report. The default settings allow for sharing of your reports with other user within your organization and the ReportID link is not available. Reports will expire by default after 90 days.

Sharing your report with your administrator

If you’re signed in when a test report occurs, the report is shared with your administrator.

Sharing with your Microsoft account team, support or other personnel

Test reports (excluding any personal identification) are shared with Microsoft employees. This sharing is enabled by default and can be disabled by your administrator in the Health | Network Connectivity page in the Microsoft 365 Admin Center.

Sharing with other users who sign in to the same Microsoft 365 tenant

You can choose users to share your report with. Being able to choose is enabled by default, but it can be disabled by your administrator.

Sharing a link to your test results with a user.

You can share your test report with anyone by providing access to a ReportID link. This link generates a URL that you can send to someone so that they can bring up the test report without signing in. This sharing is disabled by default and must be enabled by your administrator.

Sharing a link to your test results.

Network Connectivity Test Results

The results are shown in the Summary and Details tabs. The summary tab shows a map of the detected network perimeter and a comparison of the network assessment to other Microsoft 365 customers nearby. It also allows for sharing of the test report. Here’s what the summary results view looks like:

Network connectivity test tool summary results.

Here’s an example of the details tab output. On the details tab we show a green circle check mark if the result was compared favorably. We show a red triangle exclamation point if the result exceeded a threshold indicating a network insight. The following sections describe each of the details tab results rows and explain the thresholds used for network insights.

Network connectivity test tool example test results.

Your location information

This section shows test results related to your location.

Your location

The user location is detected from the users web browser. It can also be typed in at the user’s choice. It’s used to identify network distances to specific parts of the enterprise network perimeter. Only the city from this location detection and the distance to other network points are saved in the report.

The user office location is shown on the map view.

Network egress location (the location where your network connects to your ISP)

We identify the network egress IP address on the server side. Location databases are used to look up the approximate location for the network egress. These databases typically have an accuracy of about 90% of IP addresses. If the location looked up from the network egress IP address isn’t accurate, this would lead to a false result. To validate if this error is occurring for a specific IP address, you can use publicly accessible network IP address location web sites to compare against your actual location.

Your distance from the network egress location

We determine the distance from that location to the office location. This is shown as a network insight if the distance is greater than 500 miles (800 kilometers) since that is likely to increase the TCP latency by more than 25 ms and may affect user experience.

The map shows the network egress location in relation to the user office location indicating the network backhaul inside of the enterprise WAN.

Implement local and direct network egress from user office locations to the Internet for optimal Microsoft 365 network connectivity. Improvements to local and direct egress are the best way to address this network insight.

Proxy server information

We identify whether proxy server(s) are configured on the local machine to pass Microsoft 365 network traffic in the Optimize category. We identify the distance from the user office location to the proxy servers.

The distance is tested first by ICMP ping. If that fails, we test with TCP ping and finally we look up the proxy server IP address in an IP address location database. We show a network insight if the proxy server is further than 500 miles (800 kilometers) away from the user office location.

Virtual private network (VPN) you use to connect to your organization

This test detects if you’re using a VPN to connect to Microsoft 365. A passing result will show if you have no VPN, or if you have a VPN with recommended split tunnel configuration for Microsoft 365.

VPN Split Tunnel

Each Optimize category route for Exchange Online, SharePoint Online, and Microsoft Teams is tested to see if It’s tunneled on the VPN. A split out workload avoids the VPN entirely. A tunneled workload is sent over the VPN. A selective tunneled workload has some routes sent over the VPN and some split out. A passing result will show if all workloads are split out or selective tunneled.

Customers in your metropolitan area with better performance

Network latency between the user office location and the Exchange Online service is compared to other Microsoft 365 customers in the same metro area. A network insight is shown if 10% or more of customers in the same metro area have better performance. This means their users will have better performance in the Microsoft 365 user interface.

This network insight is generated on the basis that all users in a city have access to the same telecommunications infrastructure and the same proximity to Internet circuits and Microsoft’s network.

Time to make a DNS request on your network

This shows the DNS server configured on the client machine that ran the tests. It might be a DNS Recursive Resolver server however this is uncommon. It’s more likely to be a DNS forwarder server, which caches DNS results and forwards any uncached DNS requests to another DNS server.

This is provided for information only and does not contribute to any network insight.

Your distance from and/or time to connect to a DNS recursive resolver

The in-use DNS Recursive Resolver is identified by making a specific DNS request and then asking the DNS Name Server for the IP Address that it received the same request from. This IP Address is the DNS Recursive Resolver and it will be looked up in IP Address location databases to find the location. The distance from the user office location to the DNS Recursive Resolver server location is then calculated. This is shown as a network insight if the distance is greater than 500 miles (800 kilometers).

The location looked up from the network egress IP Address may not be accurate and this would lead to a false result from this test. To validate if this error is occurring for a specific IP Address, you can use publicly accessible network IP Address location web sites.

This network insight will specifically impact the selection of the Exchange Online service front door. To address this insight local and direct network egress should be a pre-requisite and then DNS Recursive Resolver should be located close to that network egress.

Exchange Online

This section shows test results related to Exchange Online.

Exchange service front door location

The in-use Exchange service front door is identified in the same way that Outlook does this and we measure the network TCP latency from the user location to it. The TCP latency is shown and the in-use Exchange service front door is compared to the list of best service front doors for the current location. This is shown as a network insight if one of the best Exchange service front door(s) isn’t in use.

Not using one of the best Exchange service front door(s) could be caused by network backhaul before the corporate network egress in which case we recommend local and direct network egress. It could also be caused by use of a remote DNS recursive resolver server in which case we recommend aligning the DNS recursive resolver server with the network egress.

We calculate a potential improvement in TCP latency (ms) to the Exchange service front door. This is done by looking at the tested user office location network latency and subtracting the network latency from the current location to the closets Exchange service front door. The difference represents the potential opportunity for improvement.

Best Exchange service front door(s) for your location

This lists the best Exchange service front door locations by city for your location.

Service front door recorded in the client DNS

This shows the DNS name and IP Address of the Exchange service front door server that you were directed to. It’s provided for information only and there’s no associated network insight.

SharePoint Online

This section shows test results related to SharePoint Online and OneDrive.

The service front door location

The in-use SharePoint service front door is identified in the same way that the OneDrive client does and we measure the network TCP latency from the user office location to it.

Download speed

We measure the download speed for a 15 Mb file from the SharePoint service front door. The result is shown in megabytes per second to indicate what size file in megabytes can be downloaded from SharePoint or OneDrive in one second. The number should be similar to one tenth of the minimum circuit bandwidth in megabits per second. For example if you have a 100mbps internet connection, you may expect 10 megabytes per second (10 MBps).

Buffer bloat

During the 15Mb download we measure the TCP latency to the SharePoint service front door. This is the latency under load and it’s compared to the latency when not under load. The increase in latency when under load is often attributable to consumer network device buffers being loaded (or bloated). A network insight is shown for any bloat of 100ms or more.

Service front door recorded in the client DNS

This shows the DNS name and IP Address of the SharePoint service front door server that you were directed to. It’s provided for information only and there’s no associated network insight.

Microsoft Teams

This section shows test results related to Microsoft Teams.

Media connectivity (audio, video, and application sharing)

This tests for UDP connectivity to the Microsoft Teams service front door. If this is blocked, then Microsoft Teams may still work using TCP, but audio and video will be impaired. Read more about these UDP network measurements, which also apply to Microsoft Teams at Media Quality and Network Connectivity Performance in Skype for Business Online.

Packet loss

Shows the UDP packet loss measured in a 10-second test audio call from the client to the Microsoft Teams service front door. This should be lower than 1.00% for a pass.

Latency

Shows the measured UDP latency, which should be lower than 100ms.

Jitter

Shows the measured UDP jitter, which should be lower than 30ms.

Connectivity

We test for HTTP connectivity from the user office location to all of the required Microsoft 365 network endpoints. These are published at https://aka.ms/o365ip. A network insight is shown for any required network endpoints, which cannot be connected to.

Connectivity may be blocked by a proxy server, a firewall, or another network security device on the enterprise network perimeter. Connectivity to TCP port 80 is tested with an HTTP request and connectivity to TCP port 443 is tested with an HTTPS request. If there’s no response the FQDN is marked as a failure. If there’s an HTTP response code 407 the FQDN is marked as a failure. If there’s an HTTP response code 403 then we check the Server attribute of the response and if it appears to be a proxy server we mark this as a failure. You can simulate the tests we perform with the Windows command-line tool curl.exe.

We test the SSL certificate at each required Microsoft 365 network endpoint that is in the optimize or allow category as defined at https://aka.ms/o365ip. If any tests do not find a Microsoft SSL certificate, then the encrypted network connected must have been intercepted by an intermediary network device. A network insight is shown on any intercepted encrypted network endpoints.

Where an SSL certificate is found that isn’t provided by Microsoft, we show the FQDN for the test and the in-use SSL certificate owner. This SSL certificate owner may be a proxy server vendor, or it may be an enterprise self-signed certificate.

Network path

This section shows the results of an ICMP traceroute to the Exchange Online service front door, the SharePoint Online service front door, and the Microsoft Teams service front door. It’s provided for information only and there’s no associated network insight. There are three traceroutes provided. A traceroute to outlook.office365.com, a traceroute to the customers SharePoint front end or to microsoft.sharepoint.com if one was not provided, and a traceroute to world.tr.teams.microsoft.com.

Connectivity reports

When you are signed in you can review previous reports that you have run. You can also share them or delete them from the list.

Reports.

Network health status

This shows any significant health issues with Microsoft’s global network, which might impact Microsoft 365 customers.

Network health status.

Testing from the Command Line

We provide a command line executable that can be used by your remote deployment and execution tools and run the same tests as are available in the Microsoft 365 network connectivity test tool web site.

The command line test tool can be downloaded here: Command Line Tool

You can run it by double clicking the executable in Windows File Explorer, or you can start it from a command prompt, or you can schedule it with task scheduler.

The first time you launch the executable you will be prompted to accept the end user license agreement (EULA) before testing is performed. If you have already read and accepted the EULA you can create an empty file called Microsoft-365-Network-Connectivity-Test-EULA-accepted.txt in the current working directory for the executable process when it is launched. To accept the EULA you can type ‘y’ and press enter in the command line window when prompted.

The executable accepts the following command line parameters:

  • -h to show a link to this help documentation
  • -testlist <test> Specifies tests to run. By default only basic tests are run. Valid test names include: all, dnsConnectivityPerf, dnsResolverIdentification, bufferBloat, traceroute, proxy, vpn, skype, connectivity, networkInterface
  • -filepath <filedir> Directory path of test result files. Allowed value is absolute or relative path of an accessible directory
  • -city <city> For the city, state, and country fields the specified value will be used if provided. If not provided then Windows Location Services (WLS) will be queried. If WLS fails the location will be detected fromthe machines network egress
  • -state <state>
  • -country <country>
  • -proxy <account> <password> Proxy account name and password can be provided if you require a proxy to access the Internet

Results

Output of results are written to a JSON file in a folder called TestResults which is created in the current working directory of the process unless it already exists. The filename format for the output is connectivity_test_result_YYYY-MM-DD-HH-MM-SS.json. The results are in JSON nodes that match the output shown on the web page for the Microsoft 365 network connectivity test tool web site. A new result file is created each time you run it and the standalone executable does not upload results to your Microsoft tenant for viewing in the Admin Center Network Connectivity pages. Front door codes, longitudes, and latitudes are not included in the result file.

Launching from Windows File Explorer

You can simply double click on the executable to start the testing and a command prompt window will appear.

Launching from the Command Prompt

On a CMD.EXE command prompt window you can type the path and name of the executable to run it. The filename is Microsoft.Connectivity.Test.exe

Launching from Windows Task Scheduler

In Windows Task Scheduler you can add a task to launch the standalone test executable. You should specify the current working directory of the task to be where you have created the EULA accepted file since the executable will block until the EULA is accepted. You cannot interactively accept the EULA if the process is started in the background with no console.

More details on the standalone executable

The commandline tool uses Windows Location Services to find the users City State Country information for determining some distances. If Windows Location Services is disabled in the control panel then user location based assessments will be blank. In Windows Settings “Location services” must be on and “Let desktop apps access your location” must also be on.

The commandline tool will attempt to install the .NET Framework if it is not already installed. It will also download the main testing executable from the Microsoft 365 network connectivity test tool and launch that.

Test using the Microsoft Support and Recovery Assistant

Microsoft Support and Recovery Assistant (Assistant) automates all the steps required to execute the command-line version of the Microsoft 365 network connectivity test tool on a user’s machine and creates a report similar to the one created by the web version of the connectivity test tool. Note, the Assistant runs the command line version of Microsoft 365 network connectivity test tool to produce the same JSON result file, but the JSON file is converted into .CSV file format.

Download and Run the Assistant Here

Viewing Test Results

Reports can be accessed in the following ways:

The reports will be available on the below screen once the Assistant has finished scanning the user’s machine. To access these reports, simply click on the “View log” option to view them.

Microsoft Support and Recovery Assistant wizard.

Connectivity test results and Telemetry data are collected and uploaded to the uploadlogs folder. To access this folder, use one of the following methods:

  • Open Run (Windows logo key + R), and run the %localappdata%/saralogs/uploadlogs command as follows:
Run dialog for locating output.
  • In File Explorer, type C:\Users<UserName>\AppData\Local\saralogs\uploadlogs and press Enter as follows:
Windows Explorer Address Bar for output.

Note: <UserName> is the user’s Windows profile name. To view the information about the test results and telemetry, double-click and open the files.

Windows Explorer SARA Output Files.

Types of result files

Microsoft Support and Recovery Assistant creates 2 files:

  1. Network Connectivity Report (CSV) This report runs the raw JSON file against a rule engine to make sure defined thresholds are being met and if they are not met a “warning” or “error” is displayed in the output column of the CSV file. You can view the NetworkConnectivityReport.csv file to be informed about any detected issues or defects. Please see What happens at each test step for details on each test and the thresholds for warnings.
  2. Network Connectivity Scan Report (JSON) This file provides the raw output test results from the command-line version of the Microsoft 365 network connectivity test tool (MicrosoftConnectivityTest.exe).

FAQ

Here are answers to some of our frequently asked questions.

What is required to run the advanced test client?

The advanced test client requires .NET 6.0 Runtime. If you run the advanced test client without that installed you will be directed to the .NET 6.0 installer page. Be sure to install from the Run desktop apps column for Windows. Administrator permissions on the machine are required to install .NET 6.0 Runtime.

The advanced test client uses SignalR to communicate to the web page. For this you must ensure that TCP port 443 connectivity to connectivity.service.signalr.net is open. This URL isn’t published in the https://aka.ms/o365ip because that connectivity isn’t required for a Microsoft 365 client application user.

What is Microsoft 365 service front door?

The Microsoft 365 service front door is an entry point on Microsoft’s global network where Office clients and services terminate their network connection. For an optimal network connection to Microsoft 365, It’s recommended that your network connection is terminated into the closest Microsoft 365 front door in your city or metro.

 Note

Microsoft 365 service front door has no direct relationship to the Azure Front Door Service product available in the Azure marketplace.

What is the best Microsoft 365 service front door?

A best Microsoft 365 service front door (formerly known as an optimal service front door) is one that is closest to your network egress, generally in your city or metro area. Use the Microsoft 365 network performance tool to determine location of your in-use Microsoft 365 service front door and the best service front door(s). If the tool determines your in-use front door is one of the best ones, then you should expect great connectivity into Microsoft’s global network.

What is an internet egress location?

The internet egress Location is the location where your network traffic exits your enterprise network and connects to the Internet. This is also identified as the location where you have a Network Address Translation (NAT) device and usually where you connect with an Internet Service Provider (ISP). If you see a long distance between your location and your internet egress location, then this may identify a significant WAN backhaul.

Network connectivity in the Microsoft 365 Admin Center

Microsoft 365 network performance insights

Microsoft 365 network assessment

Microsoft 365 Network Connectivity Location Services

Source :
https://learn.microsoft.com/en-us/Microsoft-365/Enterprise/office-365-network-mac-perf-onboarding-tool?view=o365-worldwide

Active Directory and Active Directory Domain Services Port Requirements

Applies To: Windows Server 2000, Windows Server 2003, Windows Server 2003 R2, Windows Server 2003 with SP1, Windows Server 2003 with SP2, Windows Server 2008, Windows Server 2008 Foundation, Windows Server 2008 R2, Windows Server 2012, Windows Server 2012 R2, Windows Vista

This guide contains port requirements for various Active Directory® and Active Directory Domain Services (AD DS) components. Both writable domain controllers and read-only domain controllers (RODCs) have the same port requirements. For more information about RODCs, see Designing RODCs in the Perimeter Network.

Default dynamic port range

In a domain that consists of Windows Server® 2003–based domain controllers, the default dynamic port range is 1025 through 5000. Windows Server 2008 R2 and Windows Server 2008, in compliance with Internet Assigned Numbers Authority (IANA) recommendations, increased the dynamic port range for connections. The new default start port is 49152, and the new default end port is 65535. Therefore, you must increase the remote procedure call (RPC) port range in your firewalls. If you have a mixed domain environment that includes a Windows Server 2008 R2 and Windows Server 2008 server and Windows Server 2003, allow traffic through ports 1025 through 5000 and 49152 through 65535.

When you see “TCP Dynamic” in the Protocol and Port column in the following table, it refers to ports 1025 through 5000, the default port range for Windows Server 2003, and ports 49152 through 65535, the default port range beginning with Windows Server 2008.

 Note

For more information about the change in the dynamic port range beginning in Windows Server 2008, see article 929851 in the Microsoft Knowledge Base (https://go.microsoft.com/fwlink/?LinkId=153117).
You can find additional information about this change on the Ask the Directory Services Team blog. See the blog entry Dynamic Client Ports in Windows Server 2008 and Windows Vista (https://go.microsoft.com/fwlink/?LinkId=153113).

Restricting RPC to a specific port

RPC traffic is used over a dynamic port range as described in the previous section, “Default dynamic port range.” To restrict RPC traffic to a specific port, see article 224196 in the Microsoft Knowledge Base (https://go.microsoft.com/fwlink/?LinkID=133489).

Communication to Domain Controllers

The following table lists the port requirements for establishing DC to DC communication in all versions of Windows Sever beginning with Windows Server 2003.

Additional ports are required for communication between a read-only domain controller (RODC) and a writeable DC.

Protocol and PortAD and AD DS UsageType of traffic
TCP and UDP 389Directory, Replication, User and Computer Authentication, Group Policy, TrustsLDAP
TCP 636Directory, Replication, User and Computer Authentication, Group Policy, TrustsLDAP SSL
TCP 3268Directory, Replication, User and Computer Authentication, Group Policy, TrustsLDAP GC
TCP 3269Directory, Replication, User and Computer Authentication, Group Policy, TrustsLDAP GC SSL
TCP and UDP 88User and Computer Authentication, Forest Level TrustsKerberos
TCP and UDP 53User and Computer Authentication, Name Resolution, TrustsDNS
TCP and UDP 445Replication, User and Computer Authentication, Group Policy, TrustsSMB,CIFS,SMB2, DFSN, LSARPC, NbtSS, NetLogonR, SamR, SrvSvc
TCP 25ReplicationSMTP
TCP 135ReplicationRPC, EPM
TCP DynamicReplication, User and Computer Authentication, Group Policy, TrustsRPC, DCOM, EPM, DRSUAPI, NetLogonR, SamR, FRS
TCP 5722File ReplicationRPC, DFSR (SYSVOL)
UDP 123Windows Time, TrustsWindows Time
TCP and UDP 464Replication, User and Computer Authentication, TrustsKerberos change/set password
UDP DynamicGroup PolicyDCOM, RPC, EPM
UDP 138DFS, Group PolicyDFSN, NetLogon, NetBIOS Datagram Service
TCP 9389AD DS Web ServicesSOAP
UDP 67 and UDP 2535DHCPNoteDHCP is not a core AD DS service but it is often present in many AD DS deployments.DHCP, MADCAP
UDP 137User and Computer Authentication,NetLogon, NetBIOS Name Resolution
TCP 139User and Computer Authentication, ReplicationDFSN, NetBIOS Session Service, NetLogon

Source :
https://learn.microsoft.com/en-us/previous-versions/windows/it-pro/windows-server-2008-R2-and-2008/dd772723(v=ws.10)

How to restrict Active Directory RPC traffic to a specific port

This article describes how to restrict Active Directory (AD) replication remote procedure calls (RPC) traffic to a specific port in Windows Server.

Applies to:   all supported versions of Windows Server
Original KB number:   224196

Summary

By default, Active Directory replication remote procedure calls (RPC) occur dynamically over an available port through the RPC Endpoint Mapper (RPCSS) by using port 135. An administrator can override this functionality and specify the port that all Active Directory RPC traffic passes through. This procedure locks down the port.

When you specify ports to use by using the registry entries in More information, both Active Directory server-side replication traffic and client RPC traffic are sent to these ports by the endpoint mapper. This configuration is possible because all RPC interfaces supported by Active Directory are running on all ports on which it’s listening.

 Note

This article doesn’t describe how to configure AD replication for a firewall. Additional ports must be opened to make replication work through a firewall. For example, ports may need to be opened for the Kerberos protocol. To obtain a complete list of the required ports for services across a firewall, see Service overview and network port requirements for Windows.

More information

 Important

This section, method, or task contains steps that tell you how to modify the registry. However, serious problems might occur if you modify the registry incorrectly. Therefore, make sure that you follow these steps carefully. For added protection, back up the registry before you modify it. Then, you can restore the registry if a problem occurs. For more information about how to back up and restore the registry, see How to back up and restore the registry in Windows.

When you connect to an RPC endpoint, the RPC runtime on the client contacts the RPCSS on the server at a well-known port (135). And it obtains the port to connect to for the service supporting desired RPC interface. It assumes that the client doesn’t know the complete binding. It’s the situation with all AD RPC services.

The service registers one or more endpoints when it starts, and has the choice of a dynamically assigned port or a specific port.

If you configure Active Directory and Netlogon to run at port x as in the following entry, it becomes the ports that are registered with the endpoint mapper in addition to the standard dynamic port.

Use Registry Editor to modify the following values on each domain controller where the restricted ports are to be used. Member servers aren’t considered to be logon servers. So static port assignment for NTDS has no effect on member servers.

Member servers do have the Netlogon RPC Interface, but it’s rarely used. Some examples may be remote configuration retrieval, such as nltest /server:member.contoso.com /sc_query:contoso.com.

Registry key 1

HKEY_LOCAL_MACHINE\SYSTEM\CurrentControlSet\Services\NTDS\Parameters
Registry value: TCP/IP Port
Value type: REG_DWORD
Value data: (available port)

Restart the computer for the new setting to become effective.

Registry key 2

HKEY_LOCAL_MACHINE\SYSTEM\CurrentControlSet\Services\Netlogon\Parameters
Registry value: DCTcpipPort
Value type: REG_DWORD
Value data: (available port)

Restart the Netlogon service for the new setting to become effective.

 Note

When you use the DCTcpipPort registry entry, and you set it to the same port as the TCP/IP Port registry entry, you receive Netlogon error event 5809 under NTDS\Parameters. This indicates that the port configured is in use, and you should choose a different port.

You’ll receive the same event when you have a unique port, and you restart the Netlogon service on the domain controller. This behavior is by design. It occurs because of the way the RPC runtime manages its server ports. The port will be used after the restart, and the event can be ignored.

Administrators should confirm that the communication over the specified port is enabled if any intermediate network devices or software is used to filter packets between the domain controllers.

Frequently, you must also manually set the File Replication Service (FRS) RPC port because AD and FRS replication replicate with the same Domain Controllers. The FRS RPC port should use a different port.

Don’t assume that clients only use the Netlogon RPC services and thus only the setting DCTcpipPort is required. Clients are also using other RPC services such as SamRPC, LSARPC, and also the Directory Replication Services (DRS) interface. You should always configure both registry settings and open both ports on the firewall.

Known issues

After you specify the ports, you may encounter the following issues:

To resolve the issues, install the updates mentioned in the articles.

Source :
https://learn.microsoft.com/en-us/troubleshoot/windows-server/identity/restrict-ad-rpc-traffic-to-specific-port

Google’s Virtual Desktop of the Future

Nick Yeager

Manager, Google Computing

Did you know that most Google employees rely on virtual desktops to get their work done? This represents a paradigm shift in client computing at Google, and was especially critical during the pandemic and the remote work revolution. We’re excited to continue enabling our employees to be productive, anywhere! This post covers the history of virtual desktops and details the numerous benefits Google has seen from their implementation. 

https://storage.googleapis.com/gweb-cloudblog-publish/images/image3_6PhPZT5.max-2000x2000.png

Background

In 2018, Google began the development of virtual desktops in the cloud. A whitepaper was published detailing how virtual desktops were created with Google Cloud, running on Google Compute Engine, as an alternative to physical workstations. Further research had shown that it was feasible to move our physical workstation fleet to these virtual desktops in the cloud. The research began with user experience analysis – looking into how employee satisfaction of cloud workstations compared with physical desktops. Researchers found that user satisfaction of cloud desktops was higher than that of their physical desktop counterparts! This was a monumental moment for cloud-based client computing at Google, and this discovery led to additional analyses of Compute Engine to understand if it could become our preferred (virtual) workstation platform of the future.

Today, Google’s internal use of virtual desktops has increased dramatically. Employees all over the globe use a mix of virtual Linux and Windows desktops on Compute Engine to complete their work. Whether an employee is writing code, accessing production systems, troubleshooting issues, or driving productivity initiatives, virtual desktops are providing them with the compute they need to get their work done. Access to virtual desktops is simple: some employees access their virtual desktop instances via Secure Shell (SSH), while others use Chrome Remote Desktop — a graphical access tool. 

In addition to simplicity and accessibility, Google has realized a number of benefits from virtual desktops. We’ve seen an enhanced security posture, a boost to our sustainability initiatives, and a reduction in maintenance effort associated with our IT infrastructure. All these improvements were achieved while improving the user experience compared to our physical workstation fleet.

https://storage.googleapis.com/gweb-cloudblog-publish/images/image1_0EHHfvd.max-2000x2000.jpg

Example of Google Data Center

Analyzing Cloud vs Physical Desktops

Let’s look deeper into the analysis Google performed to compare cloud virtual desktops and physical desktops. Researchers compared cloud and physical desktops on five core pillars: user experience, performance, sustainability, security, and efficiency.

https://storage.googleapis.com/gweb-cloudblog-publish/images/image4_6gvUvXe.max-1900x1900.png

User Experience

Before the transition to virtual desktops got underway, user experience researchers wanted to know more about how they would affect employee happiness. They discovered that employees embraced the benefits that virtual desktops offered. This included freeing up valuable desk space to provide an always-on, always available compute experience, accessible from anywhere in the world, and reduced maintenance overhead compared to physical desktops. 

Performance

From a performance perspective, cloud desktops are simply better than physical desktops. For example, running on Compute Engine makes it easy to spin-up on-demand virtual instances with predictable compute and performance – a task that is significantly more difficult with a physical workstation vendor. Virtual desktops rely on a mix of Virtual Machine (VM) families that Google developed based on the performance needs of our users. These include Google Compute Engine E2 high-efficiency instances, which employees might use for day-to-day tasks, to higher-performance N2/N2D instances, which employees might use for more demanding machine learning jobs. Compute Engine offers a VM shape for practically any computing workflow. Additionally, employees no longer have to worry about machine upgrades (to increase performance, for example) because our entire fleet of virtual desktops can be upgraded to new shapes (with more CPU and RAM) with a single config change and a simple reboot — all within a matter of minutes. Plus, Compute Engine continues to add features and new machine types, which means our capabilities only continue to grow in this space.

Sustainability

Google cares deeply about sustainability and has been carbon neutral since 2007. Moving from physical desktops to virtual desktops on Compute Engine brings us closer to Google sustainability goals of a net-neutral desktop computing fleet. Our internal facilities team has praised virtual desktops as a win for future workspace planning, because a reduction in physical workstations could also mean a reduction in first-time construction costs of new buildings, significant (up to 30%) campus energy reductions, and even further reductions in costs associated with HVAC needs and circuit size needs at our campuses. Lastly, a reduction in physical workstations also contributes to a reduction in physical e-waste and a reduction in the carbon associated with transporting workstations from their factory of origin to office locations. At Google’s scale, these changes lead to an immense win from a sustainability standpoint. 

Security

By their very nature, virtual desktops mitigate the ability for a bad actor to exfiltrate data or otherwise compromise physical desktop hardware since there is no desktop hardware to compromise in the first place. This means attacks such as USB attacks, evil maid attacks, and similar techniques for subverting security that require direct hardware access become worries of the past. Additionally, the transition to cloud-based virtual desktops also brings with it an enhanced security posture through the use of Google Cloud’s myriad security features including Confidential ComputingvTPMs, and more. 

Efficiency

In the past, it was not uncommon for employees to spend days waiting for IT to deliver new machines or fix physical workstations. Today, cloud-based desktops can be created instantaneously on-demand and resized on-demand. They are always accessible, and virtually immune from maintenance-related issues. IT no longer has to deal with concerns like warranty claims, break-fix issues, or recycling. This time savings enables IT to focus on higher priority initiatives all while reducing their workload. With an enterprise the size of Google, these efficiency wins added up quickly. 

Considerations to Keep in Mind

Although Google has seen significant benefits with virtual desktops, there are some considerations to keep in mind before deciding if they are right for your enterprise. First, it’s important to recognize that migrating to a virtual fleet requires a consistently reliable and performant client internet connection. For remote/global employees, it’s important they’re located geographically near a Google Cloud Region (to minimize latency). Additionally, there are cases where physical workstations are still considered vital. These cases include users who need USB and other direct I/O access for testing/debugging hardware and users who have ultra low-latency graphics/video editing or CAD simulation needs. Finally, to ensure interoperability between these virtual desktops and the rest of our computing fleet, we did have to perform some additional engineering tasks to integrate our asset management and other IT systems with the virtual desktops. Whether your enterprise needs such features and integration should be carefully analyzed before considering a solution such as this. However, should you ultimately conclude that cloud-based desktops are the solution for your enterprise, we’re confident you’ll realize many of the benefits we have!

Tying It All Together

Although moving Google employees to virtual desktops in the clouds was a significant engineering undertaking, the benefits have been just as significant.  Making this switch has boosted employee productivity and satisfaction, enhanced security, increased efficiency, and provided noticeable improvements in performance and user experience. In short, cloud-based desktops are helping us transform how Googlers get their work done. During the pandemic, we saw the benefits of virtual desktops in a critical time. Employees had access to their virtual desktop from anywhere in the world, which kept our workforce safer and reduced transmission vectors for COVID-19. We’re excited for a future where more and more of our employees are computing in the cloud as we continue to embrace the work-from-anywhere model and as we continue to add new features and enhanced capabilities to Compute Engine!

Source :
https://cloud.google.com/blog/topics/developers-practitioners/googles-virtual-desktop-future

How to Protect Your Microsoft Exchange Server 2019 with CrowdSec

Follow this step-by-step guide on installing CrowdSec on a Microsoft Exchange server to better protect against common cyberattacks and new threats.

This article is a direct translation of Florian Burnel’s article published on IT Connect. You can find the original article here.

We also have an article on installing CrowdSec on a Windows server with a tutorial on blocking brute force attacks on an RDP connection and blocking a scan of a website hosted on an IIS server.

I. Presentation

In this tutorial, we will dive into how to secure a Microsoft Exchange mail server with the CrowdSec collaborative firewall! Installing CrowdSec on a Microsoft Exchange server will allow you to protect against common attacks but also new threats.

A good example is the security breach ProxyNotShell which made headlines in October 2022: CrowdSec can detect exploit attempts and block malicious IP addresses, thanks to the fact that it contains a collection for IIS and attacks based on HTTP/HTTPS protocols. Other examples are more classic cases: brute force attacks on the Exchange webmail interface.

Due to how it functions, an Exchange server will be exposed to the Internet depending on the architecture of your IS (for example, the presence or absence of a reverse proxy). However, it must be able to communicate outward and also be reachable from the outside to send and receive emails to your users’ mailboxes.

This same server is also reachable through Webmail which allows users to check their emails from a browser. This implies the presence of an IIS web server that hosts both Webmail and Exchange Admin Center. Furthermore, when an Exchange server is compromised by a cyberattack, this mainly involves HTTP/HTTPS access: hence the interest in protecting yourself.

CrowdSec Windows - Protect OWA

This article is a continuation of my first article on installing an Exchange Server 2019 server. For the installation of the Microsoft Exchange Server itself, I invite you to read my previous tutorial.

In addition, I also encourage you to restrict access to the Exchange admin center.

II. Setting up CrowdSec on Windows

A. Installing the CrowdSec Agent

I already wrote about how to install CrowdSec on Windows in a previous article, but that was the Alpha version. Now, the CrowdSec agent for Windows is available in a stable version, which means that it is ready to be implemented in production.

Note: if you have previously installed the alpha version on your server, you must uninstall it before installing this new CrowdSec version.

First, you must download the MSI package from the official CrowdSec GitHub repository.

While it is installing, the CrowdSec MSI package will perform the following actions:

  • Install CrowdSec itself
  • Integrate the Windows Collection (details are available here)
  • Register the CrowdSec instance with the Central API
  • Register the CrowdSec service within Windows (automatic start)

Once done, begin the installation. Just follow the steps without making any changes. Then, allow about 2 minutes for the Agent to fully install. 

Install CrowdSec on Windows for Exchange Server

As soon as the CrowdSec Agent is in place, we have access to the “cscli” command line which allows you to manage your CrowdSec instance from it.

To list current collections:

cscli collections list

To list the current bouncers (none by default):

cscli bouncers list

CrowdSec Windows - List collections and bouncers

B. Installing the ISS Collection

On Windows, CrowdSec natively sets up the “crowdsecurity/windows“, but it is not enough to protect your Exchange server. We will need to add the IIS collection, which will also add two more collections to detect web attacks.

This collection is installed from this command:

cscli collections install crowdsecurity/iis

In just a few seconds after adding, we can list the installed collections to see the presence of the new collections.

CrowdSec Windows - Lister les collections

To justify what I said in the introduction about the ProxyNotShell vulnerability, we can look at the details of the “crowdsecurity/http-cve” collection. Here, we can see the presence of a detection scenario named “crowdsecurity/CVE-2022-41082” corresponding to this vulnerability.

cscli collections inspect crowdsecurity/http-cve

CrowdSec Windows - http-cve collection details

Let’s go to the next step.

C. Installing Windows Firewall Bouncer

Now, we must set up the “firewall” bouncer for Windows, otherwise, attacks will be detected, but not blocked. Click on the following link, then on the “Download” button to download the MSI package: https://hub.crowdsec.net/author/crowdsecurity/bouncers/cs-windows-firewall-bouncer

The installation is done in only a few clicks: just follow the wizard.

CrowdSec Windows - Installation du bouncer firewall

Once done, the command below will make it possible to see the presence of the bouncer.

cscli bouncers list

CrowdSec Windows - Lister les bouncers

Let’s go to the next step.

D. Add IIS log support

For CrowdSec to focus on the logs generated by IIS, and by extension, corresponding to the access to the OWA and ECP portals of Exchange, we must indicate to it the paths to the log files it will analyze.

To do this, you will need to edit the following: 

C:\ProgramData\CrowdSec\config\acquis.yaml

In order to add the following lines:

---
use_time_machine: true
filenames:
  - C:\inetpub\logs\LogFiles\*\*.log
labels:
  type: iis

You can see the presence of a “dynamic” path which is characterized by the presence of the wildcard character: “C:\inetpub\logs\LogFiles\*\*.log “. This value will allow CrowdSec to find and read log files located in the tree “C:\inetpub\logs\LogFiles\

In addition to the path to the log files, this configuration block we just added contains a parameter named use_time_machine. It is important because IIS does not write logs in real-time in the log file, but it writes new events in blocks, every minute. Thanks to this parameter, CrowdSec will read the date and time of each line to find its way and process the events chronologically, this avoids false positives. 

However, if you are not using the log files, but the event viewer, you should use this piece of code and not the one mentioned above:

---
source: wineventlog
event_channel: Microsoft-IIS-Logging/Logs
event_ids:  - 6200
event_level: information
labels:  
type: iis

Save the acquired.yaml file and you can close it.

Finally, we need to restart CrowdSec. This operation is done in PowerShell with this command:

Restart-Service crowdsec

CrowdSec setup is complete! Now let’s test it!

III. Is the Exchange server protected?

A. Brute force on OWA – Webmail Exchange 

There are several possible methods to perform a brute force attack on OWA. Of course, you could do this manually for testing, but you could also use something a bit more automated to simulate a brute-force attack. As for us, we will use a Bash script named “OWA BRUTE” that executes Hydra (an offensive tool compatible with many protocols to test a service’s authentication, equipment, etc. ) with specific parameters corresponding to Outlook Web Access.

The script is available on GitHub.

First, we need to install Hydra and Git. The first one is a prerequisite to use the script and perform our attack, while the second one will be used to clone the GitHub repository to get the Bash script (you can also copy and paste the script in a file…).

sudo apt-get update

sudo apt-get install hydra git

Once this is done, we clone the GitHub project in “/home/florian”:

cd /home/florian/

git clone

Then, we create a file “users.txt” in which we indicate some names of users. You can also recover a list on the Internet.

nano /home/florian/owabrute/users.txt

In the same sense, we create a file “passwords.txt” with the passwords to test.

nano /home/florian/owabrute/passwords.txt

Then, we move to the OWA BRUTE directory to add the execution rights on the Bash script.

cd /home/florian/owabrute/

chmod +x owabrute.sh

All that remains is to launch the attack by targeting “mail.domaine.fr” and then using our previously created files.

./owabrute.sh -d mail.domaine.fr -u ./users.txt -p ./passwords.txt

We can see that the script will test each combination. At the end, it will indicate if it has succeeded or not in finding a valid combination. However, CrowdSec will intervene…

We can see that the script will test each combination, in turn.  In the end, it will indicate whether or not it succeeded in finding a valid combination.  However, CrowdSec will intervene....

Indeed, if I look at my Exchange server, I can see that there is a new IP address blocked because of brute force (“crowdsecurity/windows-bf”). The CrowdSec agent has correctly blocked the IP address that caused this attack.

.

Since we are here to test, we can unblock our IP address manually:

cscli decisions delete –ip X.X.X.X

Let’s move on to a second test.

B. Scan Web on OWA

In the case where someone tries to scan your Web server, when IIS is used by Exchange, they can rely on various tools including Nikto which is used to analyze the security level of a Web server. For this example, OWA will be scanned with the Nikto tool: we will see if CrowdSec detects what is happening on the IIS server…

First of all, let’s install this tool:

sudo apt-get update

sudo apt-get install nikto

Then, we launch the scan to webmail:

nikto -h https://mail.domaine.fr/owa

The analysis will take several minutes…

The analysis will take several minutes...

…Except that after a while, CrowdSec will realize that this web client is performing suspicious actions and it will decide to block it. In the example below, we can see the reason “http-sensitive-files” which means that the client tried to access sensitive files.

In this second example, where we performed a completely different action compared to the first attempt, CrowdSec also managed to detect our malicious actions.

IV. Conclusion

We have just seen how to set up the CrowdSec agent on Windows to protect a Microsoft Exchange mail server! Here, I took the example of Exchange Server 2019, but it also applies to previous versions. With these two quick, but concrete examples, we could see the efficiency of CrowdSec!

I’ll also take this moment to remind you of the existence of the CrowdSec Console which allows you to follow the alerts raised by one or more CrowdSec Agents from a web-based console. To learn more about the implementation and all the functionalities, you can visit the Console page.

WRITTEN BY

Florian Burnel

Source :
https://www.crowdsec.net/blog/how-to-protect-microsoft-exchange-server-crowdsec

Palo Alto Networks Secures Nutanix Cloud Clusters for Microsoft Azure

Securing your hybrid multi-cloud environment just got easier. We are excited to announce Palo Alto Networks VM-Series Virtual Next-Generation Firewalls (NGFWs) are now available on Nutanix Cloud Clusters (NC2)™ for Microsoft Azure with Nutanix Flow Virtual Networking™.

NC2 on Azure leverages a new bare metal-as-a-service (BMaaS) offering, which is jointly engineered by Nutanix® and Microsoft® teams for cloud-like infrastructure consumption without the need to purchase more hardware up-front. It leverages the power of the hybrid cloud to extend workloads to Azure seamlessly from on-premises. NC2 provides a consistent experience to provision and manage Nutanix clusters on-premises or deployed in Azure, enabling workload mobility across clouds.

During last month’s Microsoft Ignite, Nutanix announced the availability of NC2 on Microsoft Azure to easily extend on-premises data and workloads to Azure, creating a true hybrid cloud. With Palo Alto Networks VM-Series virtual firewall insertion, you can secure your Nutanix AHV workloads on overlay networks deployed using VPCs (virtual private clouds) within Flow Virtual Networking. Nutanix AHV provides a modern, secure virtualization platform for all your virtual machines (VM) and container workloads without additional licensing or investment on Nutanix hyperconverged infrastructure (HCI).

Simplify Multi-Cloud Security with VM-Series Virtual NGFWs

With VM-Series virtual firewalls, your Nutanix AHV workloads will have advanced security features that deliver the required application layer of security for total coverage. Leverage network security and visibility across your hybrid cloud – both on-premises and on Microsoft Azure – without complex reconfiguration. With this validation, you can gain consistent security and visibility across your hybrid cloud environment.

You can find the perfect balance of security, speed and value through the advanced Cloud-Delivered Security Services available with the VM-Series Virtual Firewall. Get simple security for public clouds, private clouds and on-premises data for total coverage and protection from known and unknown threats.

Palo Alto Networks VM-Series Virtual Firewalls are monitored, configured and managed by Palo Alto Networks Panorama™ firewall management tools. With Panorama, you gain network security capabilities that provide a single pane of glass to manage security and policies while alleviating the need to jump between interfaces. You can now easily manage the security postures of their virtual environments, physical data centers and even public clouds.

Prevent Lateral Movement with Microsegmentation and Nutanix Flow Network Security™

As your virtualized and cloud environments grow, so does your attack surface. This increases the risk of bad actors gaining access to your internal network. Once attackers bypass perimeter security controls, they can move laterally across the environment in search of data to steal or hold for ransom. Because of this, it’s essential to redefine your security approach to include lateral, east-west, network traffic and perimeter network security.

With Nutanix Flow Network Security, you can leverage advanced network security using microsegmentation, or managed virtual-machine-level software firewalls, to gain visibility into your workloads on your virtual networks. Even when a VM moves across segments or clouds, the risk of network threats, malware and ransomware is reduced with a unified security policy approach.

Flow Network Security is an application-centric microsegmentation solution that protects east-west traffic to your environments by allowing you to control east-west VM-to-VM traffic. It reduces the risk of threats spreading laterally across the data center and enforces a perimeter around every individual VM.

Check It Out For Yourself

In this use case, all external traffic for subnets and VMs of the VPC traverse through the VM-Series Virtual Firewall. Configured application layer (L7) security policies are enforced via the policy-based routing capability available in the Flow Virtual Networking VPC’s section.

Flow chart showing Nutanix AHV Cluster, Flow Virtual Networking, External Network, Microsoft Azure.
Azure flow chart of Virtual Networking for Nutanix AHV Cluster.

Workload mobility doesn’t have to mean complex security reconfiguration. As NC2 on Microsoft Azure extends your on-premises deployments, Palo Alto Networks ensures that you have the seamless security and visibility you need to safeguard your hybrid cloud environment.

Find Out How to Do More

See how Palo Alto Networks and Nutanix work together to deliver enhanced security capabilities and integrated solutions that secure the enterprise. Learn more about our VM-Series Virtual Firewalls and other Nutanix integrations, which give customers access to next-generation security controls that stop threats before they cause damage.

Source :
https://www.paloaltonetworks.com/blog/2022/11/nutanix-cloud-clusters-for-microsoft-azure/

LockBit 3.0 ‘Black’ attacks and leaks reveal wormable capabilities and tooling

Reverse-engineering reveals close similarities to BlackMatter ransomware, with some improvements

A postmortem analysis of multiple incidents in which attackers eventually launched the latest version of LockBit ransomware (known variously as LockBit 3.0 or ‘LockBit Black’), revealed the tooling used by at least one affiliate. Sophos’ Managed Detection and Response (MDR) team has observed both ransomware affiliates and legitimate penetration testers use the same collection of tooling over the past 3 months.

Leaked data about LockBit that showed the backend controls for the ransomware also seems to indicate that the creators have begun experimenting with the use of scripting that would allow the malware to “self-spread” using Windows Group Policy Objects (GPO) or the tool PSExec, potentially making it easier for the malware to laterally move and infect computers without the need for affiliates to know how to take advantage of these features for themselves, potentially speeding up the time it takes them to deploy the ransomware and encrypt targets.

A reverse-engineering analysis of the LockBit functionality shows that the ransomware has carried over most of its functionality from LockBit 2.0 and adopted new behaviors that make it more difficult to analyze by researchers. For instance, in some cases it now requires the affiliate to use a 32-character ‘password’ in the command line of the ransomware binary when launched, or else it won’t run, though not all the samples we looked at required the password.

We also observed that the ransomware runs with LocalServiceNetworkRestricted permissions, so it does not need full Administrator-level access to do its damage (supporting observations of the malware made by other researchers).

Most notably, we’ve observed (along with other researchers) that many LockBit 3.0 features and subroutines appear to have been lifted directly from BlackMatter ransomware.

Is LockBit 3.0 just ‘improved’ BlackMatter?

Other researchers previously noted that LockBit 3.0 appears to have adopted (or heavily borrowed) several concepts and techniques from the BlackMatter ransomware family.

We dug into this ourselves, and found a number of similarities which strongly suggest that LockBit 3.0 reuses code from BlackMatter.

Anti-debugging trick

Blackmatter and Lockbit 3.0 use a specific trick to conceal their internal functions calls from researchers. In both cases, the ransomware loads/resolves a Windows DLL from its hash tables, which are based on ROT13.

It will try to get pointers from the functions it needs by searching the PEB (Process Environment Block) of the module. It will then look for a specific binary data marker in the code (0xABABABAB) at the end of the heap; if it finds this marker, it means someone is debugging the code, and it doesn’t save the pointer, so the ransomware quits.

After these checks, it will create a special stub for each API it requires. There are five different types of stubs that can be created (randomly). Each stub is a small piece of shellcode that performs API hash resolution on the fly and jumps to the API address in memory. This adds some difficulties while reversing using a debugger.

Screenshot of disassembler code
LockBit’s 0xABABABAB marker

SophosLabs has put together a CyberChef recipe for decoding these stub shellcode snippets.

Output of a CyberChef recipe
The first stub, as an example (decoded with CyberChef)

Obfuscation of strings

Many strings in both LockBit 3.0 and BlackMatter are obfuscated, resolved during runtime by pushing the obfuscated strings on to the stack and decrypting with an XOR function. In both LockBit and BlackMatter, the code to achieve this is very similar.

Screenshot of disassembler code
BlackMatter’s string obfuscation (image credit: Chuong Dong)

Georgia Tech student Chuong Dong analyzed BlackMatter and showed this feature on his blog, with the screenshot above.

Screenshot of disassembler code
LockBit’s string obfuscation, in comparison

By comparison, LockBit 3.0 has adopted a string obfuscation method that looks and works in a very similar fashion to BlackMatter’s function.

API resolution

LockBit uses exactly the same implementation as BlackMatter to resolve API calls, with one exception: LockBit adds an extra step in an attempt to conceal the function from debuggers.

Screenshot of disassembler code
BlackMatter’s dynamic API resolution (image credit: Chuong Dong)

The array of calls performs precisely the same function in LockBit 3.0.

Screenshot of disassembler code
LockBit’s dynamic API resolution

Hiding threads

Both LockBit and BlackMatter hide threads using the NtSetInformationThread function, with the parameter ThreadHideFromDebugger. As you probably can guess, this means that the debugger doesn’t receive events related to this thread.

Screenshot of disassembler code
LockBit employs the same ThreadHideFromDebugger feature as an evasion technique

Printing

LockBit, like BlackMatter, sends ransom notes to available printers.

Screenshot of disassembler code
LockBit can send its ransom notes directly to printers, as BlackMatter can do

Deletion of shadow copies

Both ransomware will sabotage the infected computer’s ability to recover from file encryption by deleting the Volume Shadow Copy files.

LockBit calls the IWbemLocator::ConnectServer method to connect with the local ROOT\CIMV2 namespace and obtain the pointer to an IWbemServices object that eventually calls IWbemServices::ExecQuery to execute the WQL query.

Screenshot of disassembler code
BlackMatter code for deleting shadow copies (image credit: Chuong Dong)

LockBit’s method of doing this is identical to BlackMatter’s implementation, except that it adds a bit of string obfuscation to the subroutine.

Screenshot of disassembler code
LockBit’s deletion of shadow copies

Enumerating DNS hostnames

Both LockBit and BlackMatter enumerate hostnames on the network by calling NetShareEnum.

Screenshot of disassembler code
BlackMatter calls NetShareEnum() to enumerate hostnames… (image credit: Chuong Dong)

In the source code for LockBit, the function looks like it has been copied, verbatim, from BlackMatter.

Screenshot of disassembler code
…as does LockBit

Determining the operating system version

Both ransomware strains use identical code to check the OS version – even using the same return codes (although this is a natural choice, since the return codes are hexadecimal representations of the version number).

Screenshot of disassembler code
BlackMatter’s code for checking the OS version (image credit: Chuong Dong)
Screenshot of disassembler code
LockBit’s OS enumeration routine

Configuration

Both ransomware contain embedded configuration data inside their binary executables. We noted that LockBit decodes its config in a similar way to BlackMatter, albeit with some small differences.

For instance, BlackMatter saves its configuration in the .rsrc section, whereas LockBit stores it in .pdata

Screenshot of disassembler code
BlackMatter’s config decryption routine (image credit: Chuong Dong)

And LockBit uses a different linear congruential generator (LCG) algorithm for decoding.

Screenshot of disassembler code
LockBit’s config decryption routine

Some researchers have speculated that the close relationship between the LockBit and BlackMatter code indicates that one or more of BlackMatter’s coders were recruited by LockBit; that LockBit bought the BlackMatter codebase; or a collaboration between developers. As we noted in our white paper on multiple attackers earlier this year, it’s not uncommon for ransomware groups to interact, either inadvertently or deliberately.

Either way, these findings are further evidence that the ransomware ecosystem is complex, and fluid. Groups reuse, borrow, or steal each other’s ideas, code, and tactics as it suits them. And, as the LockBit 3.0 leak site (containing, among other things, a bug bounty and a reward for “brilliant ideas”) suggests, that gang in particular is not averse to paying for innovation.

LockBit tooling mimics what legitimate pentesters would use

Another aspect of the way LockBit 3.0’s affiliates are deploying the ransomware shows that they’re becoming very difficult to distinguish from the work of a legitimate penetration tester – aside from the fact that legitimate penetration testers, of course, have been contracted by the targeted company beforehand, and are legally allowed to perform the pentest.

The tooling we observed the attackers using included a package from GitHub called Backstab. The primary function of Backstab is, as the name implies, to sabotage the tooling that analysts in security operations centers use to monitor for suspicious activity in real time. The utility uses Microsoft’s own Process Explorer driver (signed by Microsoft) to terminate protected anti-malware processes and disable EDR utilities. Both Sophos and other researchers have observed LockBit attackers using Cobalt Strike, which has become a nearly ubiquitous attack tool among ransomware threat actors, and directly manipulating Windows Defender to evade detection.

Further complicating the parentage of LockBit 3.0 is the fact that we also encountered attackers using a password-locked variant of the ransomware, called lbb_pass.exe , which has also been used by attackers that deploy REvil ransomware. This may suggest that there are threat actors affiliated with both groups, or that threat actors not affiliated with LockBit have taken advantage of the leaked LockBit 3.0 builder. At least one group, BlooDy, has reportedly used the builder, and if history is anything to go by, more may follow suit.

LockBit 3.0 attackers also used a number of publicly-available tools and utilities that are now commonplace among ransomware threat actors, including the anti-hooking utility GMER, a tool called AV Remover published by antimalware company ESET, and a number of PowerShell scripts designed to remove Sophos products from computers where Tamper Protection has either never been enabled, or has been disabled by the attackers after they obtained the credentials to the organization’s management console.

We also saw evidence the attackers used a tool called Netscan to probe the target’s network, and of course, the ubiquitous password-sniffer Mimikatz.

Incident response makes no distinction

Because these utilities are in widespread use, MDR and Rapid Response treats them all equally – as though an attack is underway – and immediately alerts the targets when they’re detected.

We found the attackers took advantage of less-than-ideal security measures in place on the targeted networks. As we mentioned in our Active Adversaries Report on multiple ransomware attackers, the lack of multifactor authentication (MFA) on critical internal logins (such as management consoles) permits an intruder to use tooling that can sniff or keystroke-capture administrators’ passwords and then gain access to that management console.

It’s safe to assume that experienced threat actors are at least as familiar with Sophos Central and other console tools as the legitimate users of those consoles, and they know exactly where to go to weaken or disable the endpoint protection software. In fact, in at least one incident involving a LockBit threat actor, we observed them downloading files which, from their names, appeared to be intended to remove Sophos protection: sophoscentralremoval-master.zip and sophos-removal-tool-master.zip. So protecting those admin logins is among the most critically important steps admins can take to defend their networks.

For a list of IOCs associated with LockBit 3.0, please see our GitHub.

Acknowledgments

Sophos X-Ops acknowledges the collaboration of Colin Cowie, Gabor Szappanos, Alex Vermaning, and Steeve Gaudreault in producing this report.

Source :
https://news.sophos.com/en-us/2022/11/30/lockbit-3-0-black-attacks-and-leaks-reveal-wormable-capabilities-and-tooling/

7 Cyber Security Tips for SMBs

When the headlines focus on breaches of large enterprises like the Optus breach, it’s easy for smaller businesses to think they’re not a target for hackers. Surely, they’re not worth the time or effort?

Unfortunately, when it comes to cyber security, size doesn’t matter.

Assuming you’re not a target leads to lax security practices in many SMBs who lack the knowledge or expertise to put simple security steps in place. Few small businesses prioritise cybersecurity, and hackers know it. According to Verizon, the number of smaller businesses being hit has climbed steadily in the last few years – 46% of cyber breaches in 2021 impacted businesses with fewer than 1,000 employees.

Cyber security doesn’t need to be difficult#

Securing any business doesn’t need to be complex or come with a hefty price tag. Here are seven simple tips to help the smaller business secure their systems, people and data.

1 — Install anti-virus software everywhere#

Every organisation has anti-virus on their systems and devices, right? Unfortunately, business systems such as web servers get overlooked all too often. It’s important for SMBs to consider all entry points into their network and have anti-virus deployed on every server, as well as on employees’ personal devices.

Hackers will find weak entry points to install malware, and anti-virus software can serve as a good last-resort backstop, but it’s not a silver bullet. Through continuous monitoring and penetration testing you can identify weaknesses and vulnerabilities before hackers do, because it’s easier to stop a burglar at the front door than once they’re in your home.

2 — Continuously monitor your perimeter#

Your perimeter is exposed to remote attacks because it’s available 24/7. Hackers constantly scan the internet looking for weaknesses, so you should scan your own perimeter too. The longer a vulnerability goes unfixed, the more likely an attack is to occur. With tools like Autosploit and Shodan readily available, it’s easier than ever for attackers to discover internet facing weaknesses and exploit them.

Even organisations that cannot afford a full-time, in-house security specialist can use online services like Intruder to run vulnerability scans to uncover weaknesses.

Intruder is a powerful vulnerability scanner that provides a continuous security review of your systems. With over 11,000 security checks, Intruder makes enterprise-grade scanning easy and accessible to SMBs.

Intruder will promptly identify high-impact flaws, changes in the attack surface, and rapidly scan your infrastructure for emerging threats.

3 — Minimise your attack surface#

Your attack surface is made up of all the systems and services exposed to the internet. The larger the attack surface, the bigger the risk. This means exposed services like Microsoft Exchange for email, or content management systems like WordPress can be vulnerable to brute-forcing or credential-stuffing, and new vulnerabilities are discovered almost daily in such software systems. By removing public access to sensitive systems and interfaces which don’t need to be accessible to the public, and ensuring 2FA is enabled where they do, you can limit your exposure and greatly reduce risk.

A simple first step in reducing your attack surface is by using a secure virtual private network (VPN). By using a VPN, you can avoid exposing sensitive systems directly to the internet whilst maintaining their availability to employees working remotely. When it comes to risk, prevention is better than cure – don’t expose anything to the internet unless it’s absolutely necessary!

4 — Keep software up to date#

New vulnerabilities are discovered daily in all kinds of software, from web browsers to business applications. Just one unpatched weakness could lead to full compromise of a system and a breach of customer data; as TalkTalk discovered when 150,000 of its private data records were stolen.

According to a Cyber Security Breaches Survey, businesses that hold electronic personal data of their customers are more likely than average to have had breaches. Patch management is an essential component of good cyber hygiene, and there are tools and services to help you check your software for any missing security patches.

5 — Back up your data #

Ransomware is on the increase. In 2021, 37% of businesses and organisations were hit by ransomware according to research by Sophos. Ransomware encrypts any data it can access, rendering it unusable, and can’t be reversed without a key to decrypt the data.

Data loss is a key risk to any business either through malicious intent or a technical mishap such as hard disk failure, so backing up data is always recommended. If you back up your data, you can counter attackers by recovering your data without needing to pay the ransom, as systems affected by ransomware can be wiped and restored from an unaffected backup without the attacker’s key.

6 — Keep your staff security aware#

Cyber attackers often rely on human error, so it’s vital that staff are trained in cyber hygiene so they recognise risks and respond appropriately. The Cyber Security Breaches Survey 2022 revealed that the most common types of breaches were staff receiving fraudulent emails or phishing attacks (73%), followed by people impersonating the organisation in emails or online (27%), viruses, spyware and malware (12%), and ransomware (4%).

Increasing awareness of the benefits of using complex passwords and training staff to spot common attacks such as phishing emails and malicious links, will ensure your people are a strength rather than a vulnerability.

— Protect yourself relative to your risk#

Cyber security measures should always be appropriate to the organisation. For example, a small business which handles banking transactions or has access to sensitive information such as healthcare data should employ far more stringent security processes and practices than a pet shop.

That’s not to say a pet shop doesn’t have a duty to protect customer data, but it’s less likely to be a target. Hackers are motivated by money, so the bigger the prize the more time and effort will be invested to achieve their gains. By identifying your threats and vulnerabilities with a tool like Intruder, you can take appropriate steps to mitigate and prioritize which risks need to be addressed and in which order.

It’s time to raise your cyber security game#

Attacks on large companies dominate the news, which feeds the perception that SMBs are safe, when the opposite is true. Attacks are increasingly automated, so SMBs are just as vulnerable targets as larger enterprises, more so if they don’t have adequate security processes in place. And hackers will always follow the path of least resistance. Fortunately, that’s the part Intruder made easy…

About Intruder#

Intruder is a cyber security company that helps organisations reduce their attack surface by providing continuous vulnerability scanning and penetration testing services. Intruder’s powerful scanner is designed to promptly identify high-impact flaws, changes in the attack surface, and rapidly scan the infrastructure for emerging threats. Running thousands of checks, which include identifying misconfigurations, missing patches, and web layer issues, Intruder makes enterprise-grade vulnerability scanning easy and accessible to everyone. Intruder’s high-quality reports are perfect to pass on to prospective customers or comply with security regulations, such as ISO 27001 and SOC 2.

Intruder offers a 14-day free trial of its vulnerability assessment platform. Visit their website today to take it for a spin!

Found this article interesting? Follow us on Twitter  and LinkedIn to read more exclusive content we post.

Source :
https://thehackernews.com/2022/11/7-cyber-security-tips-for-smbs.html

Wordfence 7.8.0 Is Out! Here Is What Is Included

Wordfence 7.8.0 is out! A huge thanks to our quality assurance team, our team of developers and our ops team for planning, implementing and releasing Wordfence 7.8.0. This release has several fixes to make Wordfence even more robust, and includes a fundamental change in the way our signup works.

Since our launch in 2012, the signup flow for Wordfence has not required you to leave your own WordPress installation and come to our website. We briefly required this, but removed it 10 days after launch.

Wordfence has grown to a community of over 4 million active websites and a very large number of paying customers. Wordfence is now downloaded over 30,000 times every day. Today we spend a huge amount of money on providing the services that our free and paid community needs to stay secure. Privacy laws have also changed profoundly since 2012.

Scaling up our operations has required us to get better at capacity planning, which means knowing how many installations we’re getting, how many are bots or spam, who is communicating with our servers during a scan, and whether it is a real website running Wordfence, a nulled plugin or someone simply using our resources to power something unrelated to Wordfence.

Privacy laws have also added the need for us to be able to communicate with our free customers to alert them to privacy policy and terms of use changes.

This has required us to adjust our signup flow to match other popular plugins out there, like Akismet. Many customers may find this is a clearer signup workflow because we no longer need to shoehorn a complex user experience into a set of modals on a site where we don’t control presentation.

This change will not disrupt any of our existing free or paid customers. If you have a free API key that Wordfence automatically fetched when you installed it, that key will remain valid and your site will continue uninterrupted. If you have a paid Wordfence API key, your key will continue to work without disruption. We are not requiring any existing customers to visit our site to install a new key.

The only users this affects are new free Wordfence installations. The installation process is quite simple. You install Wordfence and are directed to our site. You can choose a paid or free option. If you choose the paid option, you’ll go through our checkout process as usual. If you choose free, we’ll email you your key. The email includes a button that you can click to automatically take you back to your site where your key will be automatically installed. The email also includes your Wordfence key in case you need to manually install it.

A side benefit of this new process is that our free customers will now have a record of their API key in their email inbox for future reference.

If you have any questions related to this change, our customer service team is standing by to assist you on our forums for free customers, and via our ticket system for paid customers. We welcome your input.

We’re including the full changelog for Wordfence 7.8.0 below. You’ll notice that we’ve mentioned that additional WooCommerce support is on its way, so keep an eye out for that.

Thanks for choosing Wordfence!

Mark Maunder – Wordfence Founder & CEO.

Wordfence 7.8.0 Changelog

Change: Updated Wordfence registration workflow

For new installations of Wordfence, registering for a new license key now occurs on wordfence.com instead of within the plugin interface. Allows us to provide a more complete signup experience for our free and paid customers. Also allows us to do better capacity planning.

Improvement: Added feedback when login form is submitted with 2FA

When logging in with two-factor authentication, the “Log In” button is now disabled during processing, so that it is clear the button was clicked. Sometimes on slower sites, it was hard to tell whether the login was going through, leading users to click more than once.

Fix: Restored click support on login button when using 2FA with WooCommerce

Clicking the “Log In” button after entering a 2FA code on a WooCommerce site was no longer working, while pressing “Enter” still worked. Both methods now work as expected. Additional support for WooCommerce is coming in the near future.

Fix: Corrected display issue with reCAPTCHA score history graph

The reCAPTCHA score history graph was sometimes displayed larger than intended when switching tabs. It now has a set size, so that it does not become unusually large.

Fix: Prevented errors on PHP caused by corrupted login timestamps

One Wordfence user reported an error on PHP 8, and upon investigation, we found that a timestamp for some user records contained invalid data instead of the expected timestamp. We don’t expect this to occur on other sites, but in case another plugin had modified the value, we now check the value before formatting it as a timestamp.

Fix: Prevented deprecation notices on PHP 8.2 related to dynamic properties

Future versions of PHP will no longer allow use of variables on an object unless they are previously declared. This is still allowed even in PHP 8.2, but PHP 8.2 can log a warning about the upcoming change, so Wordfence has been updated to declare a few variables where necessary, before using them.

Did you enjoy this post? Share it!

Source :
https://www.wordfence.com/blog/2022/11/wordfence-7-8-0-announcement/