When having trouble getting a good performance from your wireless router or access point, the first settings that people usually change is the WiFi channel. And it makes sense considering that it may be just a bit ‘too crowded’, so change the number, save and the WiFi speed should come back to life, right?
It is possible to see an increase in throughput, but you should never change the settings blindly, hoping that something may stick. I admit that I am guilty of doing just that some time ago, but the concept behind the WiFi channels doesn’t need to be mystifying. So let’s have a look at what they are, their relationship with the channel bandwidth and which should be the suitable settings for your network.
I am sure that most of you are familiar with the 2.4GHz and the 5GHz radio band, but you need to understand that they’re not some fixed frequency points, instead, they’re more like a spectrum of frequencies. The 2.4GHz has a range of frequencies from 2,402MHz to 2,483MHz and, when you tune to a specific frequency within this spectrum, you essentially are selecting a WiFi channel for your data transmission.
2.4GHz Channels – 20MHz channel bandwidth.
For example, the channel 1 is associated with the 2,412MHz (the range is between 2,401 to 2,423MHz), the channel two is 2,417MHz (2,406 to 2,428MHz range), channel 7 is 2,442MHz (2,431 to 2,453MHz range) and the channel 14 is 2,484MHz (2,473 to 2,495MHz range). As you can see, there is some overlapping in the frequency range between certain channels, but we’ll talk more about it in a minute. The range of 5GHz radio band spans between 5.035MHz and 5.980MHz.
This means that the channel 36 is associated with the 5,180MHz (the range between 5,170 and 5,190MHz), the channel 40 is 5,200MHz (between 5,190 and 5,210MHz) and channel 44 can be associated with the 5,220MHz frequency (the range between 5,210 and 5,230MHz). Now, let’s talk about overlapping and non-overlapping channels.
Overlapping vs non-overlapping channels
If you had a look at the channel representation that I put together for the 2.4GHz frequency band using the 20MHz WiFi channel bandwidth, you can see that three channels are different from the others. The channels 1, 6 and 11 are non-overlapping and you can see from the graph that if your APs are using these channels, then they’re far less prone to interference.
5GHz – Channel allocation.
To get an even better idea is to have a look at the graph representing the 5GHz channels and the way they’re grouped to create a larger channel bandwidth. We have talked about the two main types of interference, the co-channel and the adjacent channel interference when we analyzed the best channel bandwidth to use for the 5GHz band. And the idea is that when using the same channel, the devices will be forced to take turns, therefore slowing down the network.
But it’s also possible that the adjacent channels may bleed into each other, adding noise to the data, rendering the WiFi connection unusable. That’s why most people suggest to keep a less wide channel bandwidth and use non-overlapping channels if there are lots of APs in the area (which are not properly adjusted by a system admin).
Changing the channel, but not the channel bandwidth
We already know that changing the channel bandwidth will have a significant impact on the WiFi performance because 20MHz or 40MHz will deliver a far more stable throughput on the 5GHz frequency band (although not that high) in a crowded environment.
Multiple wireless access points.
But what happens when we change the WiFi channel, while keeping the same channel bandwidth? Again, it depends if you’re switching from overlapping to non-overlapping channels because doing so, you may see a noticeable increase in performance (just keep an eye on the available channels because the wider the channel bandwidth, the less the non-overlapping channels will be available for you to use). Now, in the ideal scenario, where there is no interference, when moving from one channel to the other within the same bandwidth shouldn’t really make that much of a difference in terms of data transfer rate.
Auto or manual WiFi channel selection?
The wireless routers and access points usually have the WiFi channel selection set to auto, which means that you may see that your neighbors change theirs annoyingly often. That’s because every time they restart the router/AP or there’s a power outage, the channel may be changed, so that it’s the least crowded available.
Abundance of Wireless Access Points.
If you choose yours manually, you will have to keep up with the changes to your neighboring WiFi networks, which is why it’s a good idea to keep the WiFi channel on your AP on auto as well. If we’re talking about an office or some large enterprise network, it’s obviously better to have full control on how the network behaves, so the manual selection is better.
When you should use DFS channels?
DFS stands for Dynamic Frequency Selection and it refers to those frequencies that are usually limited for military use or for radars (such as weather devices or airport equipment), which means that they can differ from country to country. So make sure to check whether you’re allowed to use certain channels (especially if you got the wireless router or AP from abroad), before you get a knock on your door. Also, it’s pretty much obvious that you won’t be able to use these channels if you live near an airport.
Engenius EWS850AP access point.
That being said, the main benefit to using DFS channels is that you are no longer impacted by interference from your neighbors WiFi. But do be aware that, depending on the router, there is a high chance that in case it detects a near-by radar using the same frequency, then it will switch to another WiFi channel automatically.
Also, there is another problem that I have often encountered. Not that many client devices will actually connect to a WiFi network that uses DFS channels, so you may find out that while your PC and smartphone continue to have access to the Internet, pretty much every other smart or IoT device will drop the connection.
I do get the question of whether the WiFi 6 routers have better range from time to time and my answer is that some do have a better range than the WiFi 5 router, while some don’t. It’s only normal that an expensive new piece of technology will behave better than an old, battle-scarred router. But, in general, are the WiFi 6 routers able to cover more space than the devices from the older WiFi generation?
Especially since we are promised that the OFDMA will just make everything way better, so just go and buy the new stuff, throw away the old! The idea behind the WiFi 6 standard (IEEE 802.11ax) was not really about speed or increased coverage, it was about handling a denser network, with a lot of very diverse client devices in an environment prone to lots of interference.
Abundance of Wireless Access Points.
As a consequence, you may see some benefits in regard to coverage and throughput, despite not really being the main aim. It’s clear that those that stand to get the most benefit are SMBs and especially the enterprise market, so why do Asus, Netgear, TP-Link and other home-network-based manufacturers keep on pushing WiFi 6 routers forward? The tempting response is money, which is true, but only partially.
We have started to get more denser networks even in our homes (smart and IoT devices) and living in a city means your neighbors will also add to the creation of denser networks, so WiFi 6 could make sense, right? With the correct client devices, yes and you may also see a better range. So, let’s do a slightly deeper dive into the subject and understand whether WiFi 6 routers have a better range in real-life conditions.
The main factors that can determine the range of a router can be considered the transmit power, the antenna gain and the interference in the area where the signal needs to travel. The SoC will also play an important role on the WiFi performance of the router.
1. The Transmit Power
I have covered this topic a bit in a separate article, where I discussed whether the user should adjust the transmit power to their access point or leave the default values. And the conclusion was that the default values are usually wrong and yes, you should adjust them in a manner as to get a more efficient network, even if it may seem that the coverage will suffer. But before that know that there are legal limitations to the transmit power.
The FCC says that the maximum transmitter output power that goes towards the antenna can go up to 1 Watt (30dBm), but the EIRP caps that limit to 36dBm. The EIRP is the sum between the maximum output power that goes towards the antenna and the antenna gain.
This means that the manufacturer is free to try different variations between the power output and the antenna gain as to better reach the client devices, while keeping that limit in mind. This factor has not changed from the previous WiFi standard, so, the WiFi 6 has the same limit put in place as the WiFi 5 (and the previous wireless standards). The advice is to still lower the transmit gain as much as possible for the 2.4GHz radio and to increase it to the maximum for the 5GHz radio. That’s because the former radiates a lot better through objects, while the latter does not, but it provides far better speeds.
2. The Antenna Gain
This ties in nicely with the previous section since, just like the output power, the antenna gain needs to be adjusted by the manufacturer within the limits dictated by the FCC. And there is an interesting thing that I noticed with the newer WiFi 6 routers, something that was not common with the previous gen routers. The antennas can’t be removed on most routers, only on the most expensive models.
This means that in most cases, you can’t upgrade the antennas, potentially having a better range. Before, you could take an older router, push the transmit power to the maximum (you could also push it past its hardware limits with DDWRT or some other third-party software) and then add some high-gain antennas.
Old TP-Link router.
This way, the range could have been better, but could you actually go past the allowed limit? The chipset inside the router most likely kept everything within the allowed limit, but you could still get closer to that limit. Would you see any benefit though? That’s another story because years ago, when there were way fewer wireless devices around, pushing everything to the maximum made sense due to the less amount of interference.
Nowadays, you’re just going to annoy your neighbors, while also making a mess of your WiFi clients connection. Sure, you will connect to a faraway client device, but will it be able to transfer data at a good speed? Doubt it, so it will just hog the entire network. The WiFi 6 standard does help alleviate this problem a bit, but we’ll talk more about it in a minute.
3. The WiFi Interference
This factor comes in different flavors. It can be from other devices that use the same channel, other access points that broadcast the signal through your house over the same channels or it can even be from your microwave. Ideally, you want to keep your WiFi inside your home, so that it doesn’t interfere with the WiFi signal from other routers or dedicated access points. Which is why the 5GHz radio has become the default option for connecting smartphones, laptops, TVs or PCs, while the 2.4GHz is usually left for the IoT devices.
Interesting antenna patterns to limit interference. Left: Zyxel WAX630S. Right Zyxel WAX650S.
At least this has been true for the WiFi 5 routers because the WiFi6 routers can use OFDMA on the 2.4GHz band and help push the throughput to spectacular levels (where it would actually be if there were little to no interference, it’s not an actual boost in speed). For example, the Asus RT-AX86U can reach up to 310Mbps at 5 feet (40MHz channel bandwidth), but very few routers implement it on both radios due to the cost constraints.
For example, the Ubiquiti U6-LR only uses OFDMA on the 5GHz radio band, further showing the tendency to leave the 2.4GHz for the IoT devices. Now let’s talk about the walls. There are two main behaviors that you need to keep in mind. First, there’s the obstacle aspect which is obvious since you can see that when you move your client device in another room than your router, the signal drops a bit. Moving it farther will add more attenuation and the speed will drop even more.
For example, I have an office that’s split into two by a very thick wall so, on paper, one router positioned in the middle should suffice for both sides, right? Not quite because this wall is very thick and made of concrete, so it works as a phenomenal signal blocker.
Asus AiMesh.
That’s why I needed two routers in the middle of the office to cover both sides effectively. The other aspect is signal reflection. What this means is that if you broadcast the signal in the open, it will reach let’s say up to 70 feet, but, if you broadcast it in a long hallway, you can get a great signal at the end of the hallway (could be double the distance than in the open field). But this also means that you may see some very weird, inconsistent coverage with your client devices.
What about the client devices?
This is a very important factor that is often overlooked when people talk about WiFi range and it’s incredibly important to understand the role of the network adapter especially in regard to the WiFi 6 client devices. First of all, understand that not all client devices are the same, some have a great receiver which can see the WiFi signal from very far away, others are very shy and want to be closer to the router. Then, there’s the specific features compatibility.
MU-MIMO, Beamforming and now the OFDMA have become a standard with newer routers, but, if the wireless client devices don’t support these features, it doesn’t really matter if they’re implemented or not. And this is one of the reasons why you may have noticed (even in my router tests) that a WiFi 5 client will most likely yield similar results when connected to a WiFi 5 router as well as when it’s connected to a WiFi 6 router. So, if you want to see improvements when using WiFi 6 routers, make sure that you have compatible adapters installed in your main client devices. Otherwise, there is no actual point to upgrading.
WiFi 6 adapter.
How can OFDMA improve range?
Yes, yes, I know OFDMA was not designed to improve the speed, nor the range of the network, but even so, the consequences of its optimizations are exactly these. A better throughput and a perceived far better range. The Orthogonal Frequency-Division Multiple Access breaks the channel frequency into smaller subcarriers, and it assigns them to individual clients.
So, while before, one client would start transmitting and every other client device had to wait until it was done, now, it’s possible to get multiple simultaneous data transmissions, greatly improving the efficiency of the network and significantly lowering the latency (which is excellent news for online gaming). I have talked about how a far-away client device can hog the network when I analyzed the best settings for the transmit power – that was because it would connect to the AP or router and transmit at a very low data speed rate.
Using OFDMA, in this type of scenario, it can improve the network behavior and, even if the range itself isn’t changed, due to the way the networks are so much denser nowadays, you’ll get a more efficient network behavior for both close and far away client devices. So yes, better range and more speed.
BSS Coloring to tame the interference
I already mentioned that the interference from other APs or wireless routers will have a major impact on the perceived range of your network.
And one of the reasons is the co-channel interference which occurs when multiple access points use the same channel and are therefore constrained to share it between them. As a consequence, you get a slower network because if there are lots of connected clients, they’ll easily fill up the available space. The BSS coloring assigns a color code to each client device which is then assigned to its closest access point.
This way, the signal broadcast is reduced from the client side as to not interfere with the other APs or client devices in the proximity. Obviously, the power output is still high enough to ensure a proper communication with the AP. And I know you haven’t seen this feature advertised as much on the boxes of APs or routers, which is due to cost constraints. I have seen it on the EnGenius EWS850AP, a WiFi 6 outdoors access point which is a device suitable for some very specific applications, but not on many other WiFi 6 networking devices.
Besides cost, the reason why it’s not that common especially on consumer-type WiFi 6 routers is that it’s not yet that useful. I say that because unless all the clients in the area are equipped with WiFi 6 adapters, the WiFi 5 (and lower) client devices will still broadcast their signal as far away as they can, interfering with the other WiFi devices.
Do WiFi 6 routers actually have a better range?
In an ideal, lab environment, most likely not, since as I said, the idea is to handle denser networks and not to push the WiFi range farther.
But in real-life conditions, you should see a far better perceived range if the right conditions are met. And almost everything revolves around using WiFi 6 client devices that can actually take advantage of these awesome features. It’s also wise to adjust the settings of your router or AP accordingly since the default values are very rarely good. Ideally, so should your neighbors since only this way, you will see a proper improvement in both range and network performance. Otherwise, there is barely any reason to upgrade from the WiFi 5 equipment.
At the same time, it’s worth checking out the WiFi 6E which adds a new frequency band, the 6GHz, which can actually increase the throughput in a spectacular manner since the radio is subjected to far less interference (the range doesn’t seem changed though). I have recently tested the EnGenius ECW336 which uses this new standard and yes, it’s a bit pricy, but Zyxel has released a new WiFi 6E AP that is a bit cheaper, and I will be testing it soon.
In light of the current global price hikes for energy, you’re very much justified in worrying about how many Watts your PoE switch actually uses. And, unless you have solar panels to enable your ‘lavish’ lifestyle, you’re going to have a bad time running too many networking devices at the same time, especially if they’re old and inefficient. But there’s the dilemma of features. For example, if we were to put two TVs together, an older one and a newer, it would be obvious that the latter would consume less power.
EnGenius ECS2512FP Switch with lots of Ethernet cables.
But, after adding all the new features and technologies which do require more power to be drawn, plus the higher price tag and it becomes clear that it’s less of an investment than we initially thought. Still, the manufacturers are clearly pushing the users towards the use of PoE instead of the power adapter – the newer Ubiquiti access points only have a PoE Ethernet port.
And it makes sense considering that they’re easier to install, without worrying about being close to a power source, no more used outlets and the possibility to have centralized control via a PoE switch. But, for some people, all these advantages may fall short if the power consumption of such a setup exceeds the acceptable threshold, so, for those of you conflicted about whether you should give PoE Ethernet switches a try, let’s see how much Watts they actually consume.
The PoE standard started being implemented into network switches about two decades ago and it became a bit more common for SMBs about 10 years ago. The first PoE switch that I tested was from Open Mesh (the S8) and it supported the IEEE 802.3at/af.
Open Mesh S8 Ethernet Switch.
This meant that the power output per port was 30 Watts, so it can’t really be considered an old switch (unless you take into account that Open Mesh doesn’t exist anymore). But I wanted to mention this switch because while the total power budget was 150 Watts, it did need to rely on a fan to keep the case cool. Very recently I tested the EnGenius ECS2512FP which offers almost double the PoE budget, 2.5GbE ports and it relies on passive cooling.
So, even if it may not seem so at first, even in the last five years, there have been significant advancements in regard to power efficiency. Indeed, a very old Ethernet switch that supports only the PoE 802.11af standard (15.4W limit per port) most likely needed to be cooled by fans and was not really built with the power efficiency aspect in mind. Before I get an angry mob to scream that the EEE from the IEEE stands for Energy-Efficient Ethernet, so adhering to the 802.3af standard should already ensure that the switch doesn’t consume that much power, I had another standard in mind.
Multiple wireless access points.
It’s the Green Ethernet from the 802.3az standard that made the difference with network switches that had lots of Ethernet ports. And this is an important technology because it makes sure that if a host has not been active for a long time, then the port to which is connected enters a sort of stand-by mode, where the power consumption is significantly reduced.
The port will become active again once there is activity from the client side, so the switch does ping the device from time to time (what I want to say is that the power is not completely turned off). So, if the network switch is older, it may not have this technology which means that you may lose a few dollars a month for this reason alone.
How many Watts does a PoE switch use by itself?
It depends on the PoE switch that you’re using. A 48-port switch that has three fans which run at full speed all the time is going to consume far more power than the 8-port unmanaged switch. You don’t have to believe me, let’s just check the numbers. I was lucky enough to still have the FS S3400-48T4SP around (it supports the 802.3af/at and has a maximum PoE budget of 370W), so I connected it to a power source and checked how many Watts it eats up when no device is connected to any of the 48 PoE ports.
FS S3400-48T4SP – 1st: no devices connected. 2nd: TP-Link EAP660 HD connected. 3rd: Both the EAP660 HD and the EAP670 connected.
It was 24.5 Watts which is surprisingly efficient considering the size of the switch and the four fans that run all the time. The manufacturer says that the maximum power consumption can be 400W, so the approx. 25W without any PoE device falls within the advertised amount. Next, I checked the power consumption of the Zyxel XS1930-12HP.
This switch is very particular because it has eight 10Gbps Ethernet ports and it supports the PoE++ standard (IEEE 802.3bt) which means that each port can offer up to 60W of PoE budget per device. At the same time, the maximum PoE budget is 375 Watts and, while no device was connected to any port, the Ethernet switch drew an average of 29 Watts (the switch does have two fans).
Zyxel XS1930-12HP – 1st: no devices connected. 2nd: TP-Link EAP660 HD connected. 3rd: Both the EAP660 HD and the EAP670 connected.
Yes, it’s more than the 48-port from FS, so it’s not always the case that having more ports means that there is a higher power consumption – obviously, more PoE devices will raise the overall power consumption.
Unmanaged vs Managed switches
Lastly, I checked out the power consumption of an unmanaged switch, the TRENDnet TPE-LG80 which has eight PoE ports, with a maximum budget of 65W. The PoE standards that are supported are the IEEE 802.3af and the IEEE 802.3at, so it can go up to 30W per port. That being said, the actual power consumption when there was no device connected was 3 Watts.
TRENDnet TPE-LG80 – 1st: no devices connected. 2nd: TP-Link EAP660 HD connected. 3rd: Both the EAP660 HD and the EAP670 connected.
Quite the difference when compared to the other two switches, but it was to be expected for a small unmanaged Gigabit PoE switch.
Access Points: PoE vs Power adapter
I am not going to bore you with details. You know what an access point is, and you also know that some have a power adapter, while some don’t. So, I took the TP-Link EAP660 HD and the EAP670 (because I had them left on the desk after testing them) and I checked if the power consumption differs between PoE and using the provided adapter. Also, I connected the APs to the three switches mentioned above to see if there’s a difference in PoE use between brands and between managed and unmanaged switches.
The TP-Link EAP660-HD draws an average of 6.9 Watts when connected to the socket via the power adapter. The EAP670 needs a bit less, since the average was 6.4 Watts. When connected to the 48-port FS S3400-48T4SP, the EAP660 HD needed 7.7W from the PoE budget, while the EAP670 added 7.6W, so, overall, the power consumption is more elevated. Moving on to the PoE++ Zyxel XS1930-12HP switch, I saw that adding the TP-Link EAP660HD, it required 10.5W and, connecting the EAP670 meant that an additional 6.8W which is quite the difference.
Comparison Access Points: PoE vs Power adapter.
Obviously, neither access points were connected to any client device, so there should be no extra overhead. In any case, we see that the PoE consumption is once again slightly more elevated than using the power adapters. Lastly, after connecting the EAP660 HD to the unmanaged TRENDnet TPE-LG80, the power consumption rose by 10 Watts, which is in line with the previous network switch. Adding the EAP670, it showed that an extra 6.8W were drawn, which is again, the same value as on the previous switch.
As a conclusion, we can see objectively that using the power adapter means less power consumption and that’s without taking into account the power needed to keep the switch itself alive.
Does the standard matter?
I won’t really extrapolate on all the available PoE switches on the market, but in my experience, it does seem that the PoE++ switches (those that support the 802.3at standard) do consume more power than the 802.3af/at switches, so yes, the standards do matter. Is it a significant difference?
The switches and the access points that I just tested.
Well, it can add up if you have lots of switches for lots of access points but bear in mind that most APs will work just fine with the 30W limitation in place, so, unless you need something very particular, I’m not sure that the PoE++ is mandatory. For now, since it’s going to become more widespread and efficient in time.
Passive cooled PoE switches vs Fans
This one is pretty obvious. Yes, fans do need more power than a passive cooling system, so, at least in the first minutes or hours, the advantage goes to the passive cooling. But things do change when the power supply and the components start to build heat which makes the entire system less efficient than the fan-cooling systems.
The spatial streams are connections made between the router and the client device where data is being sent. To get an even better grasp of what I am talking about, we need to go way back, down to the WiFi 3 (IEEE 802.11g standard) and lower which used what is called SISO systems (Single Input Single Output). The idea was to use a single transmitter antenna and the signal would get received by the access point on a single antenna.
And it’s true that the early days of WiFi routers were promising, but also quite rough because without clear line of sight, the AP could experience reflections of the signal in the room (multi-path fading), the risk to experience the cliff effect if there are too many interference and more. Obviously, these problems were mostly fixed with the emergence of the MIMO, which uses multiple transmission antennas to send the signal towards multiple reception antennas.
SISO (Single Input Single Output)
In other words, the slightly more modern approach is to use multiple spatial streams to send and receive the data. Then there’s the MU-MIMO which takes things to another level. And I know you came here to understand what the numbers on the router box actually mean, if MU-MIMO actually matters and if support for 4×4, 8×8 or 16×16 (and more) are something that your wireless router (or separate access point) needs to have. You will see that most of is just over-the-top advertising with little to no real-life improvements to the WiFi performance, so let’s see why that is. Before that, let’s get a better understanding of the spatial streams and MIMO.
We already established what the SISO is, but there are some other configurations that the manufacturers have explored before using the MIMO approach. For example, the SIMO (Single Input Multiple Output) uses more than one receiver antennas on the same radio to capture the signal, so it has more than one chances to be properly processed. And there’s also the MISO approach where the signal is broadcasted across more than one stream with a single antenna receiving it.
The MIMO is the better form, where the same signal is transmitted across multiple streams and it is also received by multiple antennas. But, it’s not that it chooses which signal is the better one, no, all get processed and the end result is what the receiver interprets to be the original signal based on what it received at different intervals, with various amounts of data loss and so on. What we previously discussed is called spatial diversity where the same signal gets transmitted across multiple spatial streams towards multiple antennas, therefore keeping the risk of degradation to the minimum, but there are other approaches as well.
MIMO – Spatial Diversity and Spatial Multiplexing.
One of them is called spatial multiplexing where the idea is to increase the data transfer rate since more than one independent stream of data is transmitted via multiple streams. The risk comes from interference which is why the data streams aren’t transmitted at the same time, but are phased out at different points in time. Another method that helps move data without risking collision or interference is by dividing the bandwidth into multiple frequency bands, each used to stream an independent and separate signal.
It’s also know as FDM, but I am sure you may have also heard about the OFDM which moved data a bit different. To make the bandwidth use even more efficient, the carriers are orthogonal. This means that instead of being far apart, as they were with the FDM, with the OFDM, they are more densely packed and the distance between carriers is minimal since there is little adjacent channel interference.
Spatial Streams and MU-MIMO
MU-MIMO (Multiple User Multiple Input Multiple Output) is supposed to be some sort of holy grail for handling multiple demanding client devices. That’s because while SU-MIMO (or MIMO) can handle one client device at a time, the MU-MIMO should serve more than one devices at the same time.
MU-MIMO – Linksys EA8500.
If you don’t yet know, the way the client devices are handled ‘in the traditional sense’ (SU-MIMO), is first arrived, first served. So, if the device is connected at a high data transfer rate, it receives or sends the data quickly and lets another device to be served. With the modern hardware, you won’t even notice that your WiFi devices actually take turns. That it, unless you start streaming large packets of data at the same time on multiple devices which is where you’re going to start seeing the buffering icon.
Furthermore, be aware that devices that are far away and are connected at a lower data transfer rate are going to slow down the network because it will take longer to finish up the task (which is why it’s better to avoid legacy devices and to not increase the transmit power on your access point).
MU-MIMO doesn’t really change the way it handles a single client, but it can do the same for more than one devices at the same time. Imagine that your router starts behaving as if it were two, four or more routers at the same time. This way, the client devices don’t have to wait one after the other. The problem is that MU-MIMO doesn’t seem to rise to the expectations. Yet.
Is MU-MIMO under performing?
On paper, it shouldn’t. And the router boxes do have the theoretical maximum data transfer rates printed in bold letters and numbers. So, the first culprit is the advertisement. You know that Asus, TP-Link, Linksys or Netgear router that seemingly should reach 6,000Mbps (AX6000) or more since we also have AX1100 routers now? Well, you’re not going to see those number in real life.
Netgear RAX43.
Actually if you’re checking the single stream performance, it most likely won’t even get close to 1Gbps. So, what’s the deal? Well, the manufacturers add up the maximum possible rate for each radio, which, in turn is based on the maximum amount of data streams that can be handled at the same time. This means that using MU-MIMO, you’re going to actually see a better performance? Well, not as much as you’d have hoped and in some cases, you may actually see a worse performance.
At least two sources (1)(2) have confirmed that not only did they not see a better performance when using MU-MIMO devices, but in some cases it was actually a bit worse. That’s not because the technology is bad, it’s because the WiFi adapters just aren’t that great. Most PC adapters, laptops and smartphones are still stuck with a 2×2 MU-MIMO WiFi adapter. And both Qualcomm and Broadcom chipsets seem to drop to 1×1 even if the client devices were 2×2, while the router was 4×4. These tests were done with WiFi 5 hardware, where MU-MIMO was limited to downstream only. So has anything changed with WiFi 6?
Besides adding support for MU-MIMO upstream as well, it does seem that MU-MIMO does offer some improvements with WiFi 6 client devices and access points, but only detrimental. So, it seems that MU-MIMO can be useful in only very specific scenarios, in a very crowded network, where the client devices don’t move around.
WiFi 6 adapter on a Desktop PC.
But, in most cases, it’s still a borderline gimmick that manufacturers like to put on their box to sell the router. That’s because the client devices are still way behind the WiFi technological advances and the consumer routers are underpowered. Still, if you have multiple 4×4 MU-MIMO PCs and a powerful WiFi 6 access points, you may see a benefit if your network is pushed to the limit.
Beamforming
You may have seen the term Beamforming being advertised alongside MU-MIMO on the wireless router / AP boxes and it refers to a very interesting technique where the signal is transmitted towards the connected clients and not broadcasted everywhere. The way the wireless routers (or access points) do this is by identifying the compatible receiver and then increasing the power output (including the transfer data rates) only towards that client device. The particularity of using Beamforming is that it’s effective only for medium-range transmissions.
If the client device is close enough to the router, then it’s already at a high transfer rate and it doesn’t need to use Beamforming. The same is true if the client device is too far because the gain from Beamforming will not be enough to increase the data transfer rate. But what’s even more interesting is that despite being advertised as a technology that’s going to change the way your devices connect to the network, it’s actually very rarely used with commercial devices. That’s because of the aforementioned antenna gain.
Source: TP-Link official website.
Beamforming works best with Point to Point access points because the idea is to focus the signal over very large distances with clear line of sight, without worrying about going above some set limit. Indoors, there is a limit set by EIRP and your access point or wireless router will make sure it won’t go above it. So, even if the Beamforming is able to push way past that limit (for example, three or four beamforming antennas can easily go past the 6dbi maximum gain), the transmit power will be severely cut.
But there is more because it seems that the WiFi 5 and WiFi 6 routers (and access points) will prioritize spatial multiplexing over beamforming, especially on the 4×4 and lower devices. Obviously, the one at a time approach still applies here as well, and the AP will switch dynamically between the supported modes when handling a client device. Even so, having the support for more multiple spatial streams, the better for the signal, right? Yes, the more spatial streams that are available, the more ways to properly transmit the data you will have, ensuring that it arrives at the destination quickly and as intact as possible.
Download the popular SSH tool PuTTy from the Internet.
Log in Yeastar S-Series IPPBX web interface, navigate to Settings > System > Security > Service, Enable SSH. And note that since version 30.7.0.27, the SSH password had been changed to random password which you could see when you enable the SSH service.
Open the PuTTy, and enter the login IP, Port and Connection type(SSH).
Host Name: IP address of the Yeastar S-Series IPPBX
Port: default SSH port is 8022
Set the scrollback line number so that you can get sufficient lines of log for debug analysis.
Click the Apply to enter SSH interface. Log in SSH with the following credential:
Username: support
Password: iyeastar (or random password)
Note: when you enter the password, it’s in invisible form that you can’t see what you are inputting.
Command Mode and Asterisk Mode
Next we introduce you the important 2 modes in SSH interface: Command mode and Asterisk mode. After you enter the SSH interface, it is the Command mode. In this mode, you can execute the Linux based commands, like ls, cd, route and so on.
To enter Asterisk mode, you can input asterisk -vvvvvvvvvr in Command mode. In this mode, you are able to execute the Asterisk based commands, like pjsip show endpoints, pjsip set logger on and so on.
Please noted if you change any of the port on the PBX should also change the port number on the router.
3. SIP ALG feature enabled on the router
The SIP ALG feature will manipulate the value in the sip SDP message and cause the Linkus client to send RTP to incorrect IP address or port.
4. Incorrect NAT settings on the PBX
When you login Linkus remotely like with cellular network, the NAT settings is used to tell Linkus client where to send the voice stream.
Local Network Identification is used to let PBX know the local IP segment like the IP segment for PBX or IP phones.
For example, the local IP address of the PBX or IP Phones is 192.168.9.x so you put 192.168.9.1/255.255.255.0 in the setting.
Also, need to check this configuration when you have 30s call disconnected issue with Linkus.
If you use domain or DDNS you can select the NAT Type to external host
5. Codec translation issue
Refer to this to guide enter Asterisk CLI: Asterisk CLI
Enter the command in Asterisk CLI ‘ core show translation paths ilbc ‘.
If it shows No Translation Path to G729 or ulaw, ulaw codec please submit a ticket on Yeastar Support Portal
6. RTP has been blocked by the router or the provider
You could try our LCS service.
Enable Linkus Cloud Service(LCS) on the Linkus Server. LCS use the tunnel to transmit data it does not needs to set port forwarding on the router and more secure.
For now, Linkus still have no voice issue with the Etisalat Carrier in Dubai.
Welcome to the sixteenth edition of Cloudflare’s DDoS Threat Report. This edition covers DDoS trends and key findings for the fourth and final quarter of the year 2023, complete with a review of major trends throughout the year.
What are DDoS attacks?
DDoS attacks, or distributed denial-of-service attacks, are a type of cyber attack that aims to disrupt websites and online services for users, making them unavailable by overwhelming them with more traffic than they can handle. They are similar to car gridlocks that jam roads, preventing drivers from getting to their destination.
There are three main types of DDoS attacks that we will cover in this report. The first is an HTTP request intensive DDoS attack that aims to overwhelm HTTP servers with more requests than they can handle to cause a denial of service event. The second is an IP packet intensive DDoS attack that aims to overwhelm in-line appliances such as routers, firewalls, and servers with more packets than they can handle. The third is a bit-intensive attack that aims to saturate and clog the Internet link causing that ‘gridlock’ that we discussed. In this report, we will highlight various techniques and insights on all three types of attacks.
Previous editions of the report can be found here, and are also available on our interactive hub, Cloudflare Radar. Cloudflare Radar showcases global Internet traffic, attacks, and technology trends and insights, with drill-down and filtering capabilities for zooming in on insights of specific countries, industries, and service providers. Cloudflare Radar also offers a free API allowing academics, data sleuths, and other web enthusiasts to investigate Internet usage across the globe.
To learn how we prepare this report, refer to our Methodologies.
Key findings
In Q4, we observed a 117% year-over-year increase in network-layer DDoS attacks, and overall increased DDoS activity targeting retail, shipment and public relations websites during and around Black Friday and the holiday season.
In Q4, DDoS attack traffic targeting Taiwan registered a 3,370% growth, compared to the previous year, amidst the upcoming general election and reported tensions with China. The percentage of DDoS attack traffic targeting Israeli websites grew by 27% quarter-over-quarter, and the percentage of DDoS attack traffic targeting Palestinian websites grew by 1,126% quarter-over-quarter — as the military conflict between Israel and Hamas continues.
In Q4, there was a staggering 61,839% surge in DDoS attack traffic targeting Environmental Services websites compared to the previous year, coinciding with the 28th United Nations Climate Change Conference (COP 28).
For an in-depth analysis of these key findings and additional insights that could redefine your understanding of current cybersecurity challenges, read on!
Illustration of a DDoS attack
Hyper-volumetric HTTP DDoS attacks
2023 was the year of uncharted territories. DDoS attacks reached new heights — in size and sophistication. The wider Internet community, including Cloudflare, faced a persistent and deliberately engineered campaign of thousands of hyper-volumetric DDoS attacks at never before seen rates.
These attacks were highly complex and exploited an HTTP/2 vulnerability. Cloudflare developed purpose-built technology to mitigate the vulnerability’s effect and worked with others in the industry to responsibly disclose it.
As part of this DDoS campaign, in Q3 our systems mitigated the largest attack we’ve ever seen — 201 million requests per second (rps). That’s almost 8 times larger than our previous 2022 record of 26 million rps.
Largest HTTP DDoS attacks as seen by Cloudflare, by year
Growth in network-layer DDoS attacks
After the hyper-volumetric campaign subsided, we saw an unexpected drop in HTTP DDoS attacks. Overall in 2023, our automated defenses mitigated over 5.2 million HTTP DDoS attacks consisting of over 26 trillion requests. That averages at 594 HTTP DDoS attacks and 3 billion mitigated requests every hour.
Despite these astronomical figures, the amount of HTTP DDoS attack requests actually declined by 20% compared to 2022. This decline was not just annual but was also observed in 2023 Q4 where the number of HTTP DDoS attack requests decreased by 7% YoY and 18% QoQ.
On the network-layer, we saw a completely different trend. Our automated defenses mitigated 8.7 million network-layer DDoS attacks in 2023. This represents an 85% increase compared to 2022.
In 2023 Q4, Cloudflare’s automated defenses mitigated over 80 petabytes of network-layer attacks. On average, our systems auto-mitigated 996 network-layer DDoS attacks and 27 terabytes every hour. The number of network-layer DDoS attacks in 2023 Q4 increased by 175% YoY and 25% QoQ.
HTTP and Network-layer DDoS attacks by quarter
DDoS attacks increase during and around COP 28
In the final quarter of 2023, the landscape of cyber threats witnessed a significant shift. While the Cryptocurrency sector was initially leading in terms of the volume of HTTP DDoS attack requests, a new target emerged as a primary victim. The Environmental Services industry experienced an unprecedented surge in HTTP DDoS attacks, with these attacks constituting half of all its HTTP traffic. This marked a staggering 618-fold increase compared to the previous year, highlighting a disturbing trend in the cyber threat landscape.
This surge in cyber attacks coincided with COP 28, which ran from November 30th to December 12th, 2023. The conference was a pivotal event, signaling what many considered the ‘beginning of the end’ for the fossil fuel era. It was observed that in the period leading up to COP 28, there was a noticeable spike in HTTP attacks targeting Environmental Services websites. This pattern wasn’t isolated to this event alone.
Looking back at historical data, particularly during COP 26 and COP 27, as well as other UN environment-related resolutions or announcements, a similar pattern emerges. Each of these events was accompanied by a corresponding increase in cyber attacks aimed at Environmental Services websites.
In February and March 2023, significant environmental events like the UN’s resolution on climate justice and the launch of United Nations Environment Programme’s Freshwater Challenge potentially heightened the profile of environmental websites, possibly correlating with an increase in attacks on these sites.
This recurring pattern underscores the growing intersection between environmental issues and cyber security, a nexus that is increasingly becoming a focal point for attackers in the digital age.
DDoS attacks and Iron Swords
It’s not just UN resolutions that trigger DDoS attacks. Cyber attacks, and particularly DDoS attacks, have long been a tool of war and disruption. We witnessed an increase in DDoS attack activity in the Ukraine-Russia war, and now we’re also witnessing it in the Israel-Hamas war. We first reported the cyber activity in our report Cyber attacks in the Israel-Hamas war, and we continued to monitor the activity throughout Q4.
DDoS attacks targeting Israeli and Palestinian websites, by industry
Relative to each region’s traffic, the Palestinian territories was the second most attacked region by HTTP DDoS attacks in Q4. Over 10% of all HTTP requests towards Palestinian websites were DDoS attacks, a total of 1.3 billion DDoS requests — representing a 1,126% increase in QoQ. 90% of these DDoS attacks targeted Palestinian Banking websites. Another 8% targeted Information Technology and Internet platforms.
Top attacked Palestinian industries
Similarly, our systems automatically mitigated over 2.2 billion HTTP DDoS requests targeting Israeli websites. While 2.2 billion represents a decrease compared to the previous quarter and year, it did amount to a larger percentage out of the total Israel-bound traffic. This normalized figure represents a 27% increase QoQ but a 92% decrease YoY. Notwithstanding the larger amount of attack traffic, Israel was the 77th most attacked region relative to its own traffic. It was also the 33rd most attacked by total volume of attacks, whereas the Palestinian territories was 42nd.
Of those Israeli websites attacked, Newspaper & Media were the main target — receiving almost 40% of all Israel-bound HTTP DDoS attacks. The second most attacked industry was the Computer Software industry. The Banking, Financial Institutions, and Insurance (BFSI) industry came in third.
Top attacked Israeli industries
On the network layer, we see the same trend. Palestinian networks were targeted by 470 terabytes of attack traffic — accounting for over 68% of all traffic towards Palestinian networks. Surpassed only by China, this figure placed the Palestinian territories as the second most attacked region in the world, by network-layer DDoS attack, relative to all Palestinian territories-bound traffic. By absolute volume of traffic, it came in third. Those 470 terabytes accounted for approximately 1% of all DDoS traffic that Cloudflare mitigated.
Israeli networks, though, were targeted by only 2.4 terabytes of attack traffic, placing it as the 8th most attacked country by network-layer DDoS attacks (normalized). Those 2.4 terabytes accounted for almost 10% of all traffic towards Israeli networks.
Top attacked countries
When we turned the picture around, we saw that 3% of all bytes that were ingested in our Israeli-based data centers were network-layer DDoS attacks. In our Palestinian-based data centers, that figure was significantly higher — approximately 17% of all bytes.
On the application layer, we saw that 4% of HTTP requests originating from Palestinian IP addresses were DDoS attacks, and almost 2% of HTTP requests originating from Israeli IP addresses were DDoS attacks as well.
Main sources of DDoS attacks
In the third quarter of 2022, China was the largest source of HTTP DDoS attack traffic. However, since the fourth quarter of 2022, the US took the first place as the largest source of HTTP DDoS attacks and has maintained that undesirable position for five consecutive quarters. Similarly, our data centers in the US are the ones ingesting the most network-layer DDoS attack traffic — over 38% of all attack bytes.
HTTP DDoS attacks originating from China and the US by quarter
Together, China and the US account for a little over a quarter of all HTTP DDoS attack traffic in the world. Brazil, Germany, Indonesia, and Argentina account for the next twenty-five percent.
Top source of HTTP DDoS attacks
These large figures usually correspond to large markets. For this reason, we also normalize the attack traffic originating from each country by comparing their outbound traffic. When we do this, we often get small island nations or smaller market countries that a disproportionate amount of attack traffic originates from. In Q4, 40% of Saint Helena’s outbound traffic were HTTP DDoS attacks — placing it at the top. Following the ‘remote volcanic tropical island’, Libya came in second, Swaziland (also known as Eswatini) in third. Argentina and Egypt follow in fourth and fifth place.
Top source of HTTP DDoS attacks with respect to each country’s traffic
On the network layer, Zimbabwe came in first place. Almost 80% of all traffic we ingested in our Zimbabwe-based data center was malicious. In second place, Paraguay, and Madagascar in third.
Top source of Network-layer DDoS attacks with respect to each country’s traffic
Most attacked industries
By volume of attack traffic, Cryptocurrency was the most attacked industry in Q4. Over 330 billion HTTP requests targeted it. This figure accounts for over 4% of all HTTP DDoS traffic for the quarter. The second most attacked industry was Gaming & Gambling. These industries are known for being coveted targets and attract a lot of traffic and attacks.
Top industries targeted by HTTP DDoS attacks
On the network layer, the Information Technology and Internet industry was the most attacked — over 45% of all network-layer DDoS attack traffic was aimed at it. Following far behind were the Banking, Financial Services and Insurance (BFSI), Gaming & Gambling, and Telecommunications industries.
Top industries targeted by Network-layer DDoS attacks
To change perspectives, here too, we normalized the attack traffic by the total traffic for a specific industry. When we do that, we get a different picture.
Top attacked industries by HTTP DDoS attacks, by region
We already mentioned in the beginning of this report that the Environmental Services industry was the most attacked relative to its own traffic. In second place was the Packaging and Freight Delivery industry, which is interesting because of its timely correlation with online shopping during Black Friday and the winter holiday season. Purchased gifts and goods need to get to their destination somehow, and it seems as though attackers tried to interfere with that. On a similar note, DDoS attacks on retail companies increased by 16% compared to the previous year.
Top industries targeted by HTTP DDoS attacks with respect to each industry’s traffic
On the network layer, Public Relations and Communications was the most targeted industry — 36% of its traffic was malicious. This too is very interesting given its timing. Public Relations and Communications companies are usually linked to managing public perception and communication. Disrupting their operations can have immediate and widespread reputational impacts which becomes even more critical during the Q4 holiday season. This quarter often sees increased PR and communication activities due to holidays, end-of-year summaries, and preparation for the new year, making it a critical operational period — one that some may want to disrupt.
Top industries targeted by Network-layer DDoS attacks with respect to each industry’s traffic
Most attacked countries and regions
Singapore was the main target of HTTP DDoS attacks in Q4. Over 317 billion HTTP requests, 4% of all global DDoS traffic, were aimed at Singaporean websites. The US followed closely in second and Canada in third. Taiwan came in as the fourth most attacked region — amidst the upcoming general elections and the tensions with China. Taiwan-bound attacks in Q4 traffic increased by 847% compared to the previous year, and 2,858% compared to the previous quarter. This increase is not limited to the absolute values. When normalized, the percentage of HTTP DDoS attack traffic targeting Taiwan relative to all Taiwan-bound traffic also significantly increased. It increased by 624% quarter-over-quarter and 3,370% year-over-year.
Top targeted countries by HTTP DDoS attacks
While China came in as the ninth most attacked country by HTTP DDoS attacks, it’s the number one most attacked country by network-layer attacks. 45% of all network-layer DDoS traffic that Cloudflare mitigated globally was China-bound. The rest of the countries were so far behind that it is almost negligible.
Top targeted countries by Network-layer DDoS attacks
When normalizing the data, Iraq, Palestinian territories, and Morocco take the lead as the most attacked regions with respect to their total inbound traffic. What’s interesting is that Singapore comes up as fourth. So not only did Singapore face the largest amount of HTTP DDoS attack traffic, but that traffic also made up a significant amount of the total Singapore-bound traffic. By contrast, the US was second most attacked by volume (per the application-layer graph above), but came in the fiftieth place with respect to the total US-bound traffic.
Top targeted countries by HTTP DDoS attacks with respect to each country’s traffic
Similar to Singapore, but arguably more dramatic, China is both the number one most attacked country by network-layer DDoS attack traffic, and also with respect to all China-bound traffic. Almost 86% of all China-bound traffic was mitigated by Cloudflare as network-layer DDoS attacks. The Palestinian territories, Brazil, Norway, and again Singapore followed with large percentages of attack traffic.
Top targeted countries by Network-layer DDoS attacks with respect to each country’s traffic
Attack vectors and attributes
The majority of DDoS attacks are short and small relative to Cloudflare’s scale. However, unprotected websites and networks can still suffer disruption from short and small attacks without proper inline automated protection — underscoring the need for organizations to be proactive in adopting a robust security posture.
In 2023 Q4, 91% of attacks ended within 10 minutes, 97% peaked below 500 megabits per second (mbps), and 88% never exceeded 50 thousand packets per second (pps).
Two out of every 100 network-layer DDoS attacks lasted more than an hour, and exceeded 1 gigabit per second (gbps). One out of every 100 attacks exceeded 1 million packets per second. Furthermore, the amount of network-layer DDoS attacks exceeding 100 million packets per second increased by 15% quarter-over-quarter.
DDoS attack stats you should know
One of those large attacks was a Mirai-botnet attack that peaked at 160 million packets per second. The packet per second rate was not the largest we’ve ever seen. The largest we’ve ever seen was 754 million packets per second. That attack occurred in 2020, and we have yet to see anything larger.
This more recent attack, though, was unique in its bits per second rate. This was the largest network-layer DDoS attack we’ve seen in Q4. It peaked at 1.9 terabits per second and originated from a Mirai botnet. It was a multi-vector attack, meaning it combined multiple attack methods. Some of those methods included UDP fragments flood, UDP/Echo flood, SYN Flood, ACK Flood, and TCP malformed flags.
This attack targeted a known European Cloud Provider and originated from over 18 thousand unique IP addresses that are assumed to be spoofed. It was automatically detected and mitigated by Cloudflare’s defenses.
This goes to show that even the largest attacks end very quickly. Previous large attacks we’ve seen ended within seconds — underlining the need for an in-line automated defense system. Though still rare, attacks in the terabit range are becoming more and more prominent.
1.9 Terabit per second Mirai DDoS attacks
The use of Mirai-variant botnets is still very common. In Q4, almost 3% of all attacks originate from Mirai. Though, of all attack methods, DNS-based attacks remain the attackers’ favorite. Together, DNS Floods and DNS Amplification attacks account for almost 53% of all attacks in Q4. SYN Flood follows in second and UDP floods in third. We’ll cover the two DNS attack types here, and you can visit the hyperlinks to learn more about UDP and SYN floods in our Learning Center.
DNS floods and amplification attacks
DNS floods and DNS amplification attacks both exploit the Domain Name System (DNS), but they operate differently. DNS is like a phone book for the Internet, translating human-friendly domain names like “www.cloudfare.com” into numerical IP addresses that computers use to identify each other on the network.
Simply put, DNS-based DDoS attacks comprise the method computers and servers used to identify one another to cause an outage or disruption, without actually ‘taking down’ a server. For example, a server may be up and running, but the DNS server is down. So clients won’t be able to connect to it and will experience it as an outage.
A DNS flood attack bombards a DNS server with an overwhelming number of DNS queries. This is usually done using a DDoS botnet. The sheer volume of queries can overwhelm the DNS server, making it difficult or impossible for it to respond to legitimate queries. This can result in the aforementioned service disruptions, delays or even an outage for those trying to access the websites or services that rely on the targeted DNS server.
On the other hand, a DNS amplification attack involves sending a small query with a spoofed IP address (the address of the victim) to a DNS server. The trick here is that the DNS response is significantly larger than the request. The server then sends this large response to the victim’s IP address. By exploiting open DNS resolvers, the attacker can amplify the volume of traffic sent to the victim, leading to a much more significant impact. This type of attack not only disrupts the victim but also can congest entire networks.
In both cases, the attacks exploit the critical role of DNS in network operations. Mitigation strategies typically include securing DNS servers against misuse, implementing rate limiting to manage traffic, and filtering DNS traffic to identify and block malicious requests.
Top attack vectors
Amongst the emerging threats we track, we recorded a 1,161% increase in ACK-RST Floods as well as a 515% increase in CLDAP floods, and a 243% increase in SPSS floods, in each case as compared to last quarter. Let’s walk through some of these attacks and how they’re meant to cause disruption.
Top emerging attack vectors
ACK-RST floods
An ACK-RST Flood exploits the Transmission Control Protocol (TCP) by sending numerous ACK and RST packets to the victim. This overwhelms the victim’s ability to process and respond to these packets, leading to service disruption. The attack is effective because each ACK or RST packet prompts a response from the victim’s system, consuming its resources. ACK-RST Floods are often difficult to filter since they mimic legitimate traffic, making detection and mitigation challenging.
CLDAP floods
CLDAP (Connectionless Lightweight Directory Access Protocol) is a variant of LDAP (Lightweight Directory Access Protocol). It’s used for querying and modifying directory services running over IP networks. CLDAP is connectionless, using UDP instead of TCP, making it faster but less reliable. Because it uses UDP, there’s no handshake requirement which allows attackers to spoof the IP address thus allowing attackers to exploit it as a reflection vector. In these attacks, small queries are sent with a spoofed source IP address (the victim’s IP), causing servers to send large responses to the victim, overwhelming it. Mitigation involves filtering and monitoring unusual CLDAP traffic.
SPSS floods
Floods abusing the SPSS (Source Port Service Sweep) protocol is a network attack method that involves sending packets from numerous random or spoofed source ports to various destination ports on a targeted system or network. The aim of this attack is two-fold: first, to overwhelm the victim’s processing capabilities, causing service disruptions or network outages, and second, it can be used to scan for open ports and identify vulnerable services. The flood is achieved by sending a large volume of packets, which can saturate the victim’s network resources and exhaust the capacities of its firewalls and intrusion detection systems. To mitigate such attacks, it’s essential to leverage in-line automated detection capabilities.
Cloudflare is here to help – no matter the attack type, size, or duration
Cloudflare’s mission is to help build a better Internet, and we believe that a better Internet is one that is secure, performant, and available to all. No matter the attack type, the attack size, the attack duration or the motivation behind the attack, Cloudflare’s defenses stand strong. Since we pioneered unmetered DDoS Protection in 2017, we’ve made and kept our commitment to make enterprise-grade DDoS protection free for all organizations alike — and of course, without compromising performance. This is made possible by our unique technology and robust network architecture.
It’s important to remember that security is a process, not a single product or flip of a switch. Atop of our automated DDoS protection systems, we offer comprehensive bundled features such as firewall, bot detection, API protection, and caching to bolster your defenses. Our multi-layered approach optimizes your security posture and minimizes potential impact. We’ve also put together a list of recommendations to help you optimize your defenses against DDoS attacks, and you can follow our step-by-step wizards to secure your applications and prevent DDoS attacks. And, if you’d like to benefit from our easy to use, best-in-class protection against DDoS and other attacks on the Internet, you can sign up — for free! — at cloudflare.com. If you’re under attack, register or call the cyber emergency hotline number shown here for a rapid response.
Visit 1.1.1.1 from any device to get started with our free app that makes your Internet faster and safer.
To learn more about our mission to help build a better Internet, start here. If you’re looking for a new career direction, check out our open positions.
WRITTEN BY THE CLOUDINARY TEAM FEB-07-2023 7 MIN READ
Post-pandemic, consumer reliance on online shopping remains steady, meaning e-commerce businesses need to continue to adopt new technologies to scale their business operations.
Digital Asset Management (DAM) software can make it easier for creators to store, search, and organize their assets. Unfortunately, legacy DAM solutions are no longer sufficient to manage large volumes of product-related content. After all, using ‘old school’ DAM software requires a large staff who can manually optimize media and customize experiences for their audience—a practice that goes against agile methodology.
Staying competitive in today’s e-commerce environment requires brands to harness the power of AI and the efficiency of automation. A business using AI can quickly match audiences to relevant products and edit assets on the fly, creating more convenient and personalized shopping experiences. On the back-end, automation simplifies asset management, saving time and resources while increasing sales efficiency and marketing effectiveness.
During the pandemic, the US saw a 50% increase in e-commerce sales. This rapid shift to online shopping forced many businesses to find new asset management solutions. The right tool saves time for creative teams by taking on the labor involved in cropping, tagging, recoloring, background removal, and numerous other tedious tasks. AI tools can also automate higher-level functions, performing object recognition and asset categorization and efficiently organizing even legacy datasets.
Together, these tools free up a marketing team to address more strategic concerns, like finding opportunities to generate interest across new sales channels and touchpoints.
E-commerce activity generates a lot of data that can be used for discovery. However, creators and developers can’t use what they can’t access, and studies show that 73% of data is never used for analytics. This wasted data is more than just lost revenue: Storing and transmitting data is expensive and also poses environmental concerns. To optimize asset delivery and extract the most valuable data from e-commerce activity, businesses must enhance their DAM tools with AI and automation.
Let’s look at how AI and automation can help an e-commerce business achieve greater customer satisfaction, higher revenue, lower costs, happier employees, and more efficient and agile business operations.
Many websites collect cookies to track their customers’ buying patterns and enable personalized product recommendations. AI can analyze this information, so we can use it to automate outreach and customize customer campaigns and newsletters.
Effective tools can provide extensible APIs to automate DAM and target specific user segments and devices. For example, Cloudinary’s Admin API lets you retrieve and manipulate asset metadata as part of an automated pipeline. In conjunction with Cloudinary’s object detection tools, it’s a powerful tool to modernize legacy databases.
Most companies offer flexible return policies to stay competitive in a market where customers cannot appraise a product in person before purchase. It’s expensive to provide the customer with this freedom—product returns cost companies millions of dollars annually.
One of the most common reasons customers return products is because they feel they’ve received something different than what they saw before purchase, which could occur if the product page had insufficient photos or poor-quality images. For an e-commerce retailer, saving money by taking fewer photos is a false economy; a loss of revenue and the cost of processing returns can offset any savings.
AI-powered content creation helps ensure customers are happy with their purchases. For example, Cloudinary’s image and video transformation API provides a suite of tools to generate high-quality derivative assets from a small number of product images. For example, suppose you’re selling a sweater in a range of colors. Cloudinary’s image transformation API enables us to recolor a photo of it, so the product team only needs to photograph it once.
AI is also a powerful tool for matching visitors to the products they’re most likely to buy. By combining in-session user behavior patterns with cookies, an AI-based system can recommend appropriately sized clothing that matches the customer’s style.
Then, when a potential buyer is matched to a product, we can use AI-powered tools to generate interest. For example, on Mazda’s purchase page, customers can apply 3D model transformation functions to create a 360-degree view of their vehicle build with all the personalized upgrade options and the color they’ve selected.
AI also enables customers to preview personalized products. If a clothing retailer offers the option to add a custom inscription or design, for example, then an AI-powered displacement map can show what the final product will look like much more clearly than a simple overlay.
We can implement much of this functionality with a tool like Cloudinary’s content-aware object detection add-on. When used alongside the AI-powered background removal tool, we can generate and edit image assets for any context. For instance, consider an automotive manufacturer with a database of automotive add-ons. An AI could analyze image assets and apply smart tags to categorize product options. If the manufacturer offers numerous upgrade options across a range of a dozen or more vehicles, this will save a lot of time and work. The technology can even help with cleaning up legacy databases and regaining control over lost or mislabeled assets.
A well-organized asset database also creates happier customers. Suppose visitors to our storefront have access to a search field or chatbot for queries. In that case, we can combine this data with user behavior data we collected earlier and compare it against our meticulously and automatically tagged and organized product catalog.
As we integrate AI tools more deeply into our supply chain, we can also expect more efficient fulfillment as we optimize for customer preference, location, and even local weather. For example, we can integrate Cloudinary-managed assets with Next.js Middleware in Netlify to find out where visitors are located and inject shipping information. If customers find the status updates useful, they’re more likely to become repeat buyers.
AI also helps build customer trust. AI-powered tools can automatically synchronize sales across multiple devices, identify high-risk transactions, and offer discounts to loyal customers more intelligently than rule-based implementations would. We can even use virtual assistants to handle administrative tasks that impact the end-user experience.
For example, AI can help a storefront become more responsive by determining which media assets should be cached locally in a Content Delivery Network (CDN) or by identifying the most routine customer queries and offloading them to automated chatbots. An apparel storefront can provide a more bespoke experience by offering AI-powered fit and sizing assistance or even suggestions for complementary wardrobe choices.
When a customer decides to purchase, AI can help us ensure we’ve minimized human error in the inventory handling and fulfillment stages. If our product has a loyal following, we can keep customers engaged by providing AI-optimized, up-to-date stock arrival notifications.
If we allow end users to create their own content, such as photos in product reviews (or if we’re using AI to pull from external content stores), we should use a tool like Cloudinary’s asset moderation. Depending on the type and volume of content, we can configure these add-ons to flag content for manual or automatic review or a combination of both. For instance, we might want to automatically reject some content, such as low-quality images or images that have not been anonymized. Other content might need human approval, such as automatically smart-tagged product images.
To be competitive in sales within a digital ecosystem, you often need to analyze trends in external data. AI tools help us stay competitive with comprehensive industry monitoring and analysis. Rather than manually searching for a competitive edge, we can feed raw data into our models and expect better insights—notably, often without needing to perform the tedious process of data normalization.
Another common necessity of e-commerce businesses—namely, complex integrations—can break continuity between upstream and downstream portions of the sales pipeline, especially when integrating legacy applications. This process can create extra work and delays for the sales team, who either have to troubleshoot integrations or rely on support teams or developer teams to make changes. AI-powered automation can solve this issue and create a more extensible and easy-to-use pipeline for the sales team.
In an e-commerce business, payroll, accounting, and invoicing are all digital (and often cloud-first) processes. This makes them ideally suited to administrative automation and AI.
Cloudinary’s broad set of integrations enables Cloudinary-managed assets to be deployed through commercial platforms, like Adobe Commerce (formerly Magento) or Salesforce. We get the benefits of the financial tooling of top e-commerce and marketing frameworks while delivering quality, relevant content that’s been automatically curated by asset management technologies.
To grow an e-commerce business in a cloud-first world, you need the help of cutting-edge technologies. In the DAM space, AI can make the difference between a digital storefront that needs constant manual labor to stay effective and an e-commerce business that’s ready to sail the tide of internet commerce. To start integrating AI into your business plan, visit Cloudinary today.
This article helps answer frequently asked questions regarding SonicOS 7.1.1.
Q. What is SonicOS 7.1.1? A. SonicOS 7.1.1 is the feature release available on all Gen 7 firewalls which brings in new capabilities around security, content filtering, integrations and virtual platforms.
Q. Will we be able to manage SonicOS 7.1 from NSM 2.3.5? A. NSM 2.3.5 will not support SonicOS 7.1. The support for SonicOS 7.1 will be available from NSM 2.4.0, which will be released early next year (2024). Please read the following article on NSM Compatibility with SonicOS 7.1.
Q. What are the new features available on SonicOS 7.1.1? A. The major features implemented in SonicOS 7.1.1 are DNS Filtering, reputation-based content filtering, Wi-Fi 6 access-point management, Network Access Control (NAC) integration with Aruba ClearPass, NSv bootstrapping, auto-update firmware and some other enhancements with storage and user interface (UI) for ease of use.
Q. How can existing firewall customers running SonicOS 7 upgrade/migrate to SonicOS 7.1.1? A. You can upgrade the firewall to SonicOS 7.1 on box without using a migration tool.
Q. How can existing firewall customers running SonicOS6.5 and previous versions upgrade to SonicOS 7.1.1? A. Users will be required to make use of our Secure Upgrade Program to upgrade their existing hardware models to Gen 7. They will then need to migrate their settings to the new firewall running 7.1.1 OS Learn more about the Secure Upgrade Program
Q. Are there any new features in 7.1.1 that will require new licenses? A. The DNS Filtering feature is a licensed feature that will be available as an a la carte license for Gen 7 firewalls without the APSS bundle.
Q. Do I need any additional licensing if I already have the APSS license available on my current Gen 7 firewall? A. No.
Q. Can I perform a firmware/OS upgrade on my existing NSv NGFW running SonicOS 7.1.1? A. The downgrade of firmware from SonicOS 7.1 to SonicOS 7.0 is not supported. Please refer to this article when upgrading your firewall: How can I upgrade SonicOS Firmware?
Q. Is there any change in behavior with regard to Policy Mode with 7.1.1? A. There is no change in behavior with regard to Policy Mode in SonicOS 7.1.1. The NSv 270, 470 and 870 will continue to support both Global and Policy Mode. The NSsp15700 will continue to support only Policy Mode.
Q. What is CFS 5.0? How does it differ from CFS 4.0? A. Content Filtering Service 5.0 brings category extension with CFS 4.0. SonicOS 7.0.1 supported 64 categories and that has been increased to 89. Content Filtering 5.0 brings in performance improvements along with reputation-based blocking.
Q. What is upgrade behavior when a user upgrades from SonicOS 7.0.1 to SonicOS 7.1.1 with regard to CFS policies? A. There will be no impact on the existing CFS policies, however as CFS 5.0 brings in reputation-based blocking, users will be required to configure the CFS policies with the new reputation parameter in CFS 5.0. Please refer to this upgrade article.
Q. Can we downgrade the firewall from SonicOS 7.1 to SonicOS 7.0? A. The downgrade of firmware from SonicOS 7.1 to SonicOS 7.0 is not supported. Please refer to this article when upgrading your firewall.
Q. What is DNS Filtering? How is it different from the current DNS capabilities in SonicOS 7.0.1? A. DNS Filtering inspects the DNS traffic in real time and provides the ability to block threats and access to malicious websites. DNS Filtering blocks threats before they can reach your network. The DNS security capabilities on 7.0.1 include DNS Tunnel Detection and DNS Sinkholes. Please read DNS Security to understand them in detail.
Q. What is the upgrade behavior when users upgrade from SonicOS 7.0.1 to SonicOS 7.1.1 with regard to DNS proxy and sink-holing? A. The upgrade from SonicOS 7.0.1 to SonicOS 7.1.1 would have no impact on the behavior that was there previous to the SonicOS 7.1 upgrade.
Q. What does the NAC integration feature do? A. SonicWall Next-Generation Firewalls (NGFWs) provide Restful threat API which integrates with Aruba ClearPass as network access control (NAC). ClearPass can pass the security context vectors using the restful API which is included with SonicWall NGFWs. ClearPass can pass security context vectors including Source IP, Source MAC, User ID, User Role, Domain, Device Category, Device Family, Device Name, OS Type, Hostname and Health Posture to SonicWall NGFWs to enforce real-time rules based on Device Type, OS and Device Health Posture at every point of control. When an alert is generated on a client machine, it can be shared by ClearPass to SonicWall NGFWs which would trigger a range of predetermined, policy-based actions from quarantine to blocking.
Q. Does this NAC integration feature work with any NAC providers? A. No, this NAC integration only works with Aruba ClearPass.
Q. Which access point models can I integrate with firewalls running SonicOS 7.1.1? A. With the launch of SonicOS 7.1.1, users will now also be able to integrate and manage Wi-Fi 6 APs like 621, 641 and 681.
Q. How can I automate NSv deployment using the bootstrapping feature? Which platforms support this feature? Bootstrapping helps with NSv automated deployments. Token-based registration will help ease the bootstrapping process. KVM already supported bootstrapping in SonicOS 7.0.1. With the launch of 7.1.1, other platforms like VMWare, Hyper-V, AWS and Azure will also support bootstrapping features.
Q. How is the bootstrapping process different between private cloud and public cloud? A. The bootstrapping process is not different between private cloud and public cloud. SonicOS supports bootstrapping on AWS, Azure, VMware, KVM and Hyper-V.
Q. What are the new parameters that will be stored in secondary storage modules with the launch of 7.1.1? A. TSR , exp, PCAP, threat logs and appflow logs will be stored in the secondary storage module as part of SonicOS 7.1.1
Q. Will the new features available in SonicOS 7.1.1 be available in the Capture Threat Assessment (CTA) report? A. During the launch, the new features in SonicOS 7.1.1 will not be included in the CTA report.
Q. Are the new features available on NSM? A. Yes. The upcoming NSM version 2.4 is planned to support the new features on SonicOS 7.1.1.
Q. Can I manage SonicOS 7.1.1 on the previous versions of NSM (prior to 2.4)? A. You can upgrade the SonicOS version to 7.1.1, but the new features which are part of 7.1.1 will not be available on NSM versions prior to 2.4
Q. What are the best practices to be followed on SonicOS 7.1.1? A. Please follow the best practices when upgrading the firewall from SonicOS 7.0.1 to SonicOS 7.1 documented here.
The migration tool is not required for the configuration migration from SonicOS 7.0 to SonicOS 7.1. Any customer migrating from Gen 6 to SonicOS 7.1 would need to upgrade to SonicOS 7.0.1 using the migration tool and then migrate to SonicOS 7.1.
DNS Filtering is the first line of defense and works independent of Content Filtering Services (CFS). Please follow the admin guides for seamless configuration with best practices.
Q. What is the new website for URL rating and reputation lookup with CFS 5.0? A. https://cfssupportapi.global.sonicwall.com/
Q. How can I check the URL rating on the firewall UI? A. Device –> Diagnostics –> URL Rating Request Tool
Q. What is the performance impact of enabling the new SonicOS 7.1 features on an existing firewall? A. We do not expect there to be any impact on the performance of an existing firewall because of new features.
Q. Can DNS proxy 4to4 and 4to6 features work alongside DNS filtering? Can this be accomplished by adding an additional DNS proxy-only rule alongside a DNS filtering rule for X0 Interface? If so, what will take precedence/priority? A. DNS rules give the choice of either proxy or filtering on a single rule. When proxy is enabled, Client 4to4 or 4to6 DNS queries can be proxied. When DNS filtering is enabled, only Client 4to4 Requests DNS queries will be proxied and filtered. —While DNS proxies will process both DNS TCP and DNS UDP, DNS filtering is only for DNS UDP. —Both proxy or filtering DNS rules can be stacked, the most specific match will be applied, and the lookup precedence/priority is top-down. —To have DNS proxy 4to6 alongside DNS filtering, the proxy rule must explicitly have source zone and address of the 4to6 Clients for the traffic to hit the rule and the policy to be applied
Q. Can DNS Filtering be applied on custom zones or is it restricted to default zones, LAN, DMZ and WLAN? A. DNS Filtering can be applied to LAN, DMZ and WLAN zones as well as custom zones with Trusted, Public and Wireless Security Types.
Q. How long does a cache entry last before we request a category for a specific domain again? A. The cache entry of a domain would depend on the TTL of the domain.
Q. Are there plans to support DNS over TLS and DNS over HTTPS? A. Yes. DNS over TLS and DNS over HTTPS will be available in a future release.
Q. Will the DNS Filtering license be included with any existing bundle or does the customer need to buy it separately? A. DNS Filtering will be available with APSS and there will be a la carte SKUs for EPSS, TPSS and HW only.
Q. What happens to the WNM managed access-point when the firewall is upgraded to SonicOS 7.1?
A. Please note that if you have 600 series access points on the network connected to a WLAN zone of a firewall with 7.0.x managed by WNM, after the update to 7.1 the access points will be acquired by the firewall. All WNM settings will not be available. Please “Disable SonicPoint/SonicWave management” on the WLAN zone for seamless management.
NOTE: In the SonicWall TZ Series appliances there are two Service LEDs, which are reserved to reflect “Services” in the future, however in current SonicOS versions, they are used to reflect presence of the Alarms.
The Test and Alarm LEDs illuminate yellow or red. These LEDs can blink, flash, heartbeat or show a solid light.
Blink is a repetitive rapid on/off cycle (on second, off second).
A flash is a single slow on/off cycle.
Heartbeat is a double flash, repetitive on/off cycle (on 1/15th second, off 1/6th second, on 1/15th second, off second).
LABEL
STATE
MEANING
PWR/PWR1/PWR2
BlueYellowOff
Power is On.Power Supply Not Functioning Correctly.No AC Cable plugged in or On/Off switch at the back of the product is on 0.
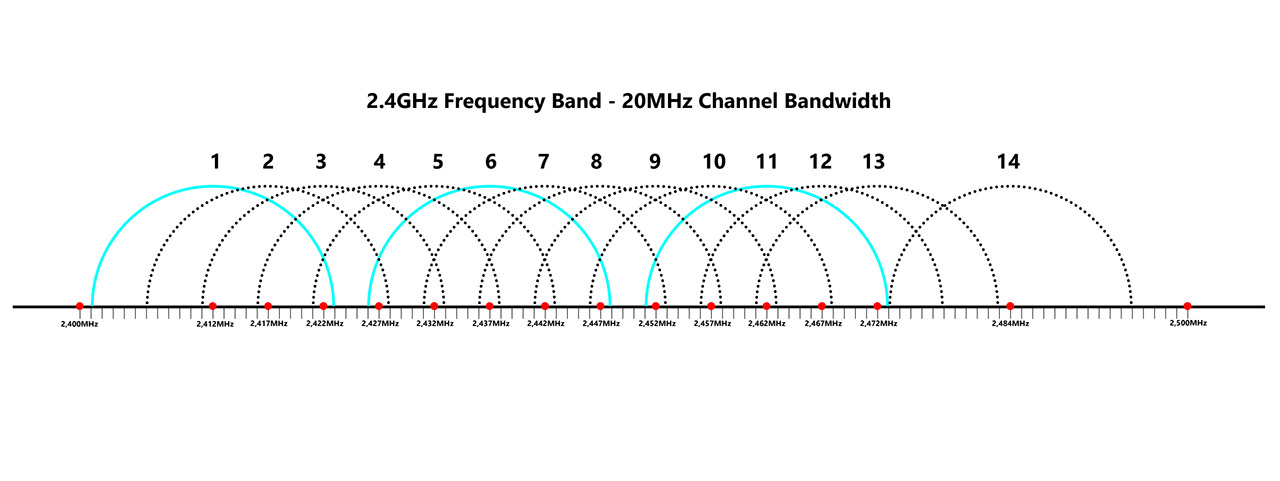
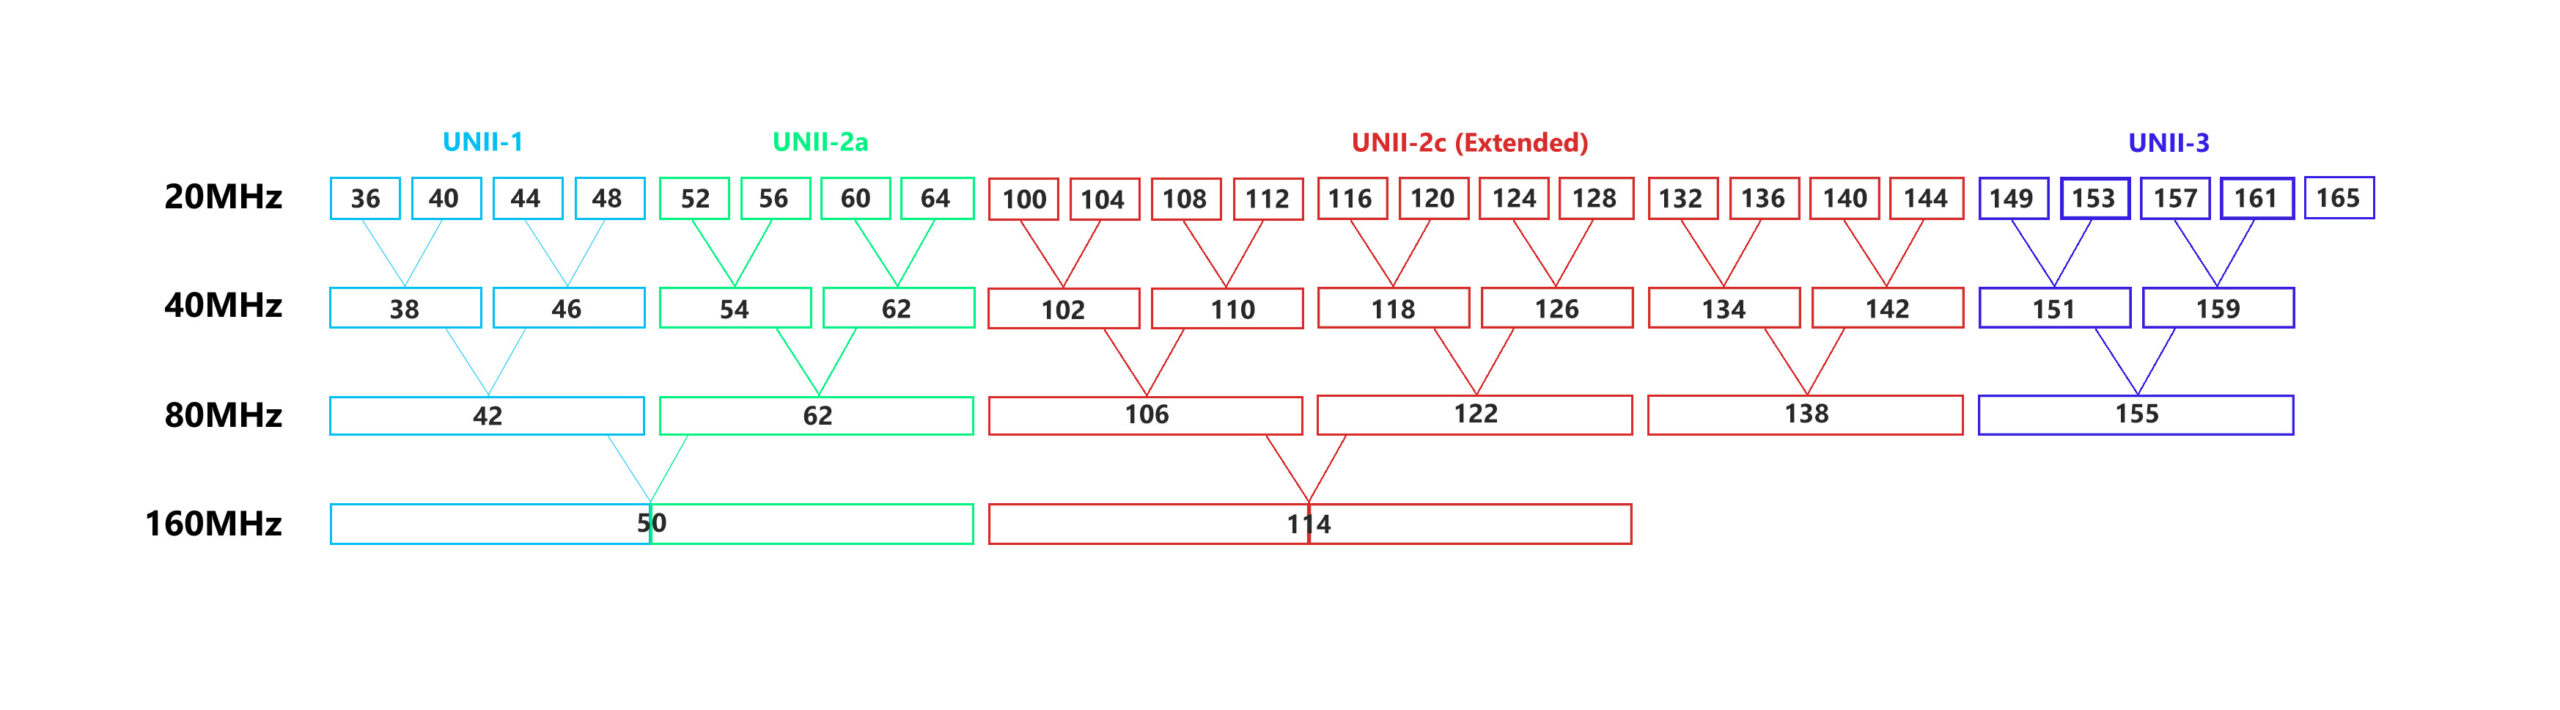
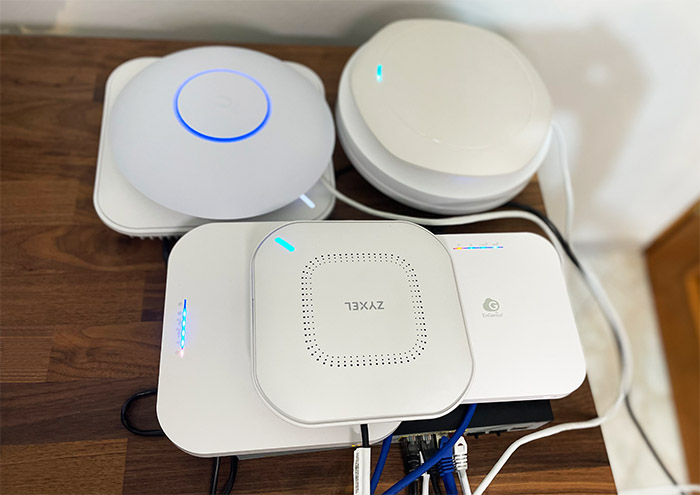
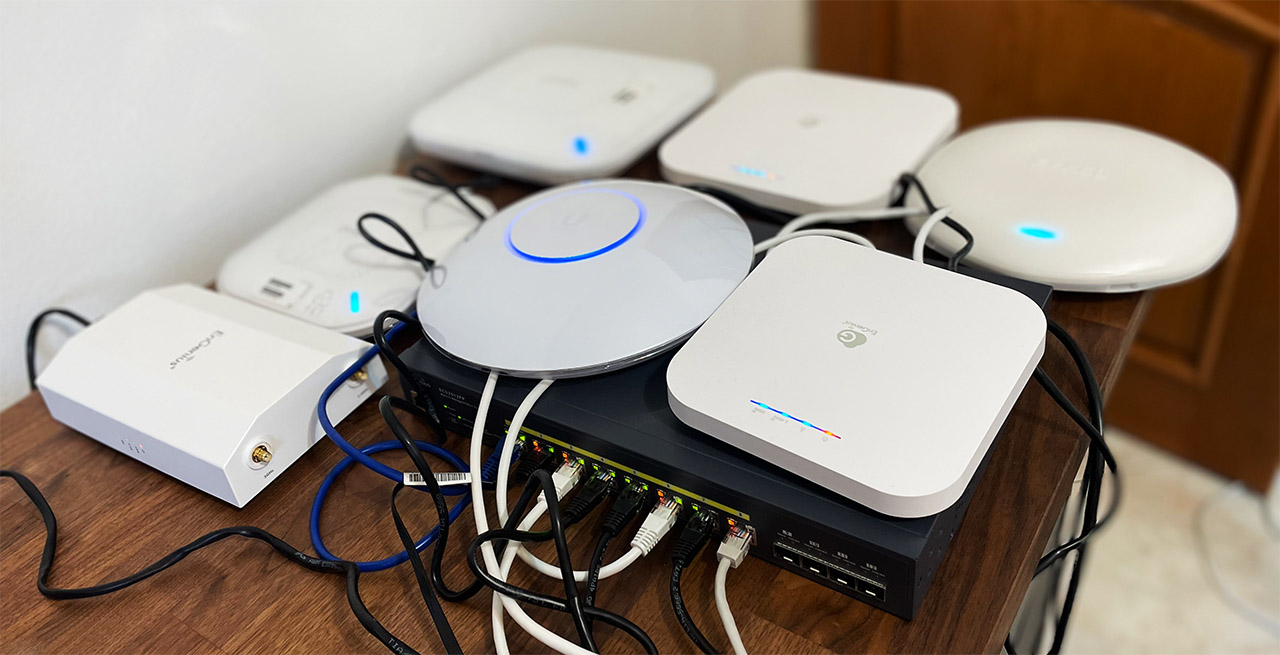
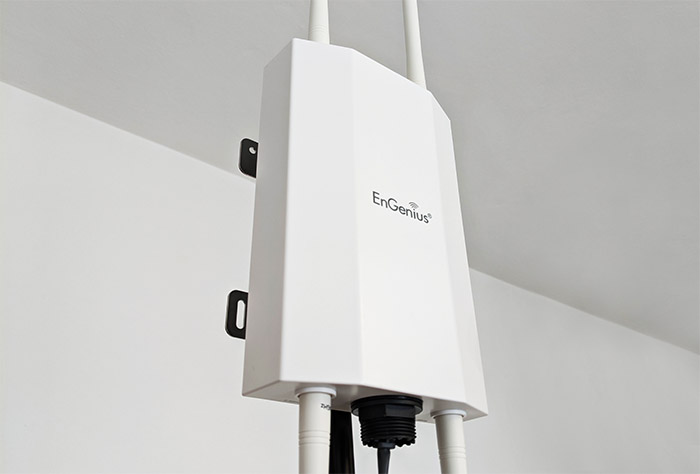

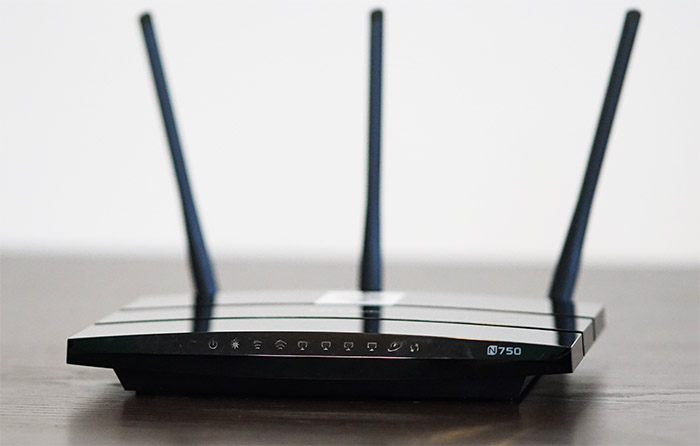
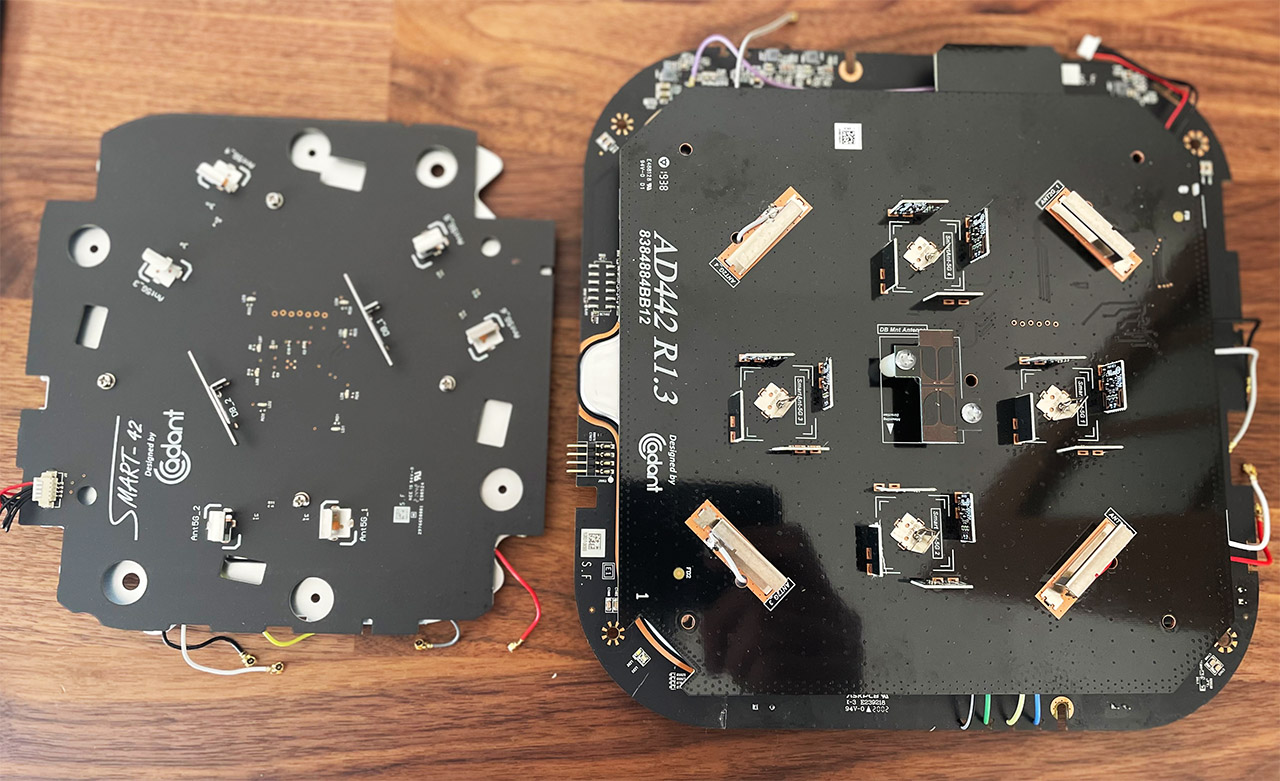
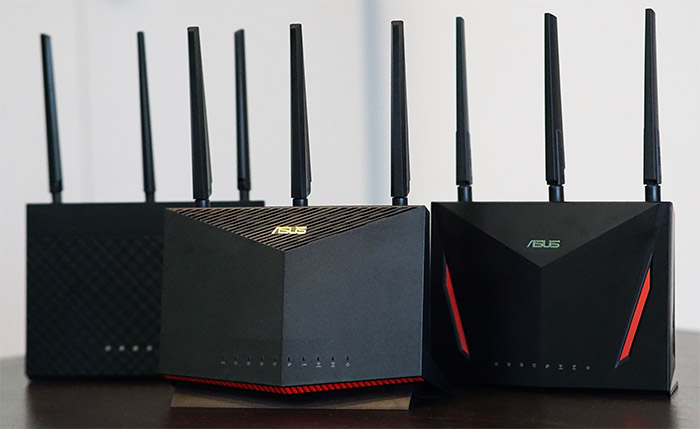
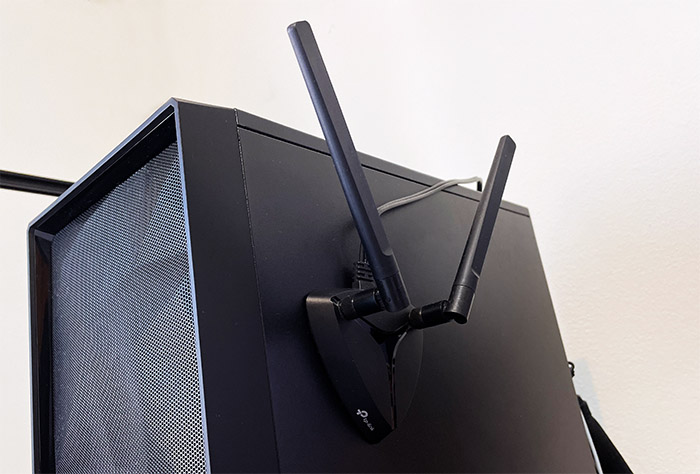
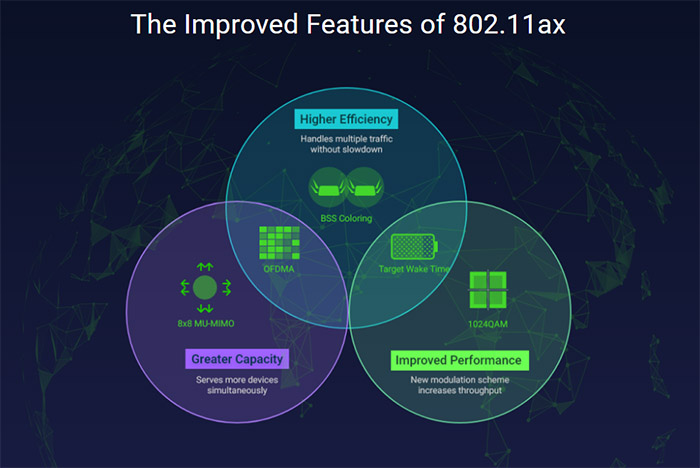
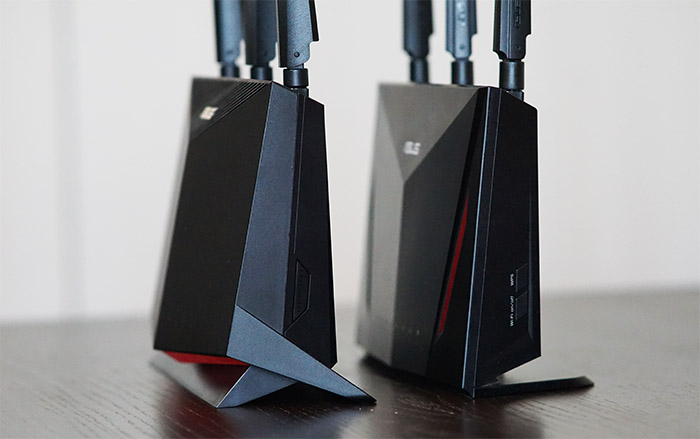
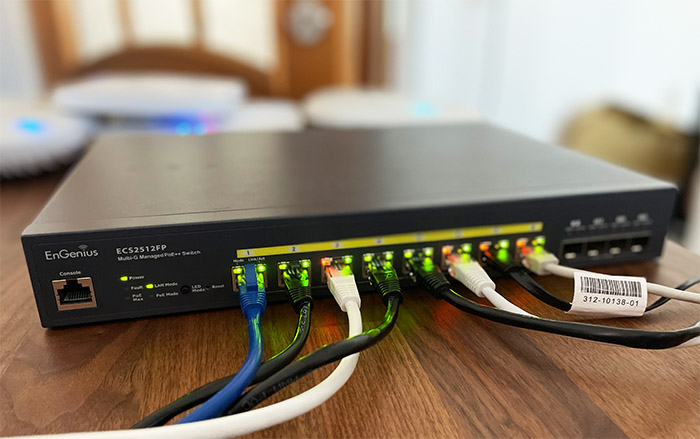
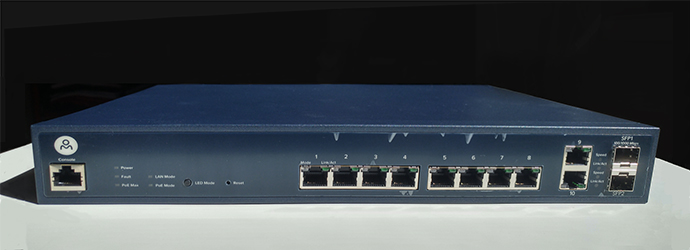
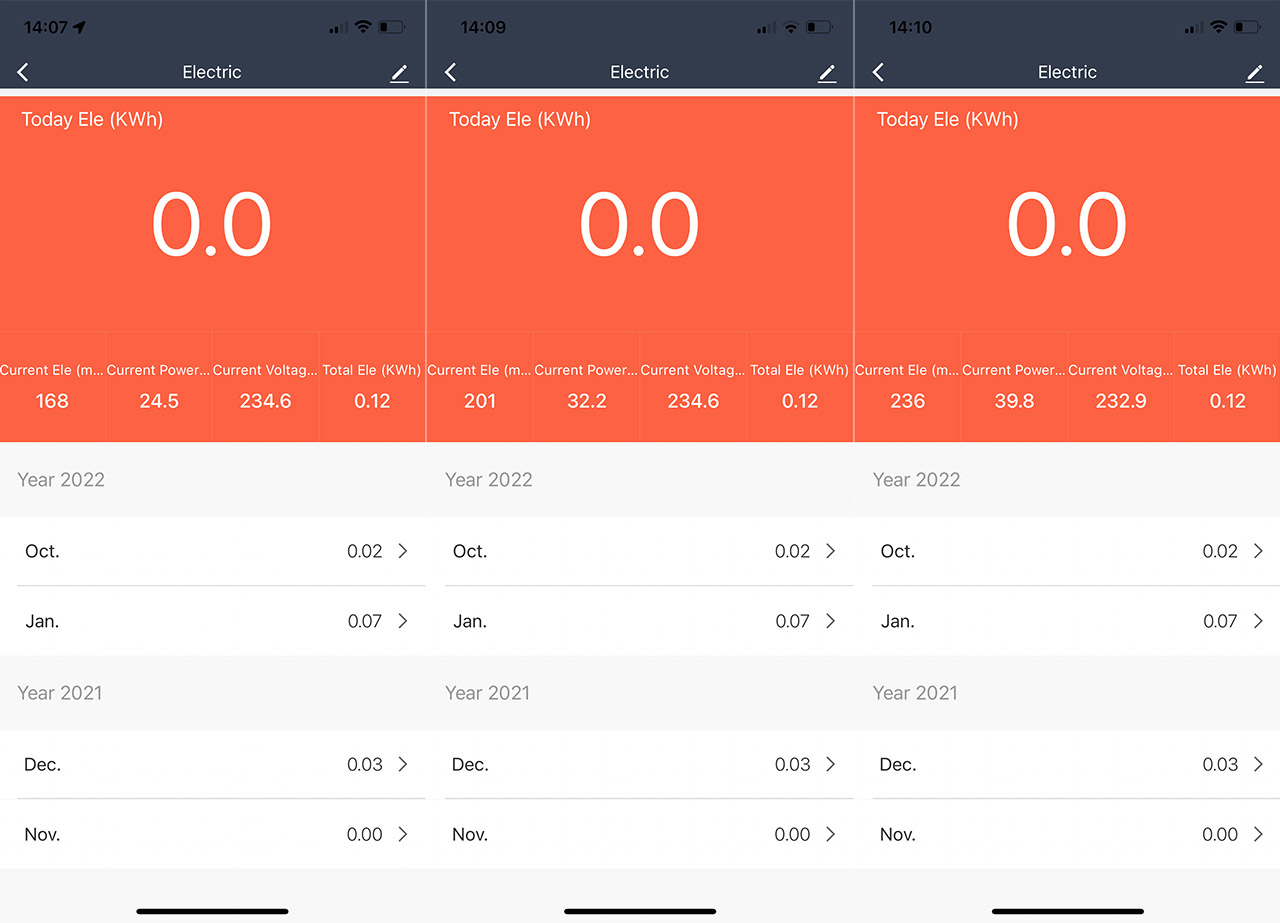
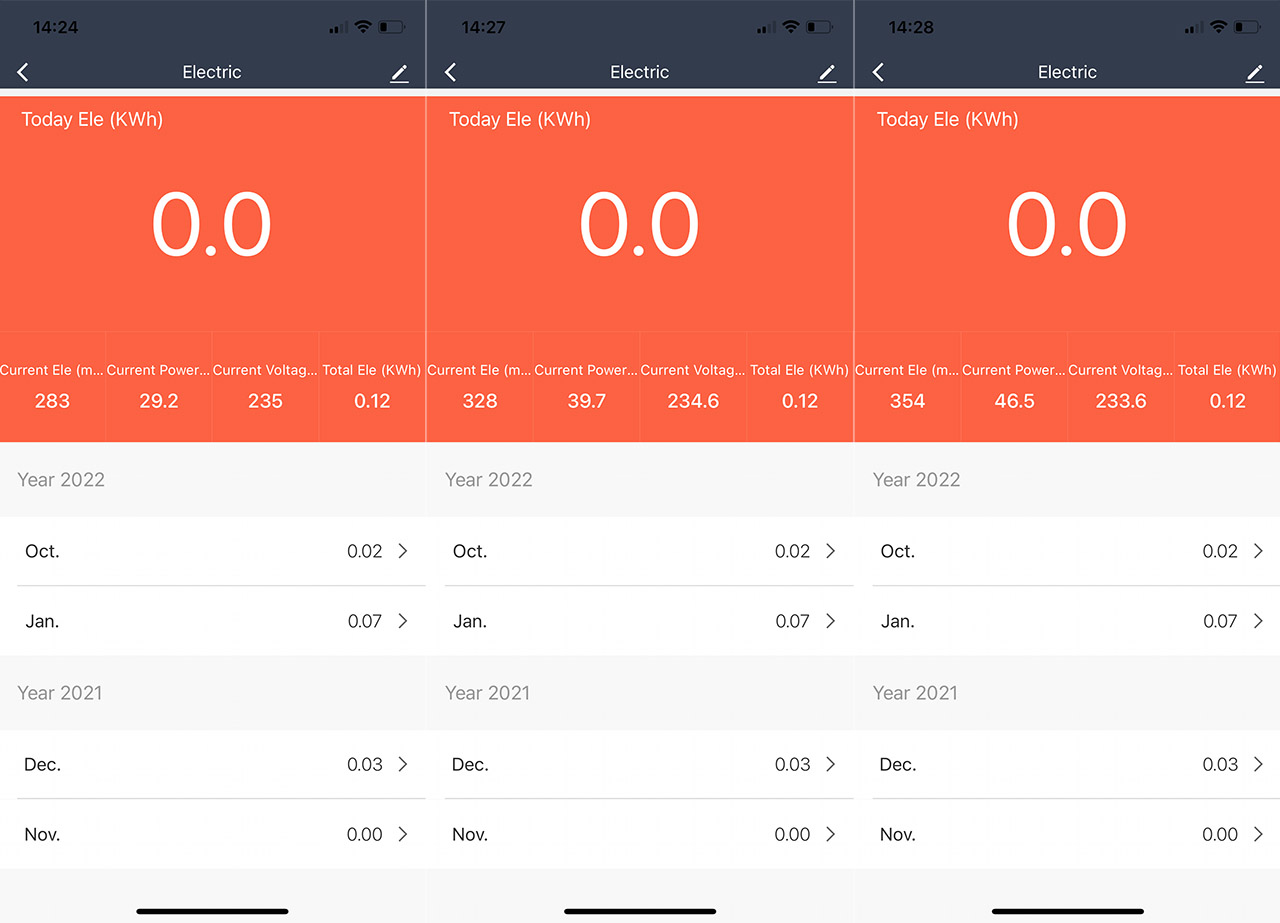
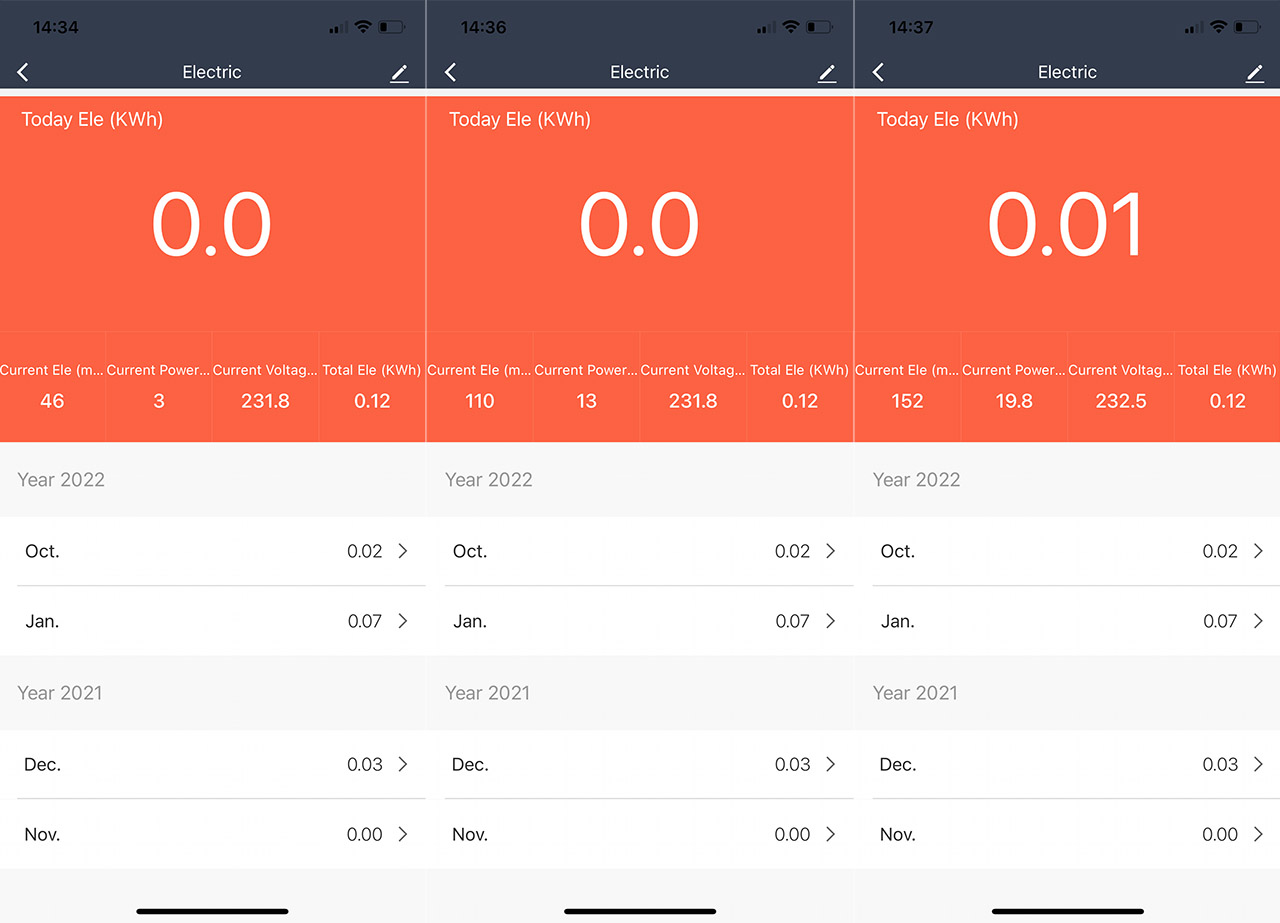
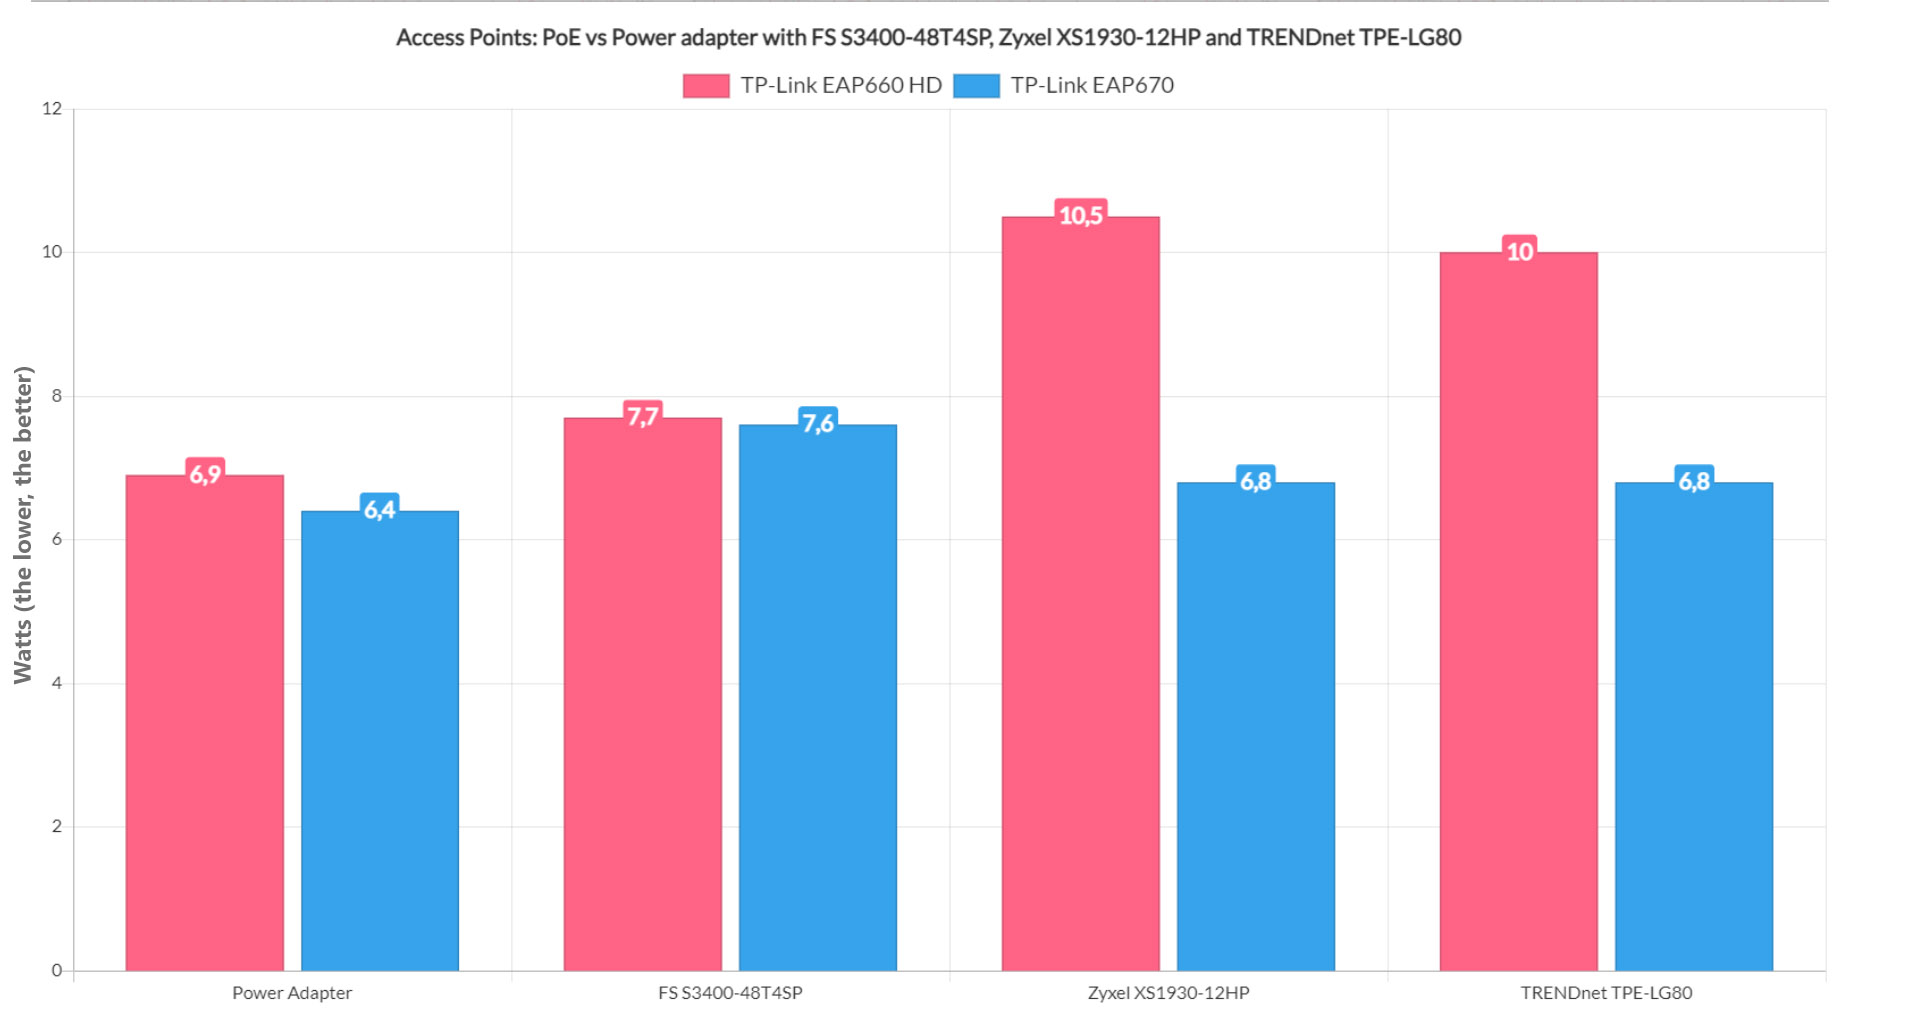
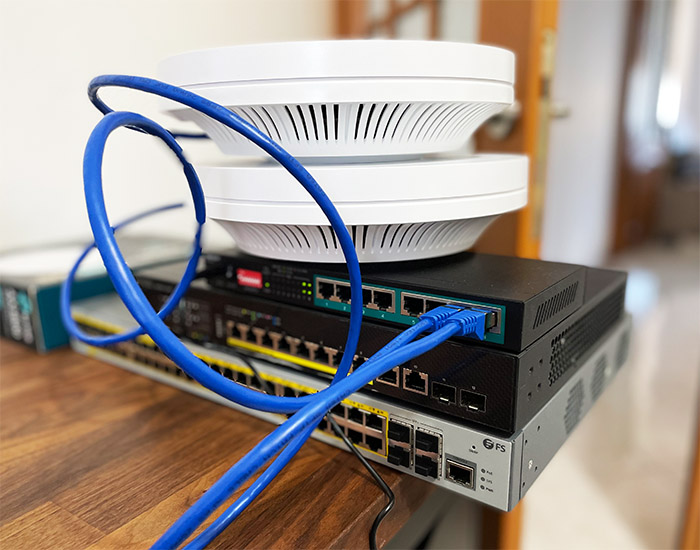
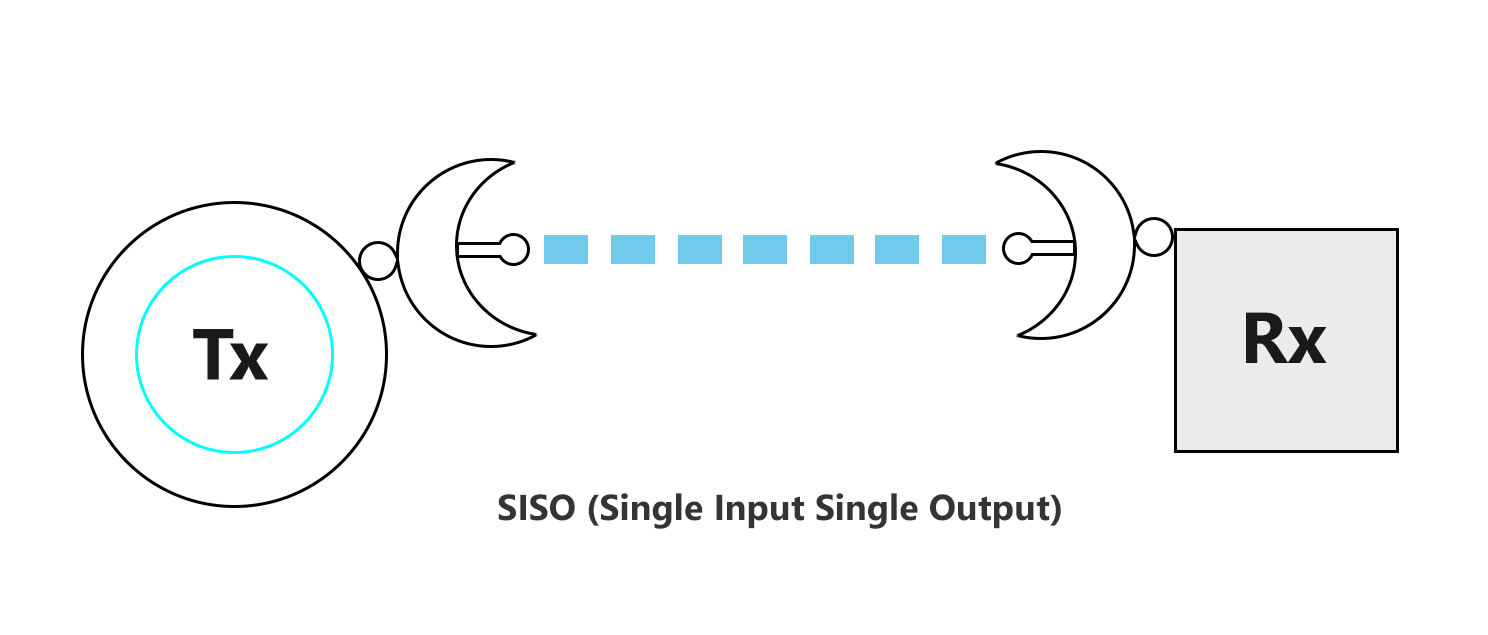
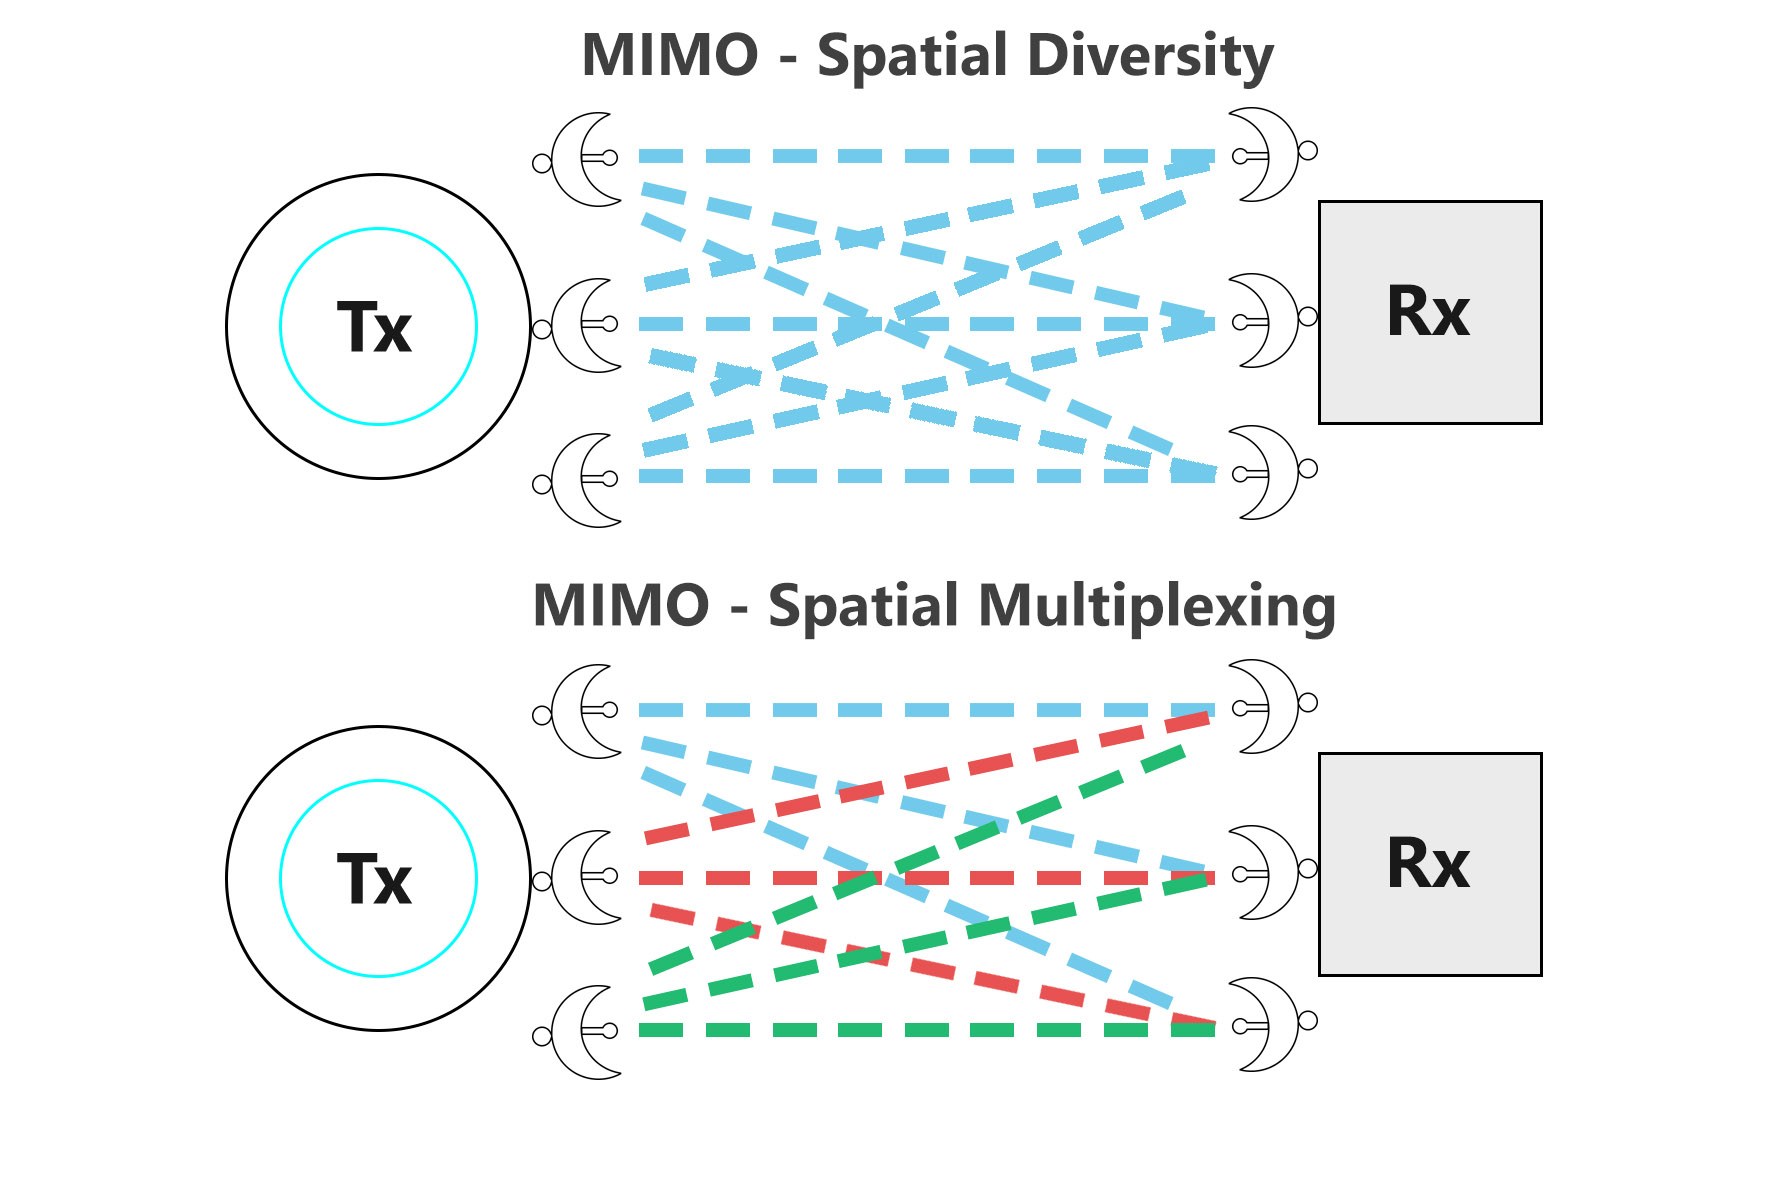
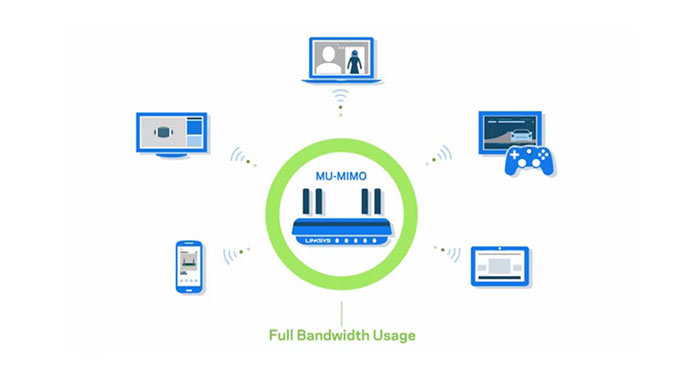
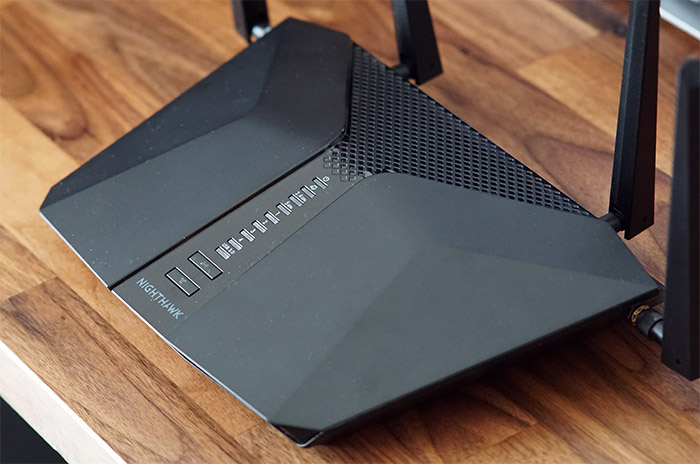
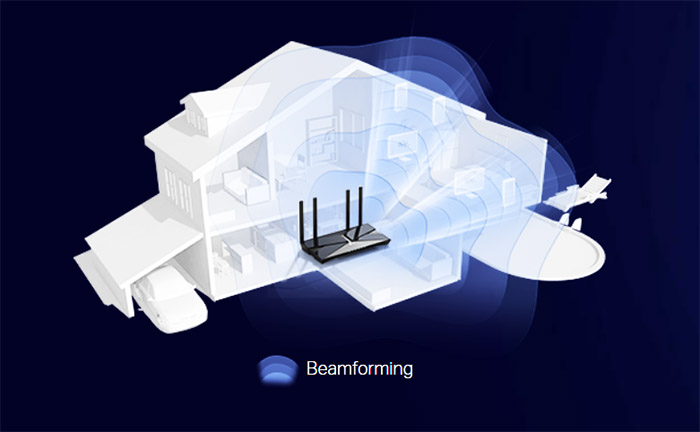
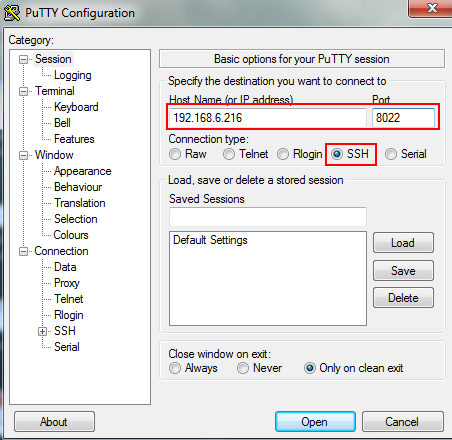
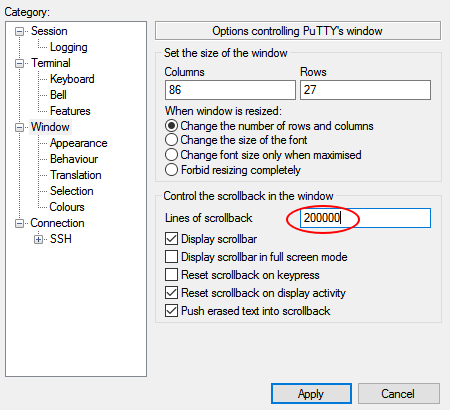
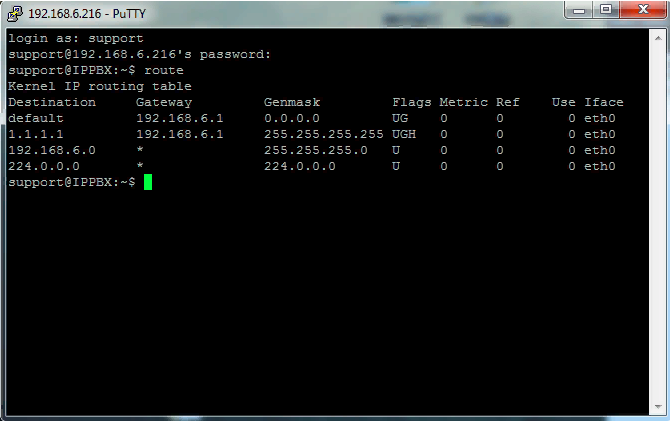
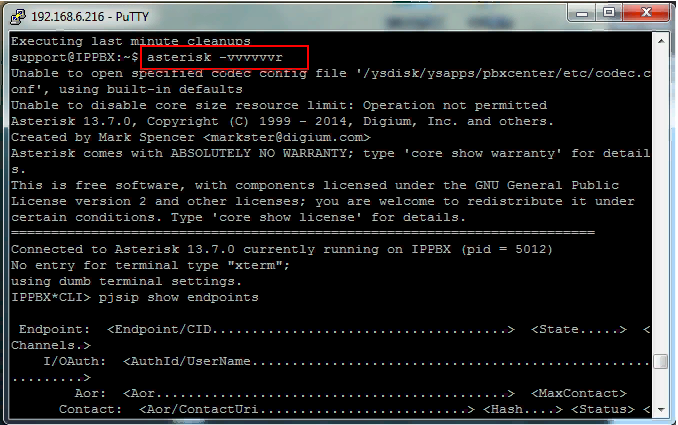


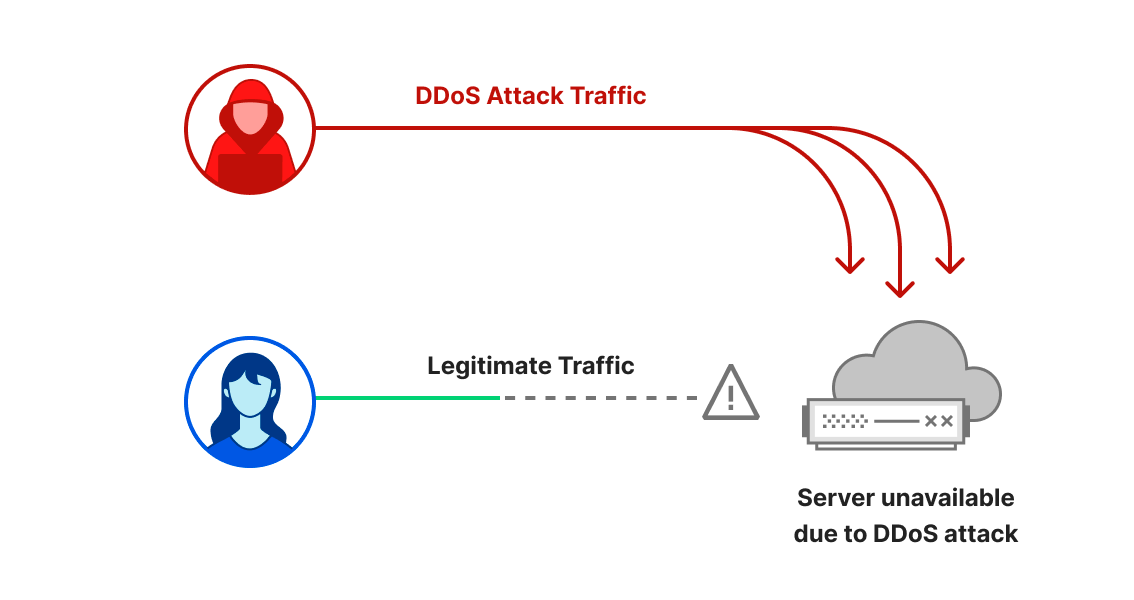
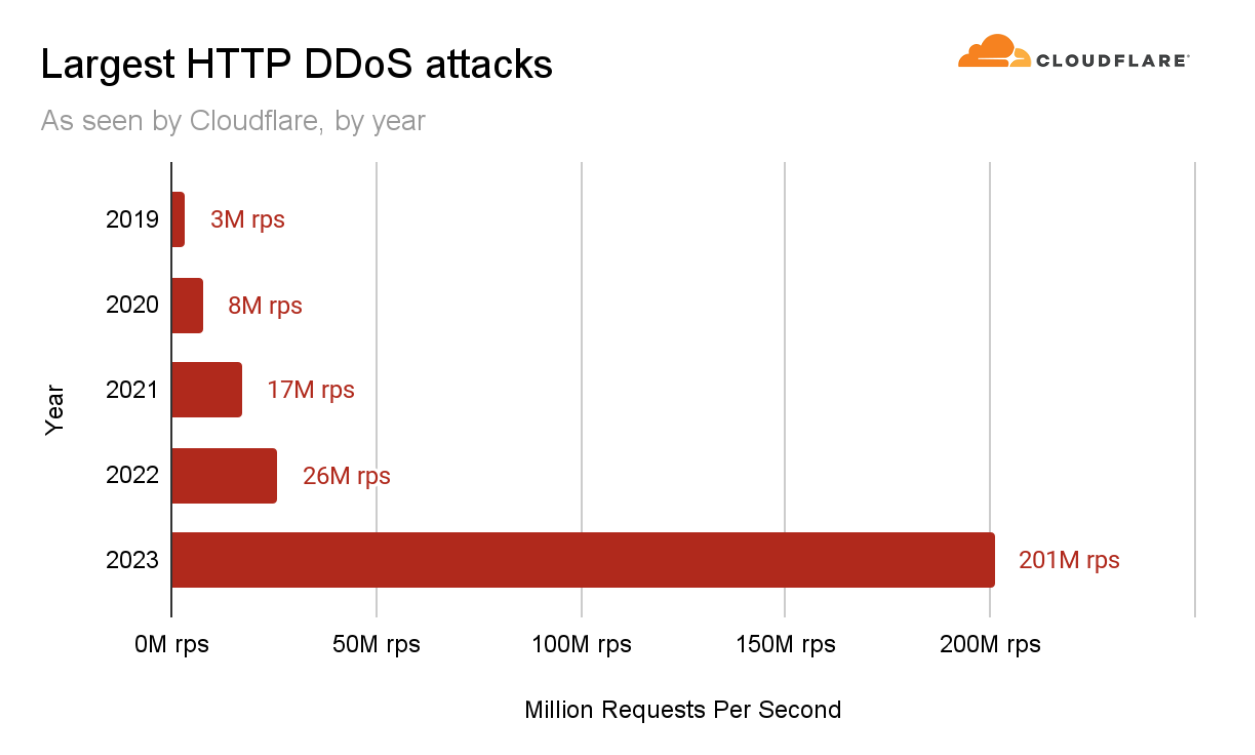
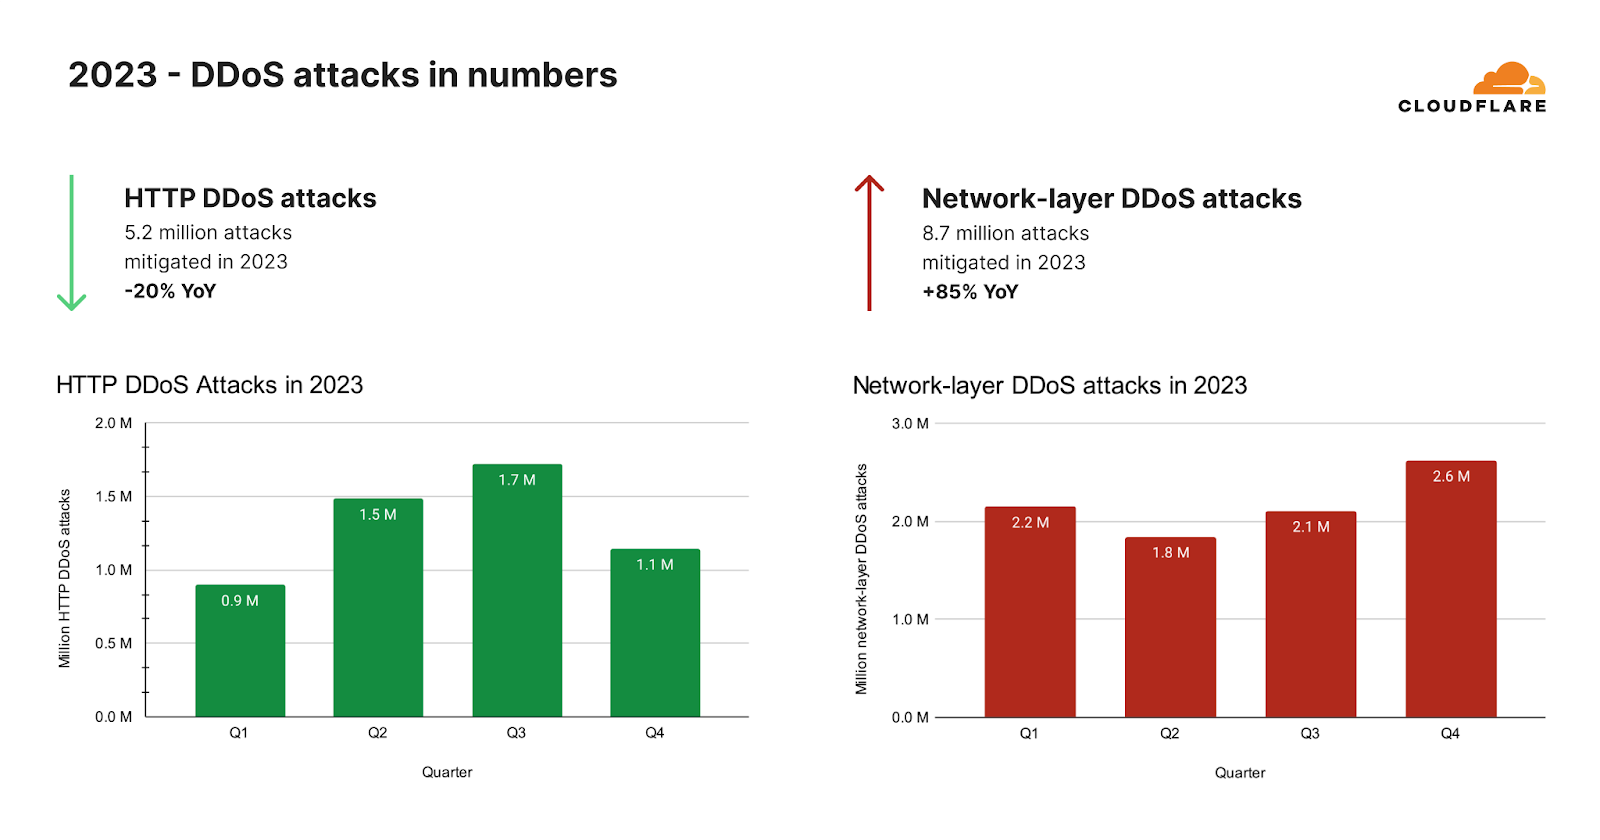
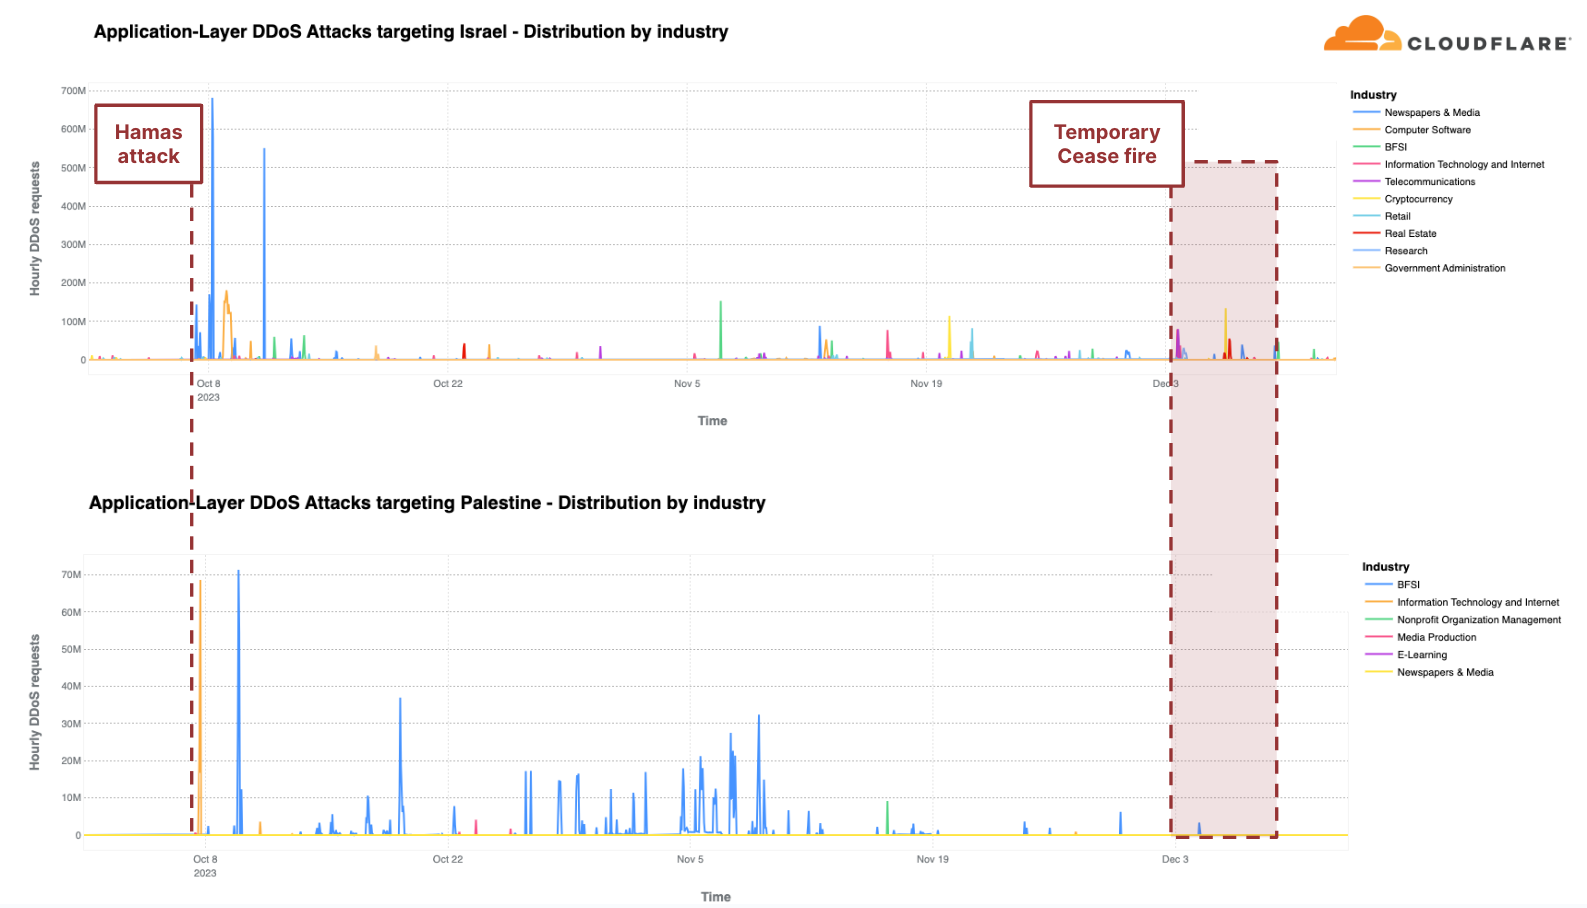
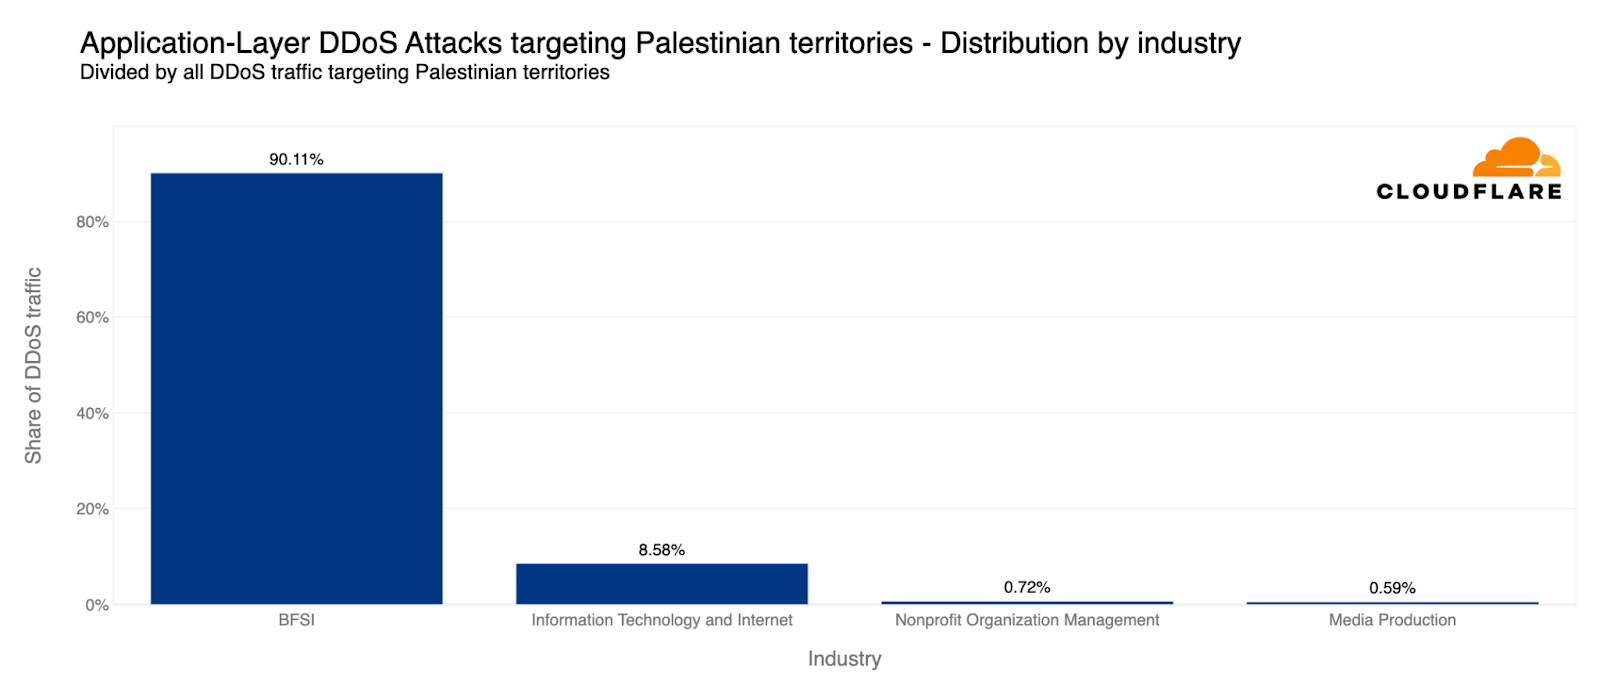
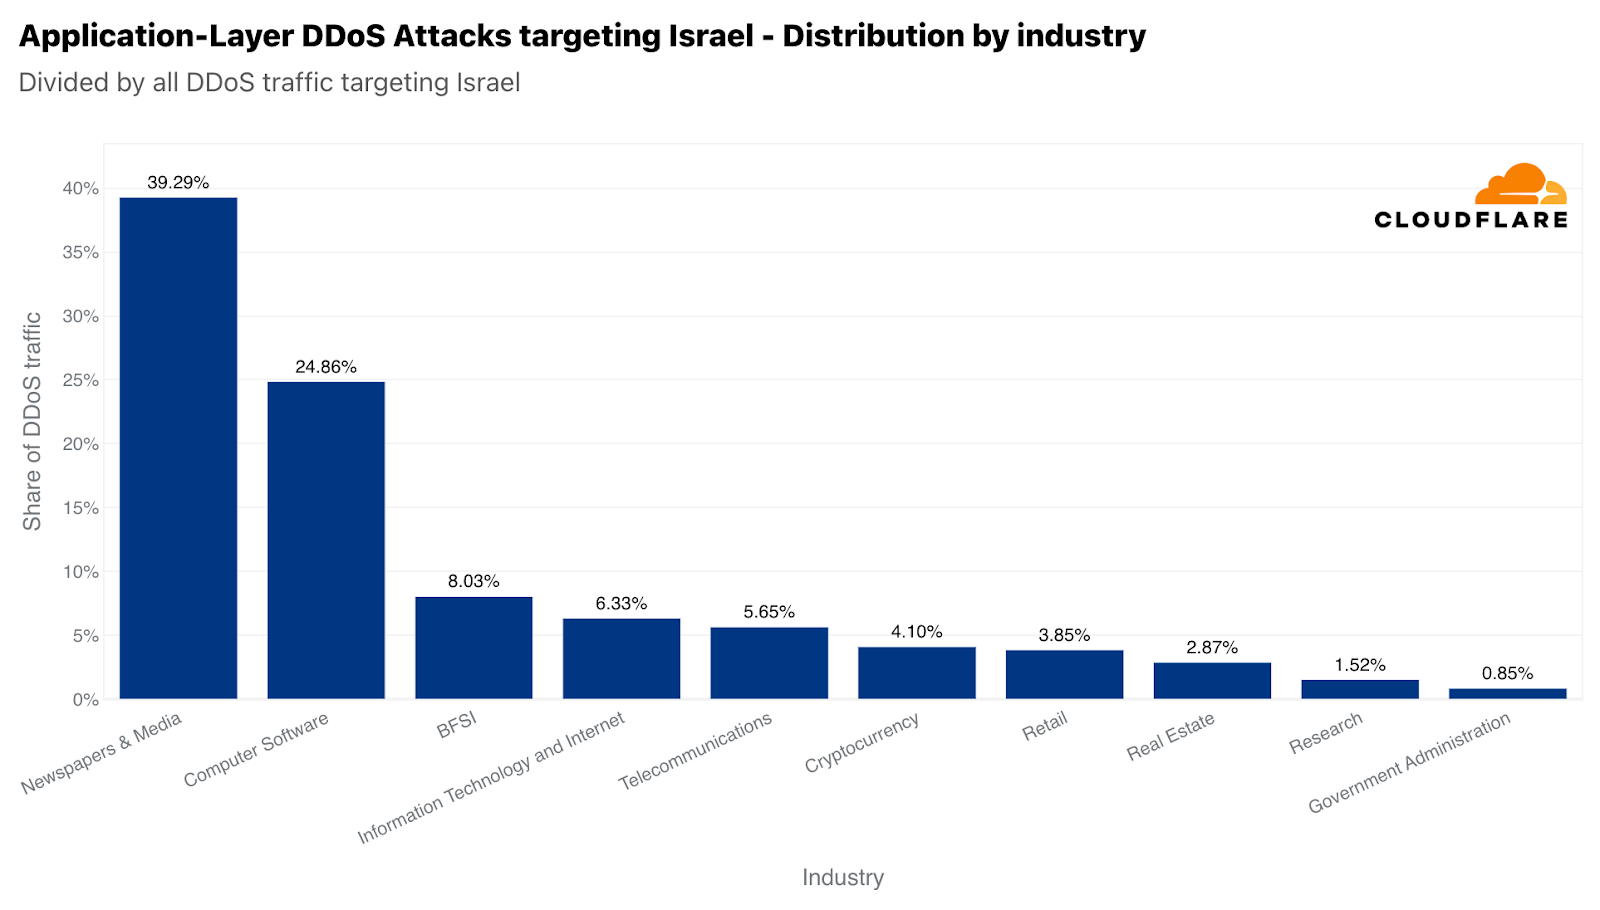
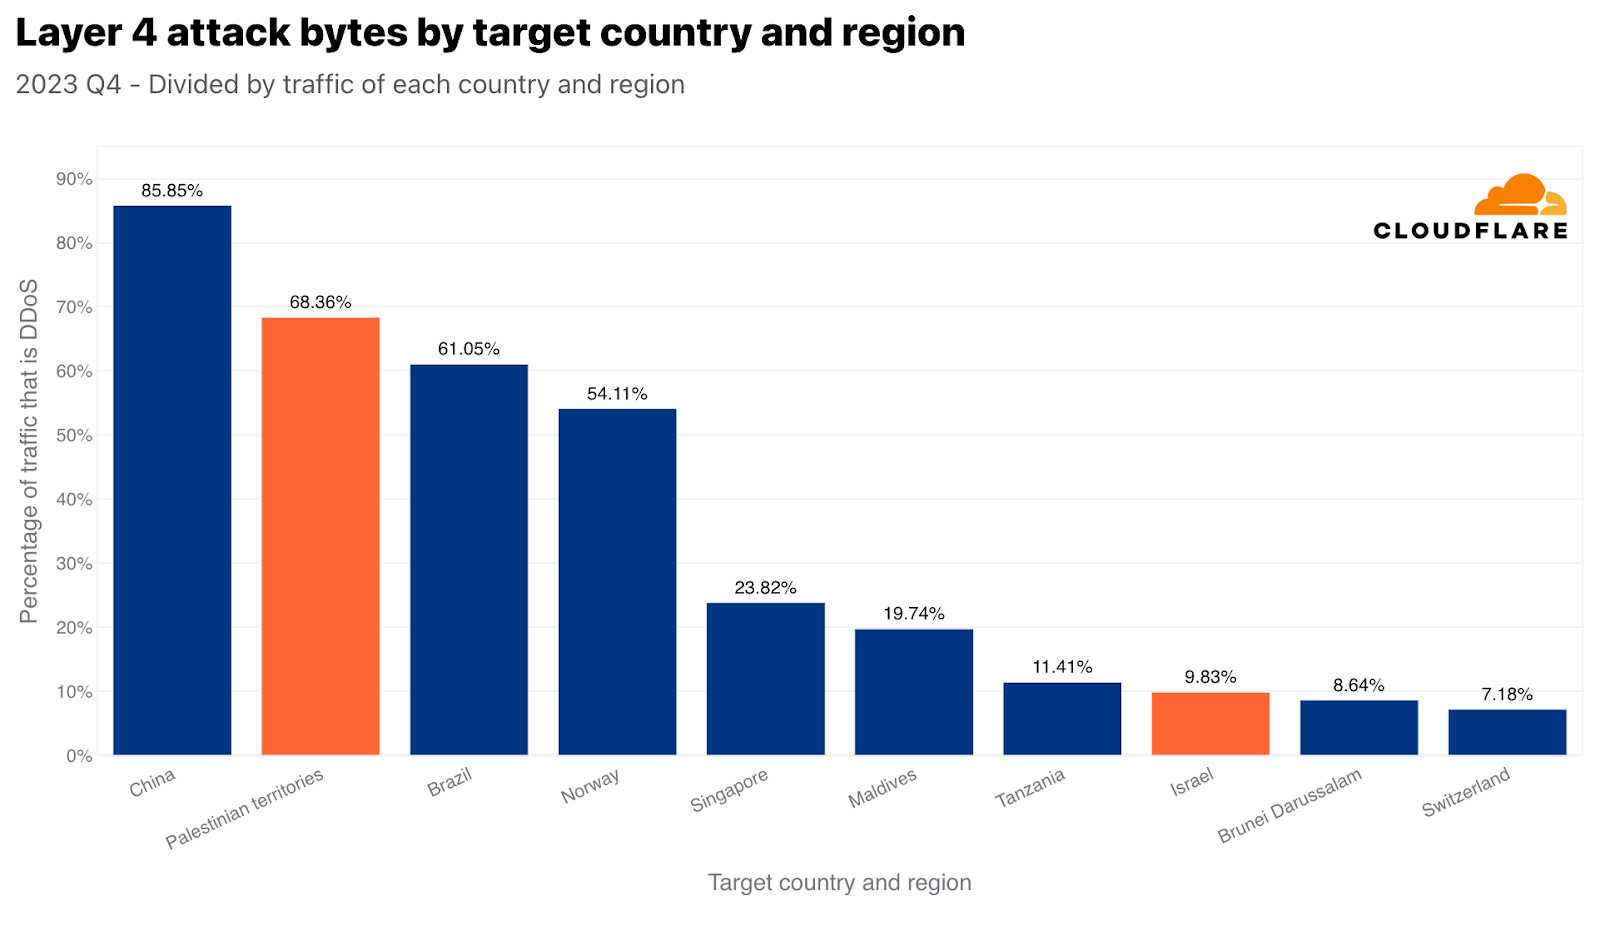

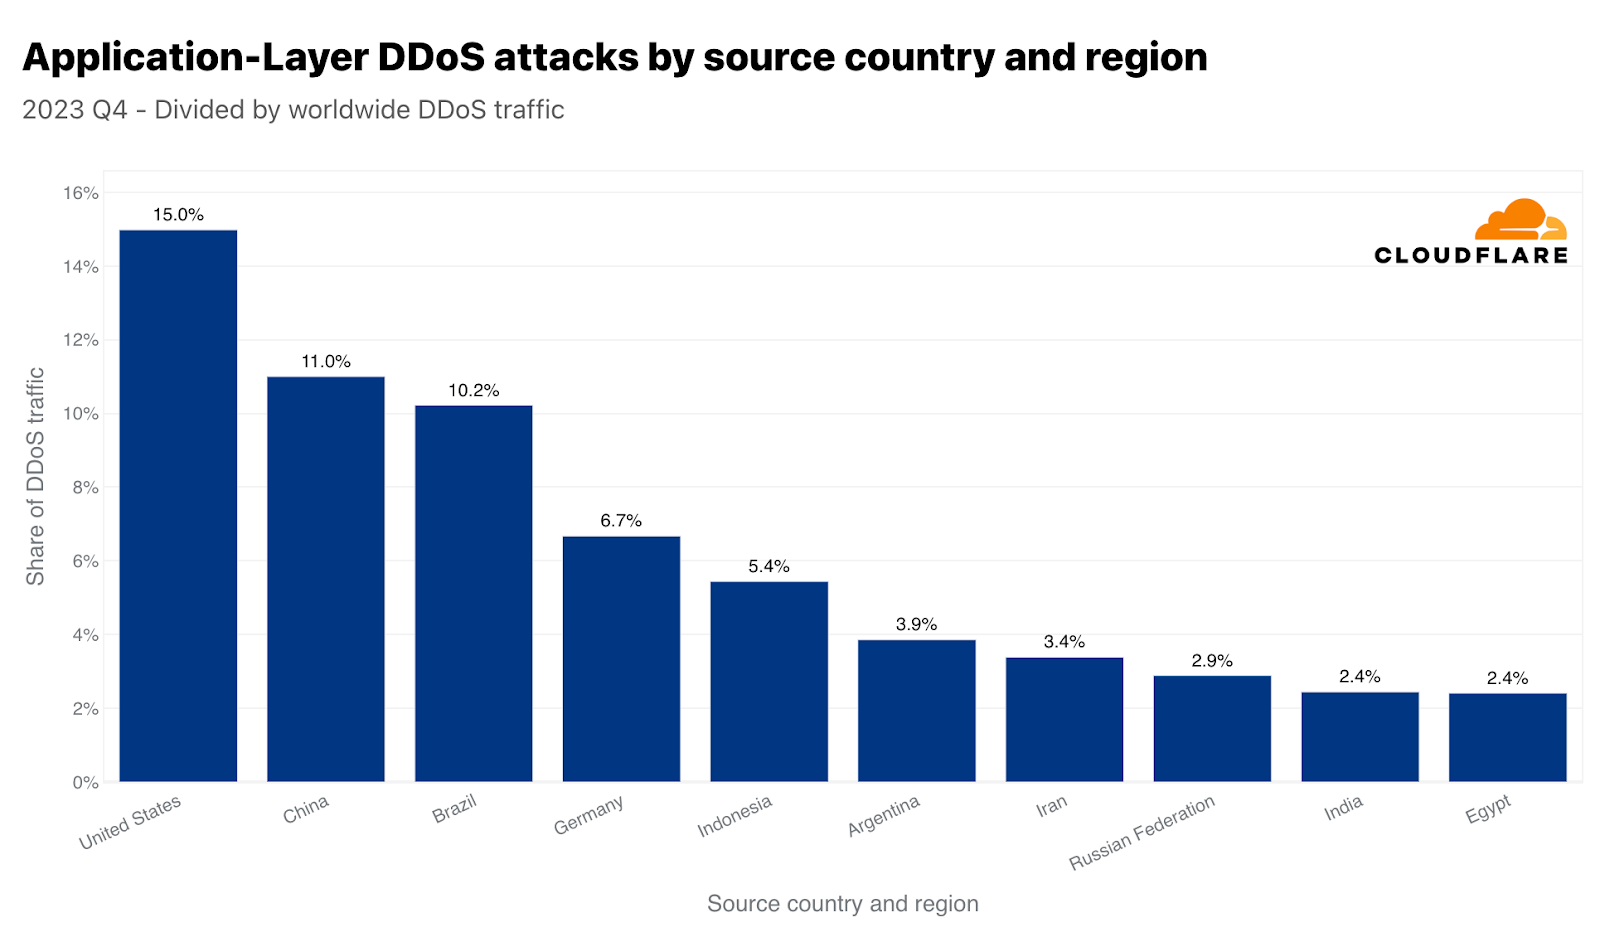
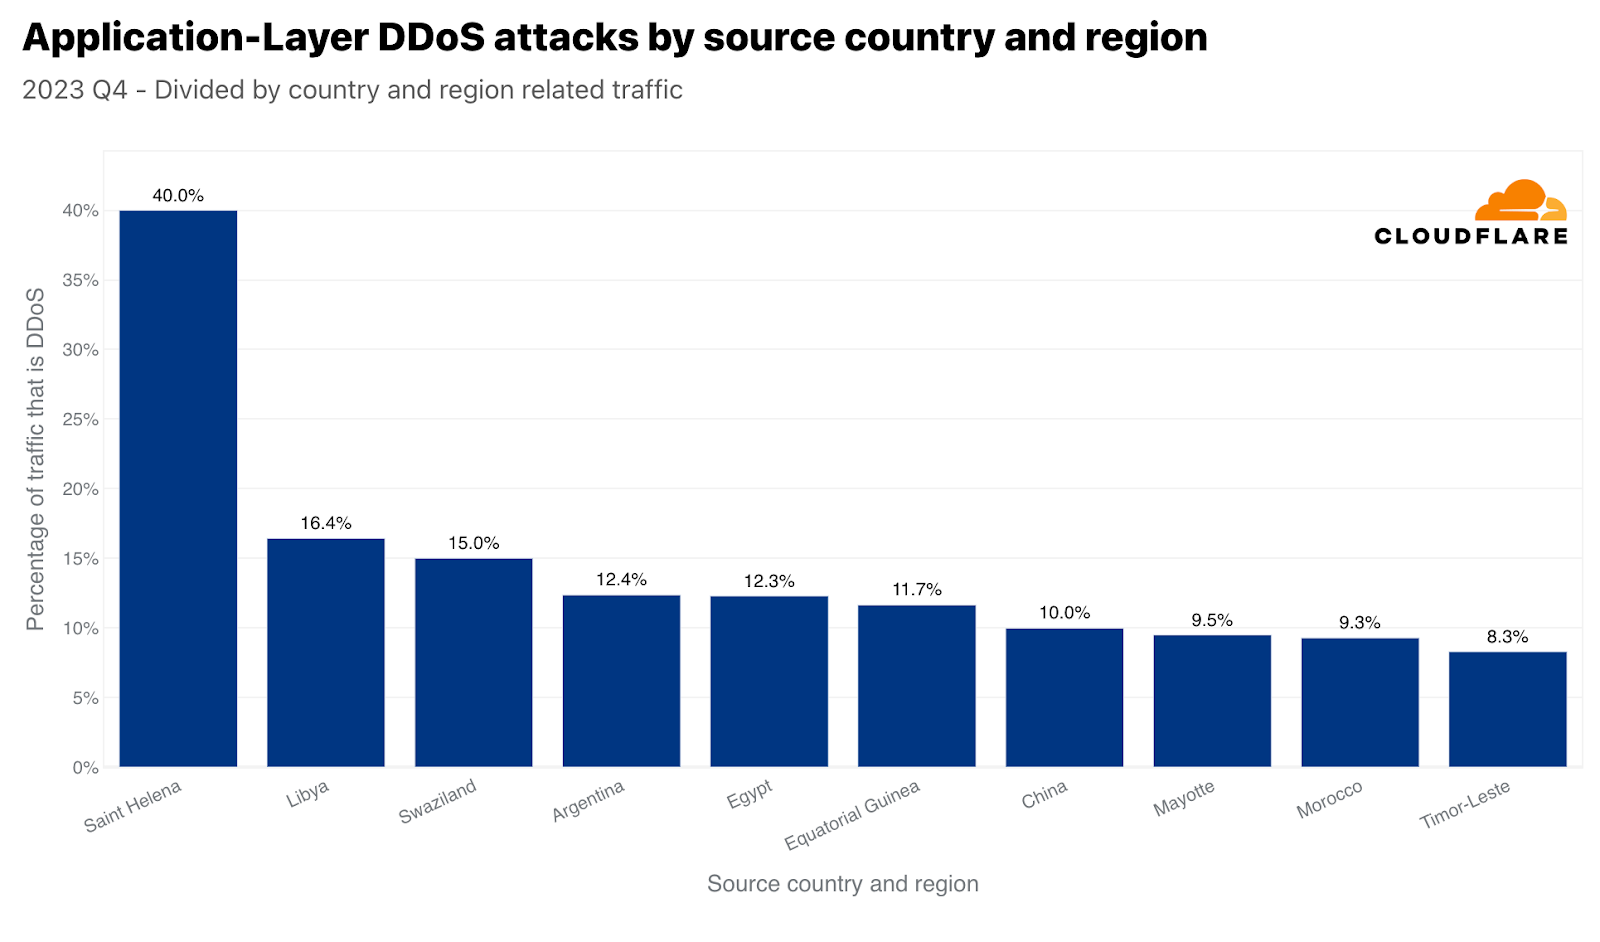
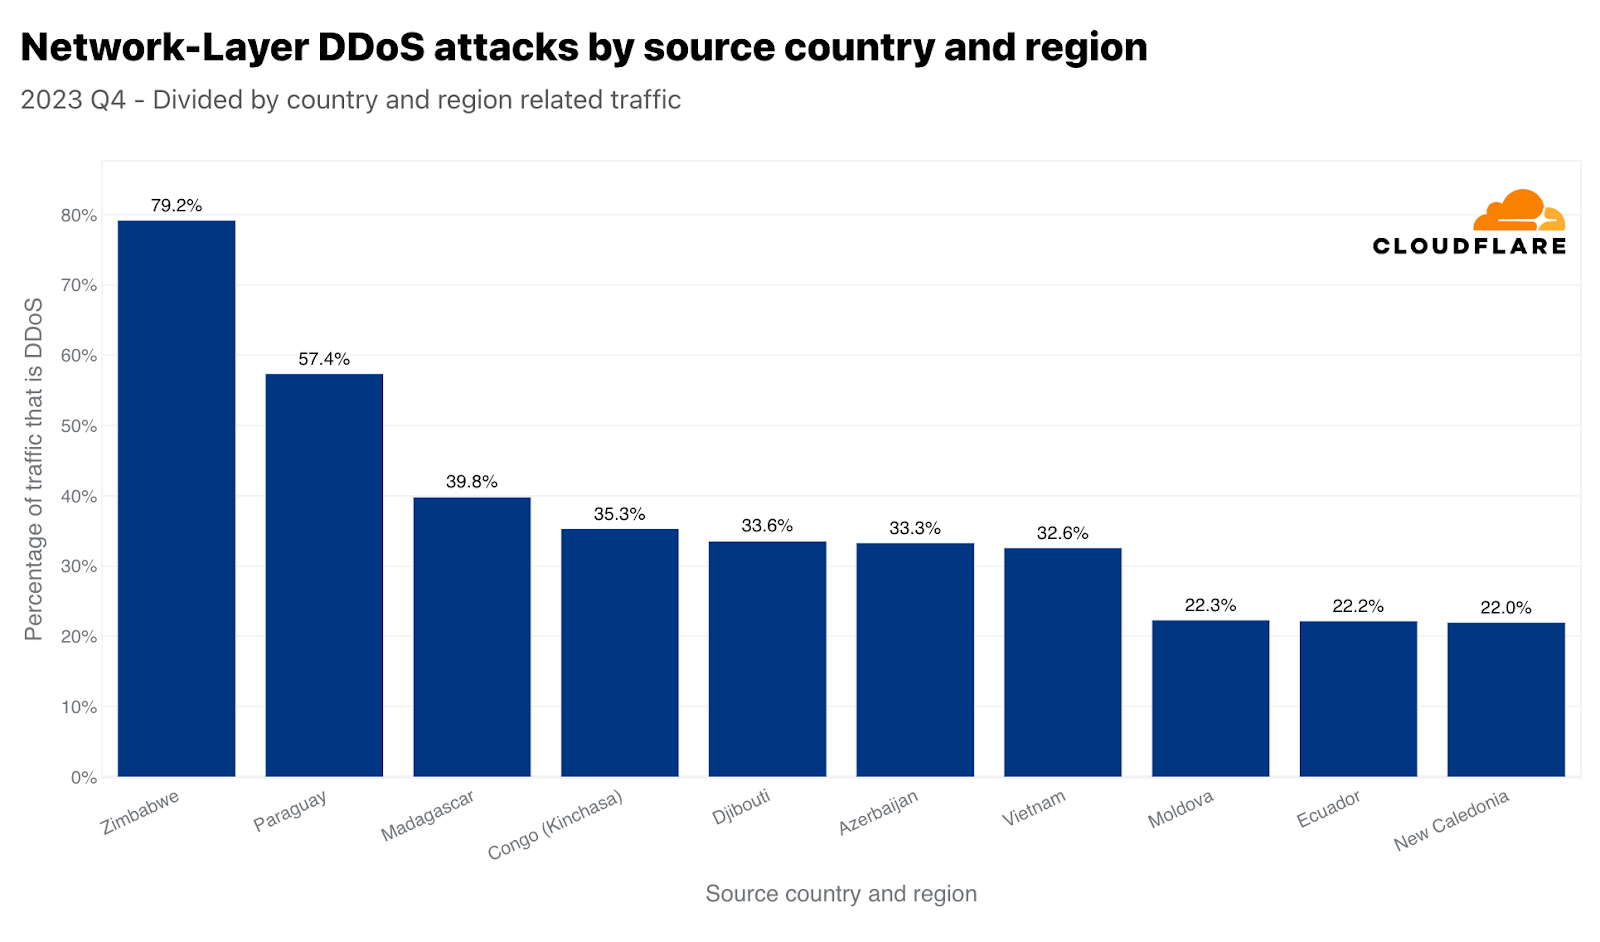
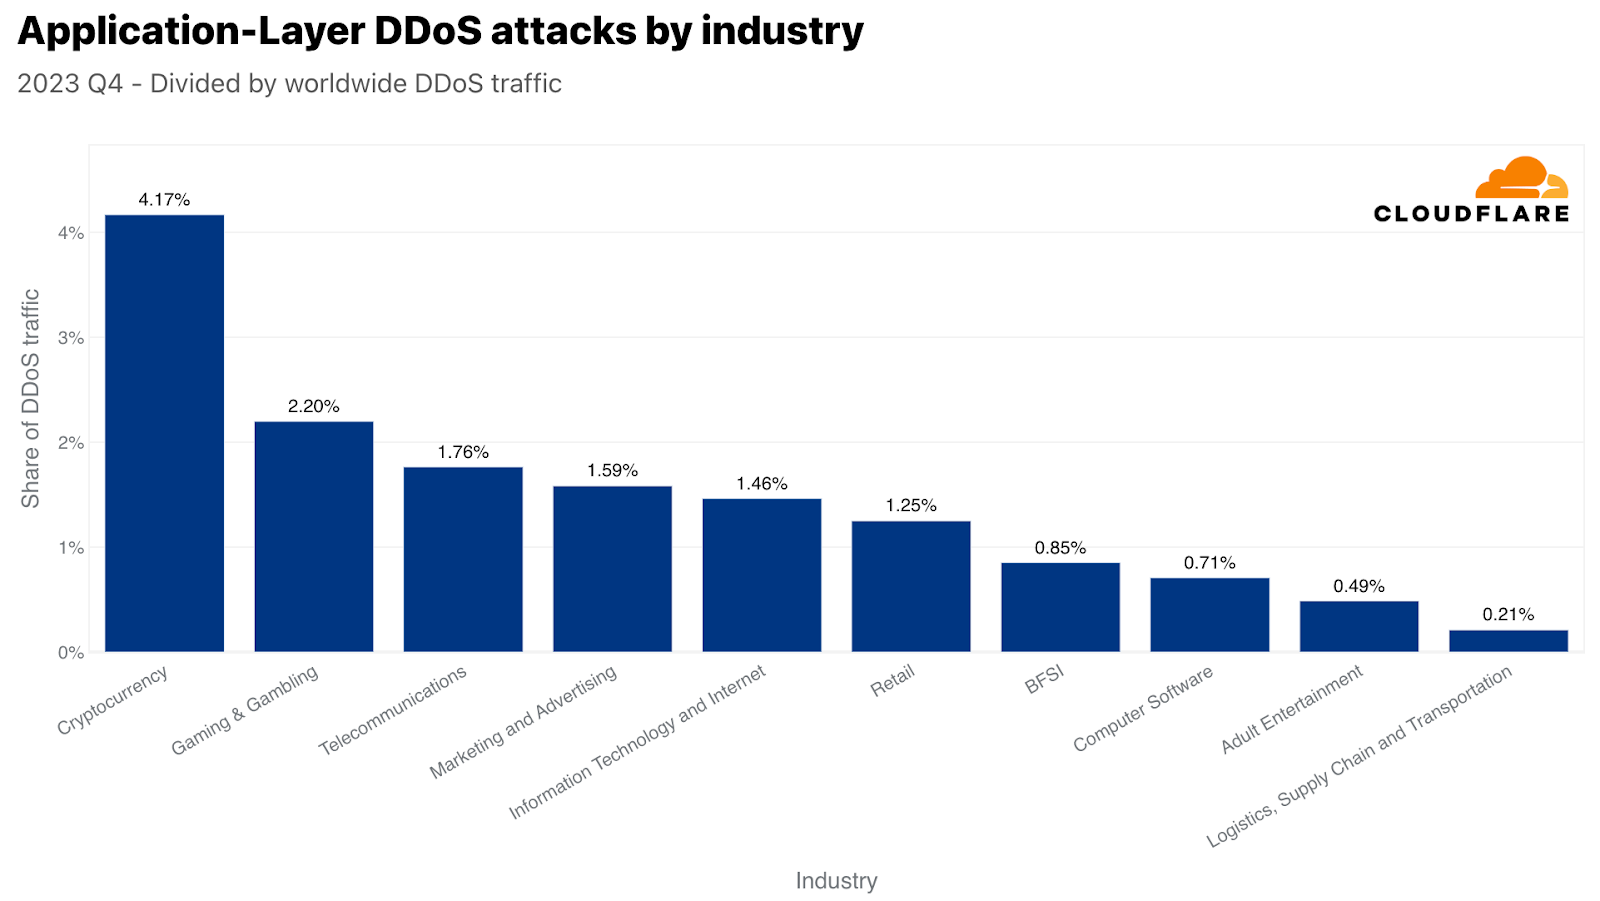
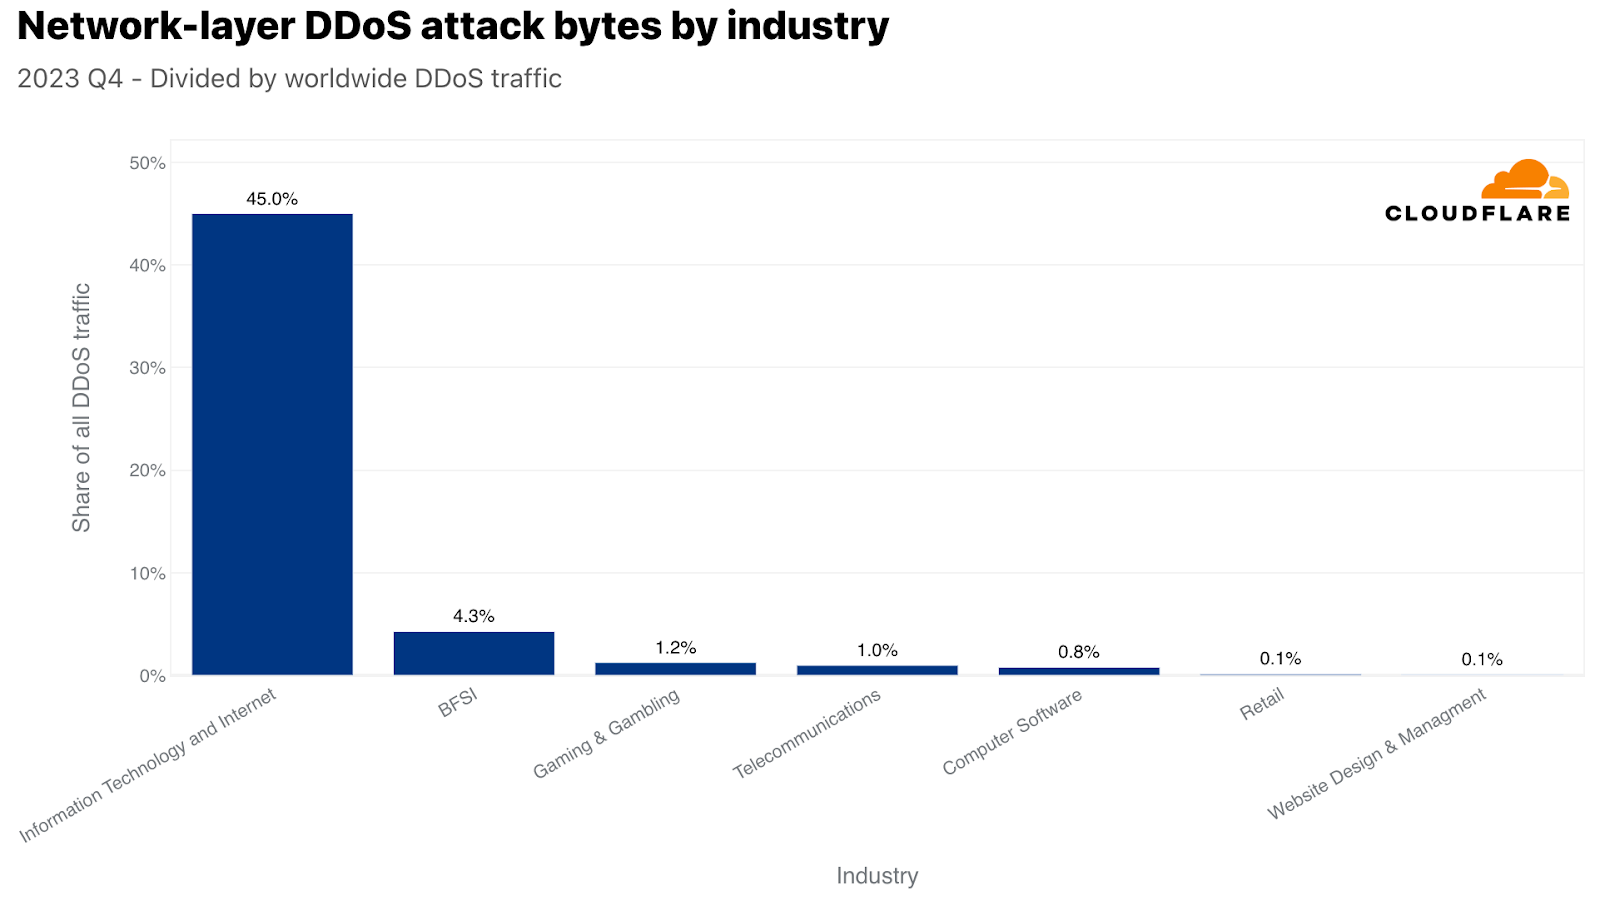
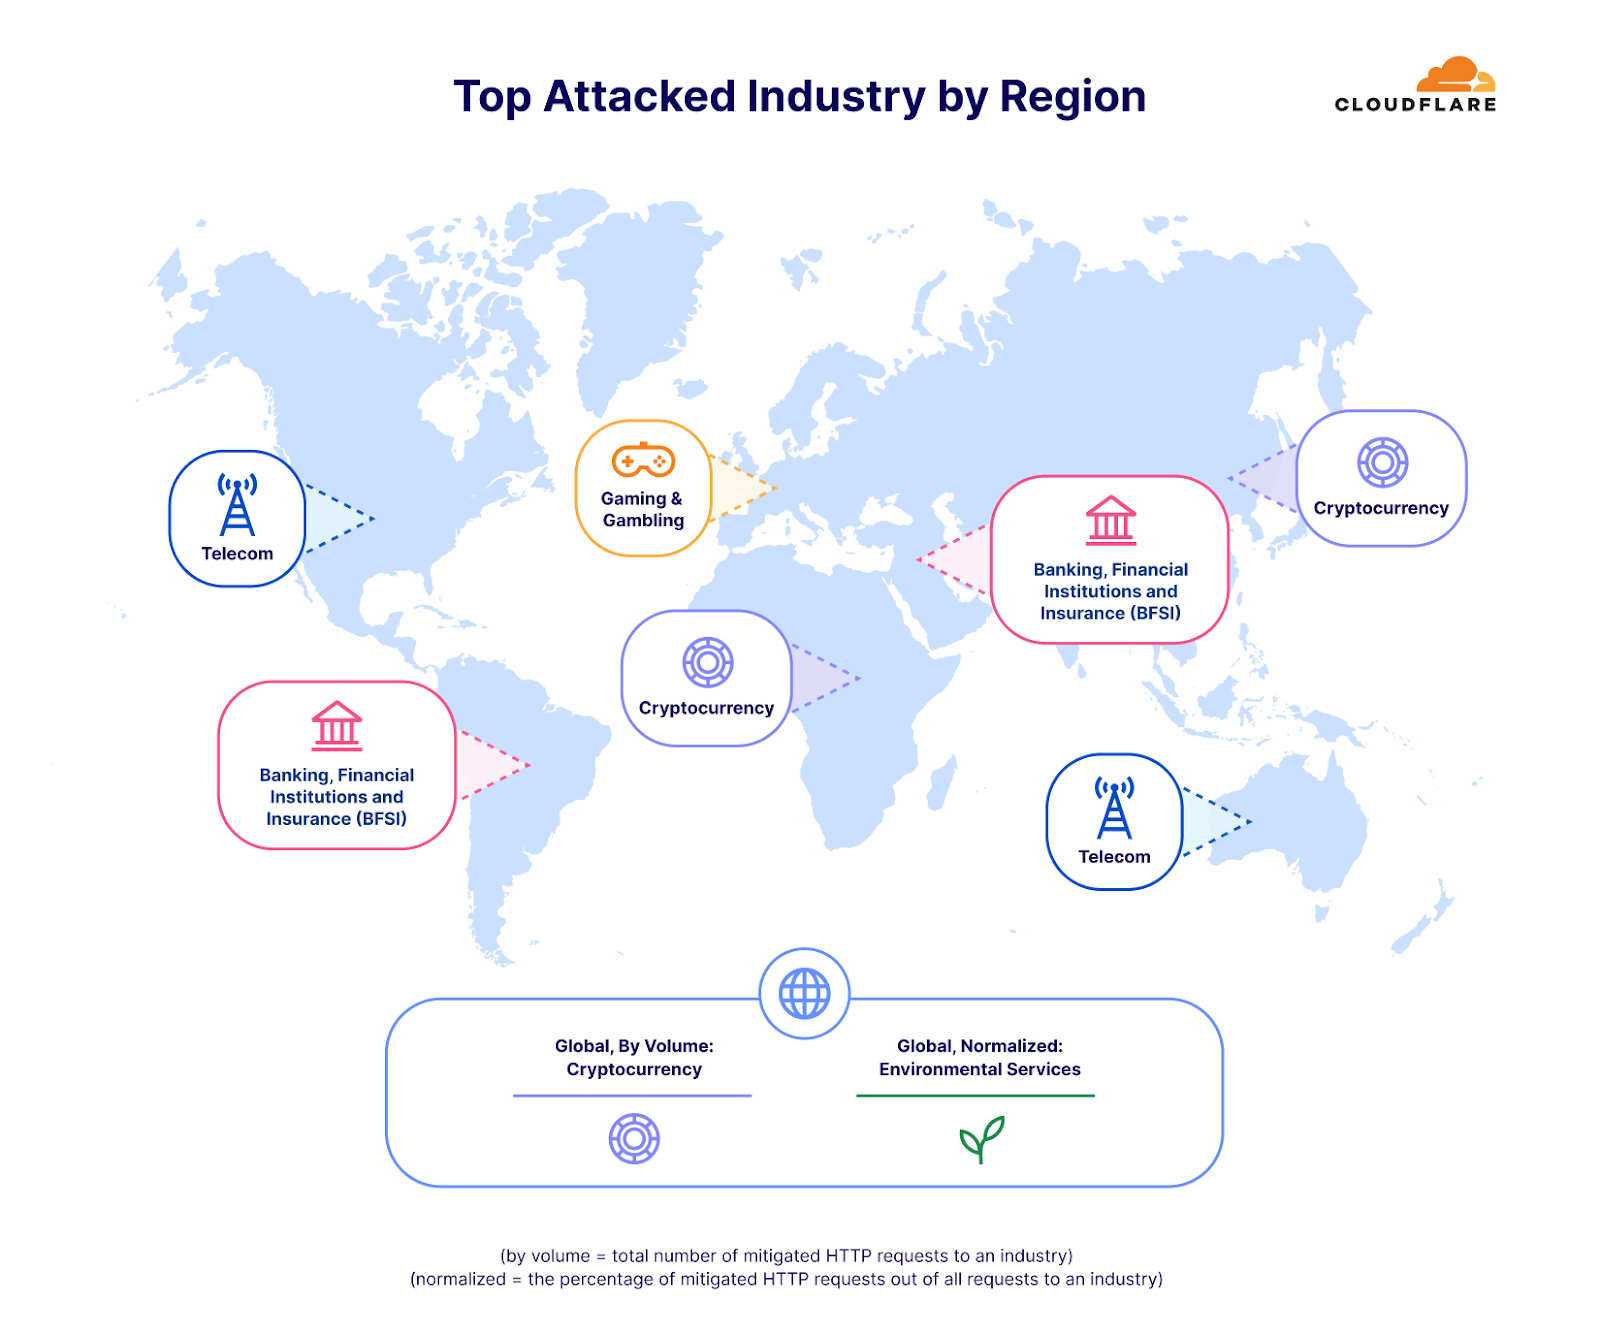
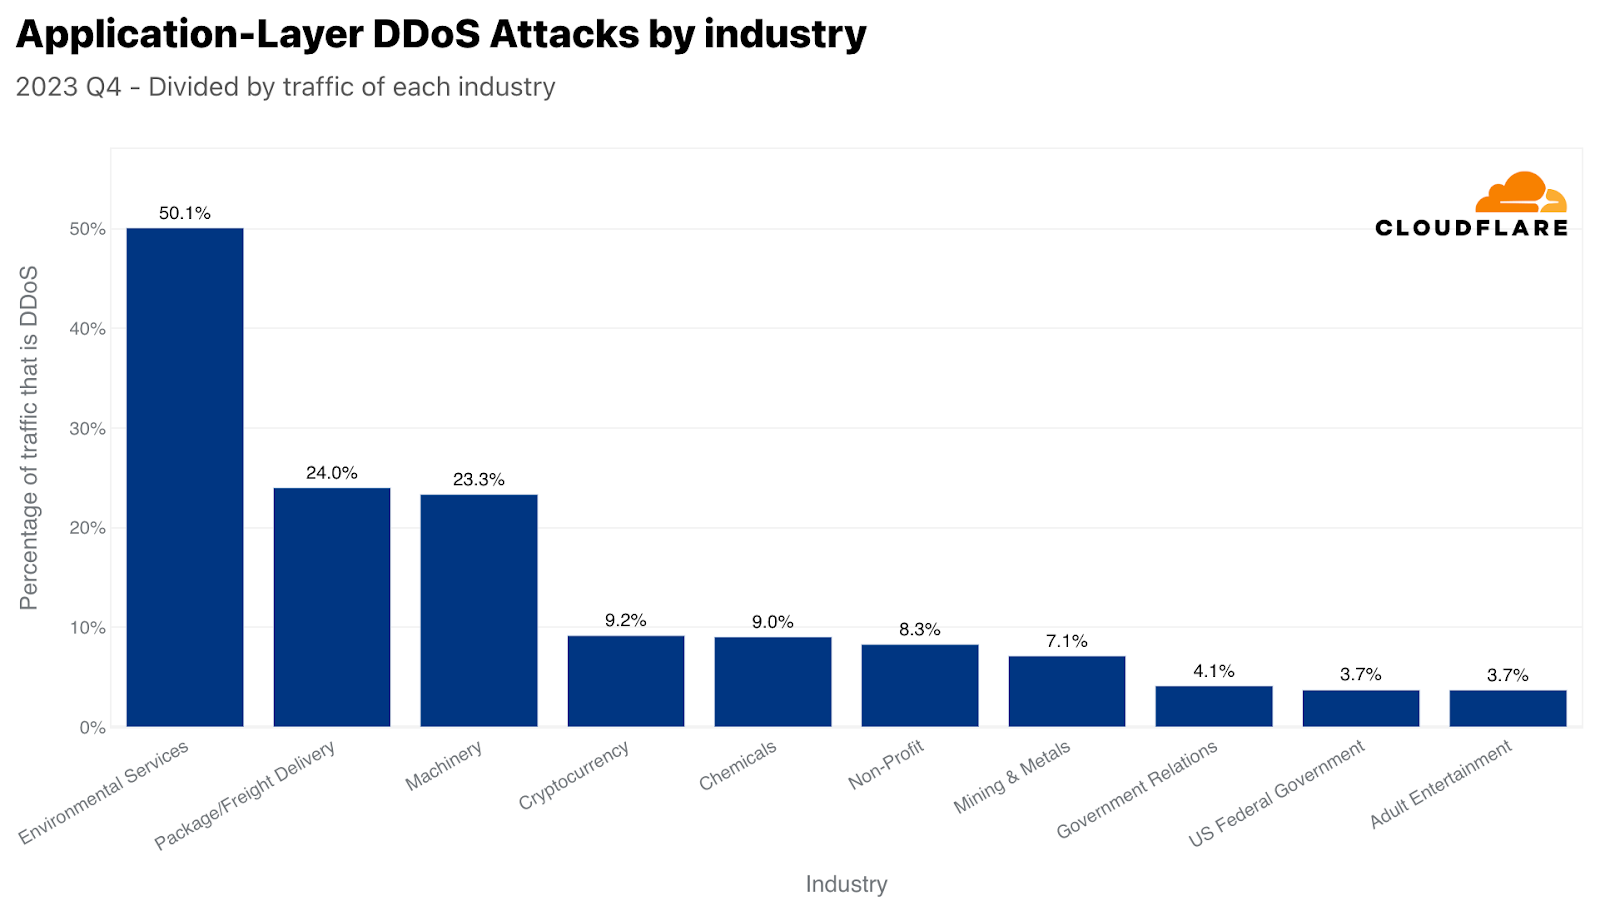
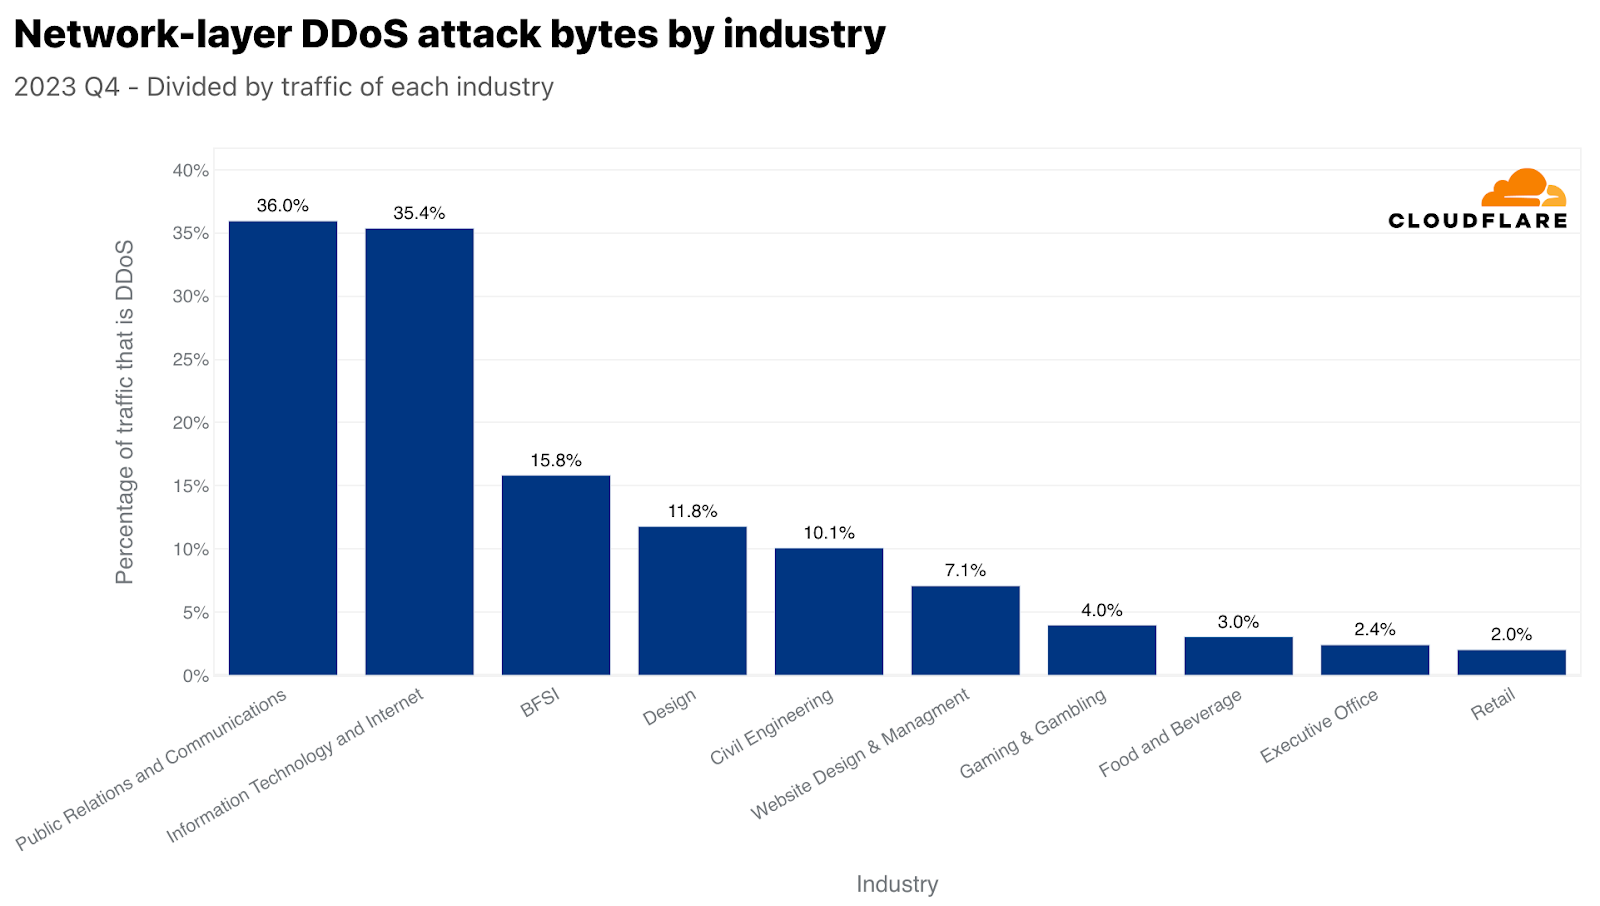
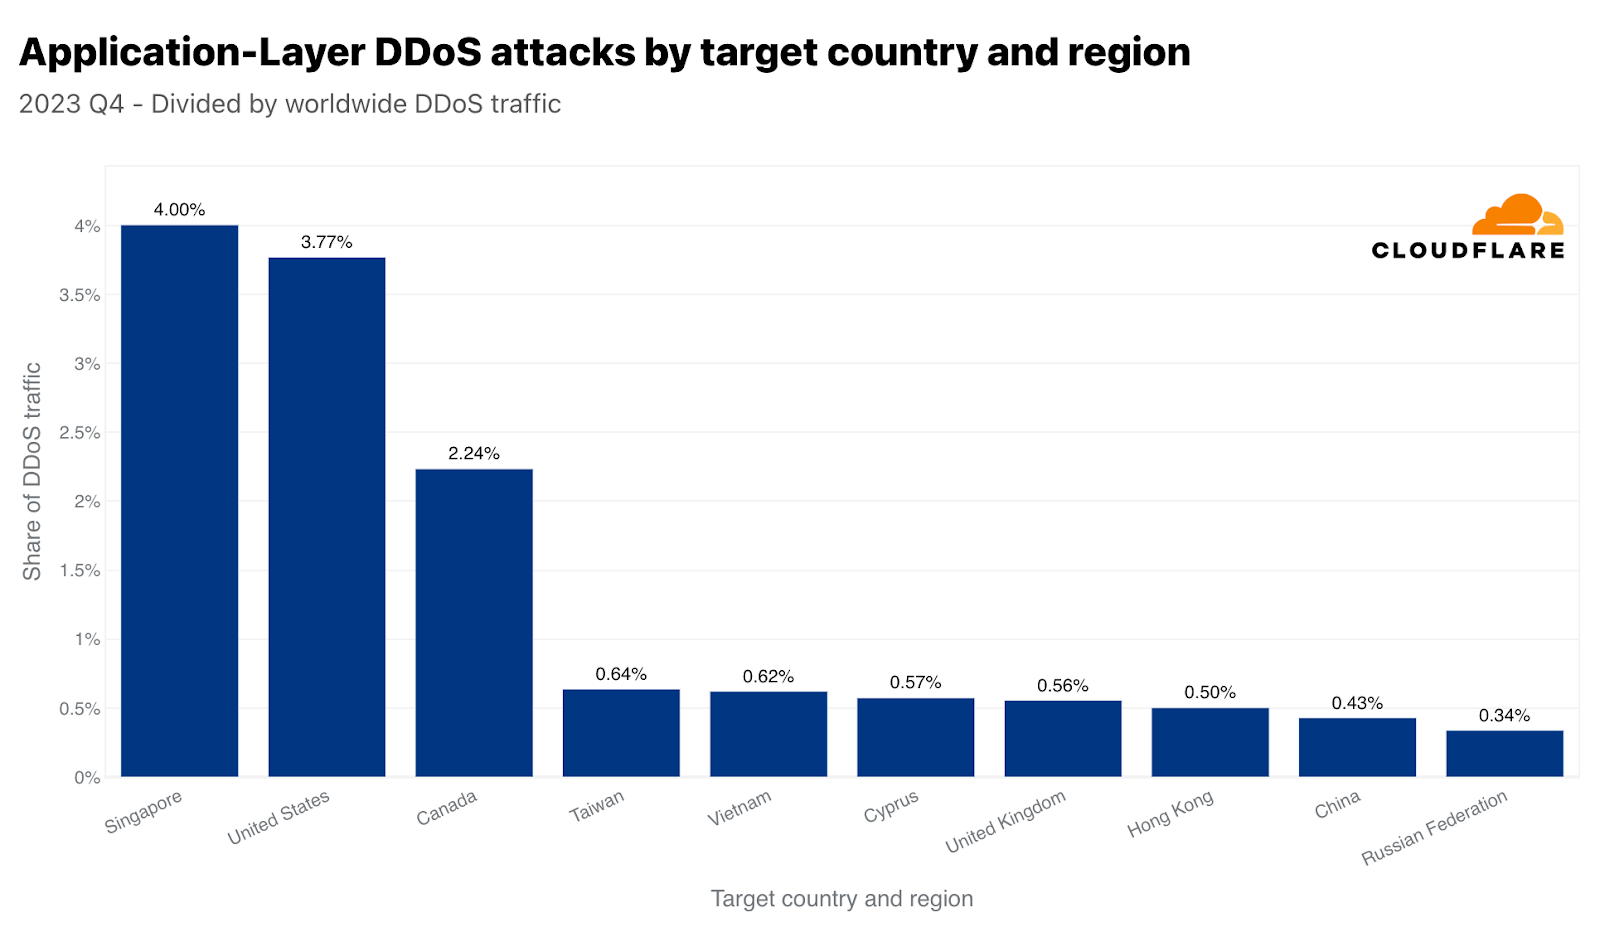
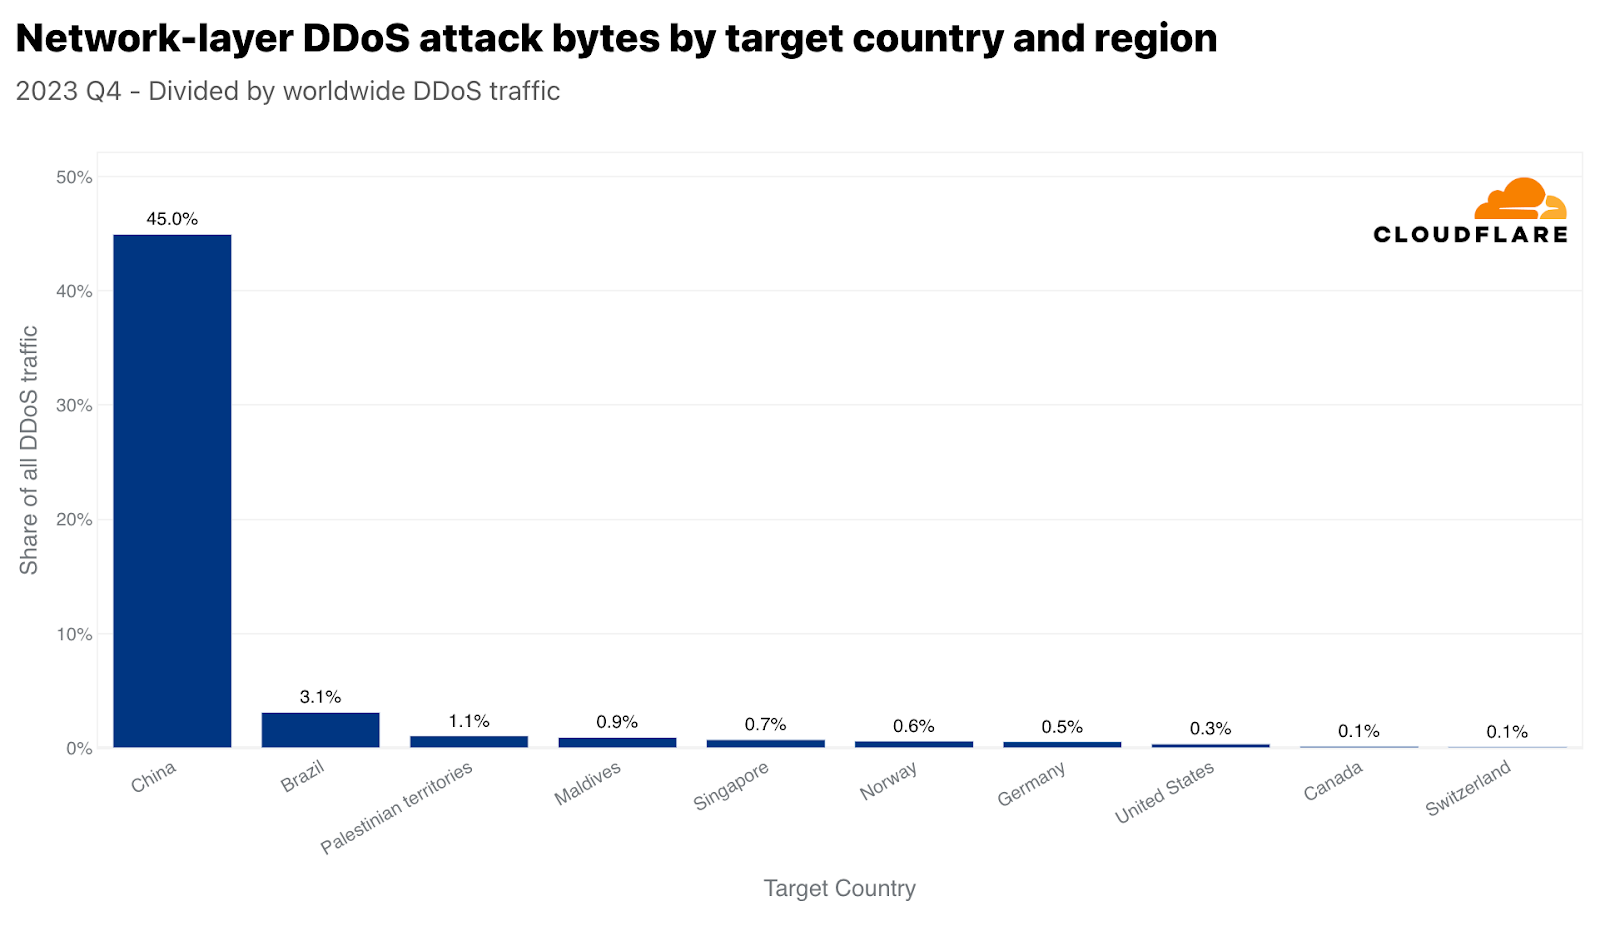
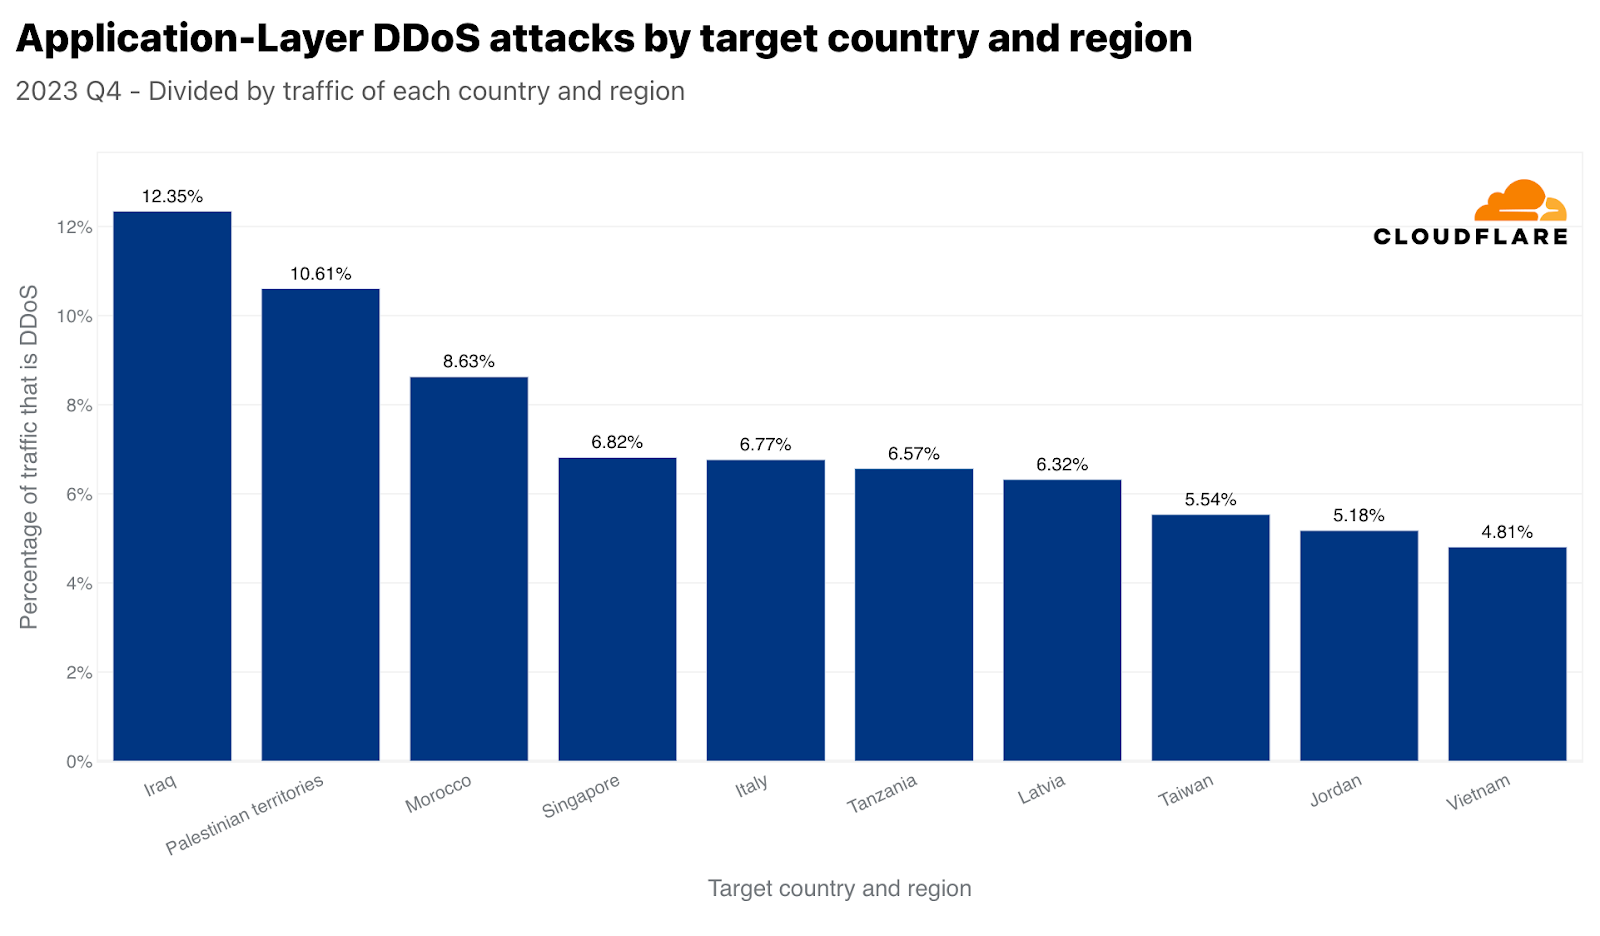
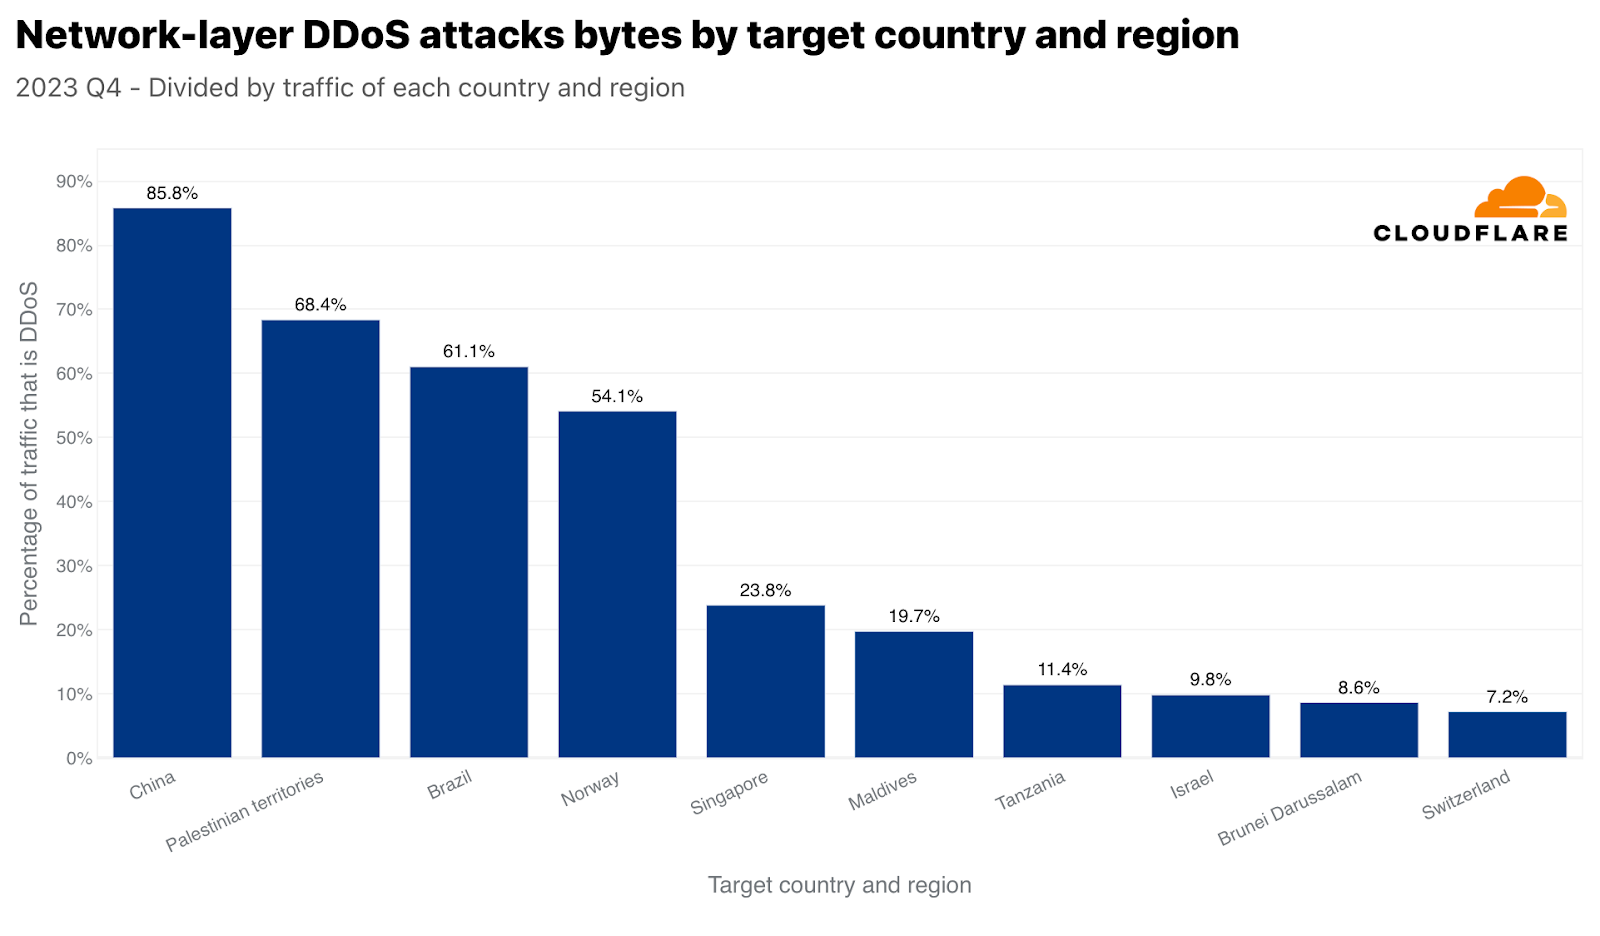
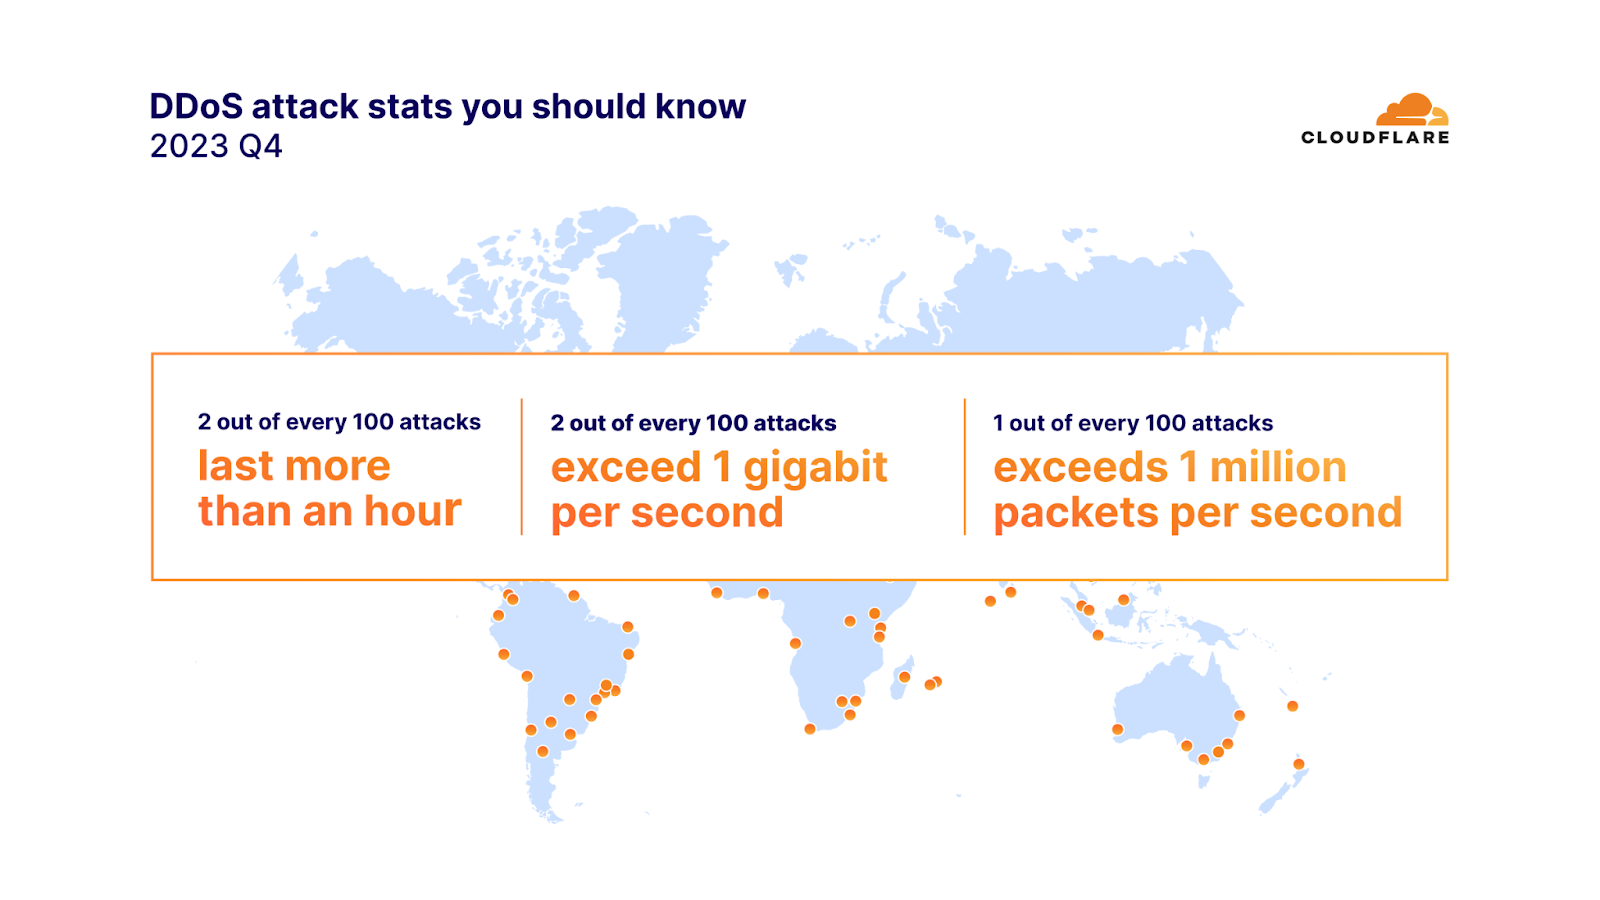
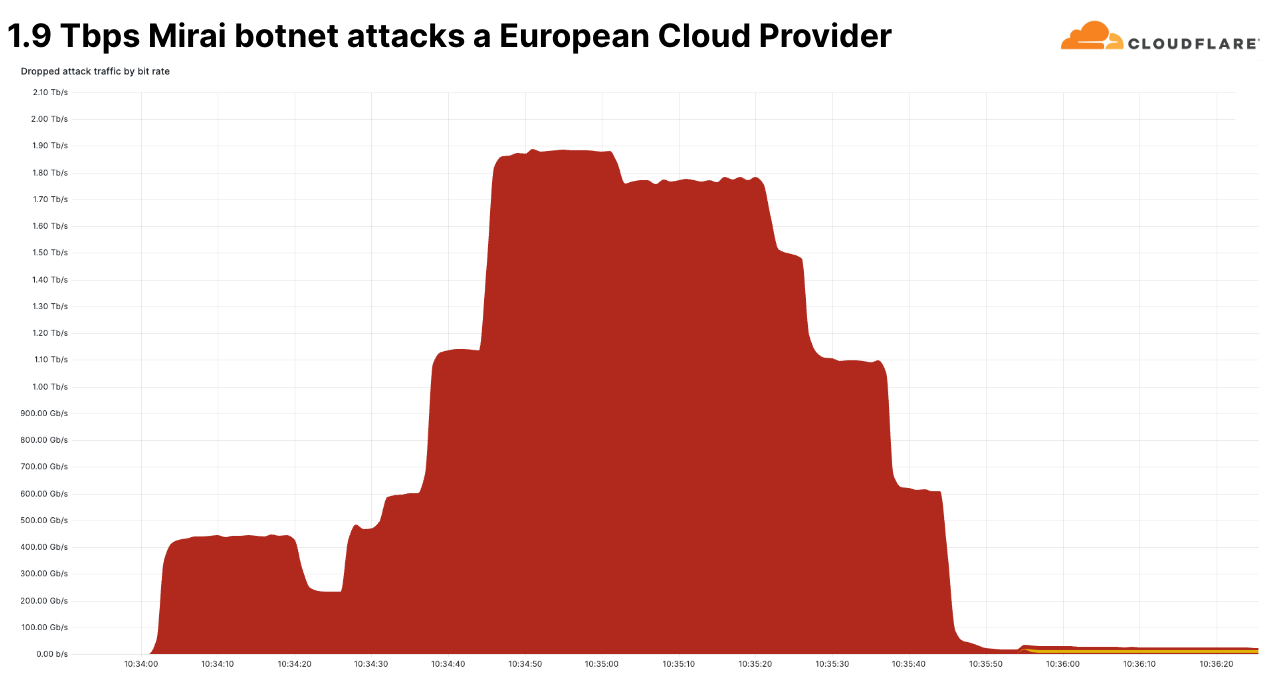
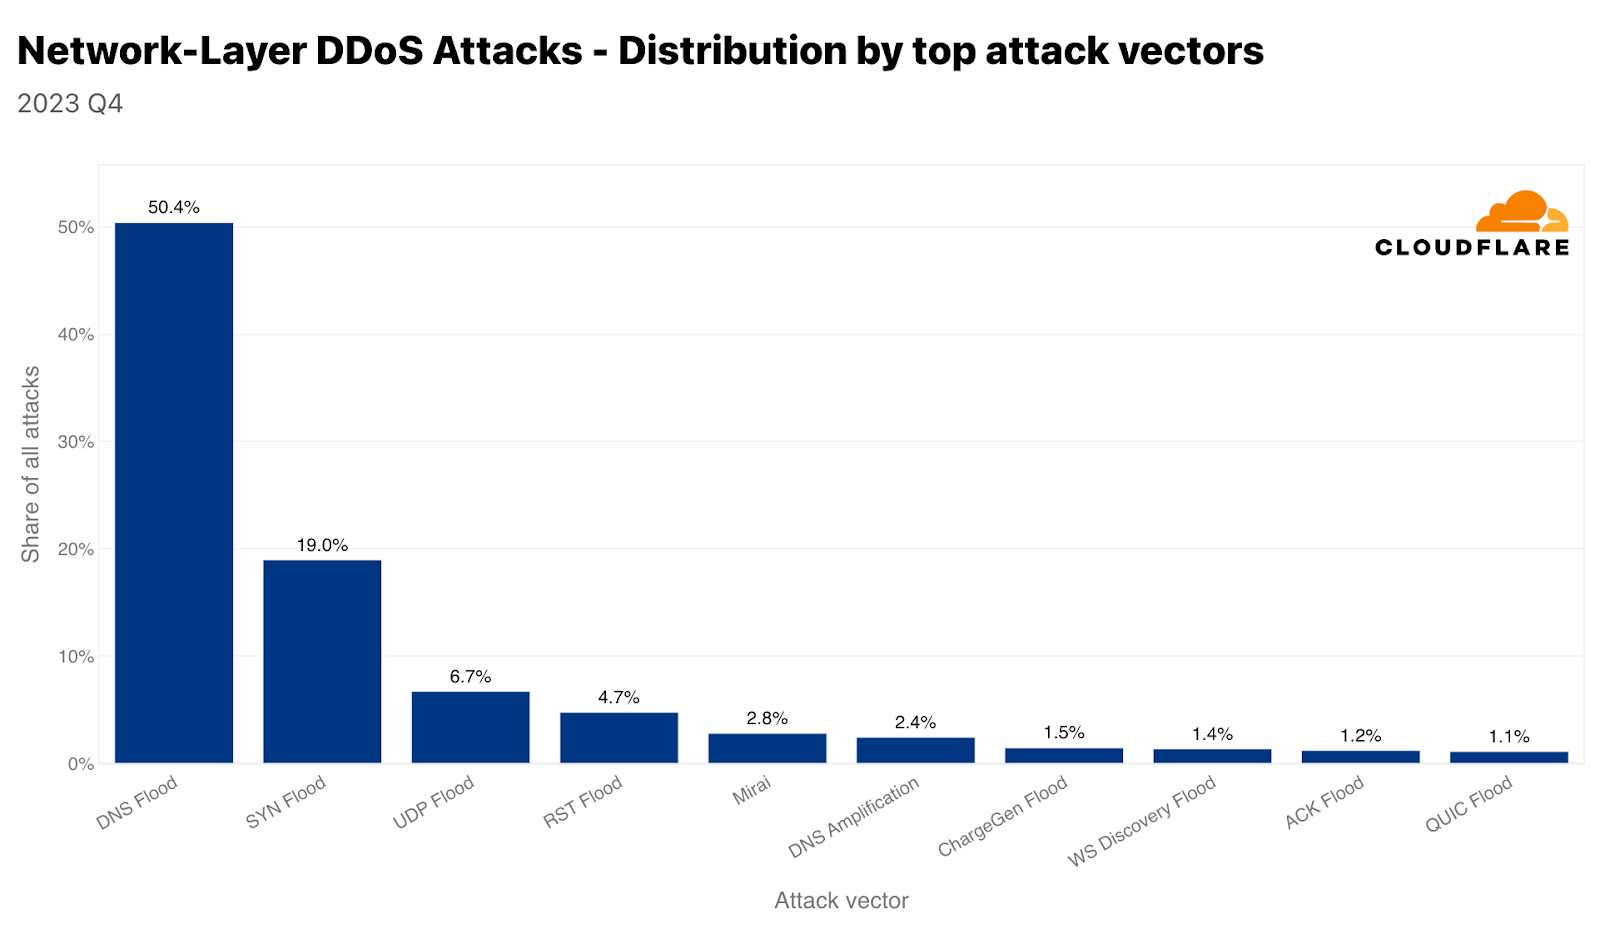
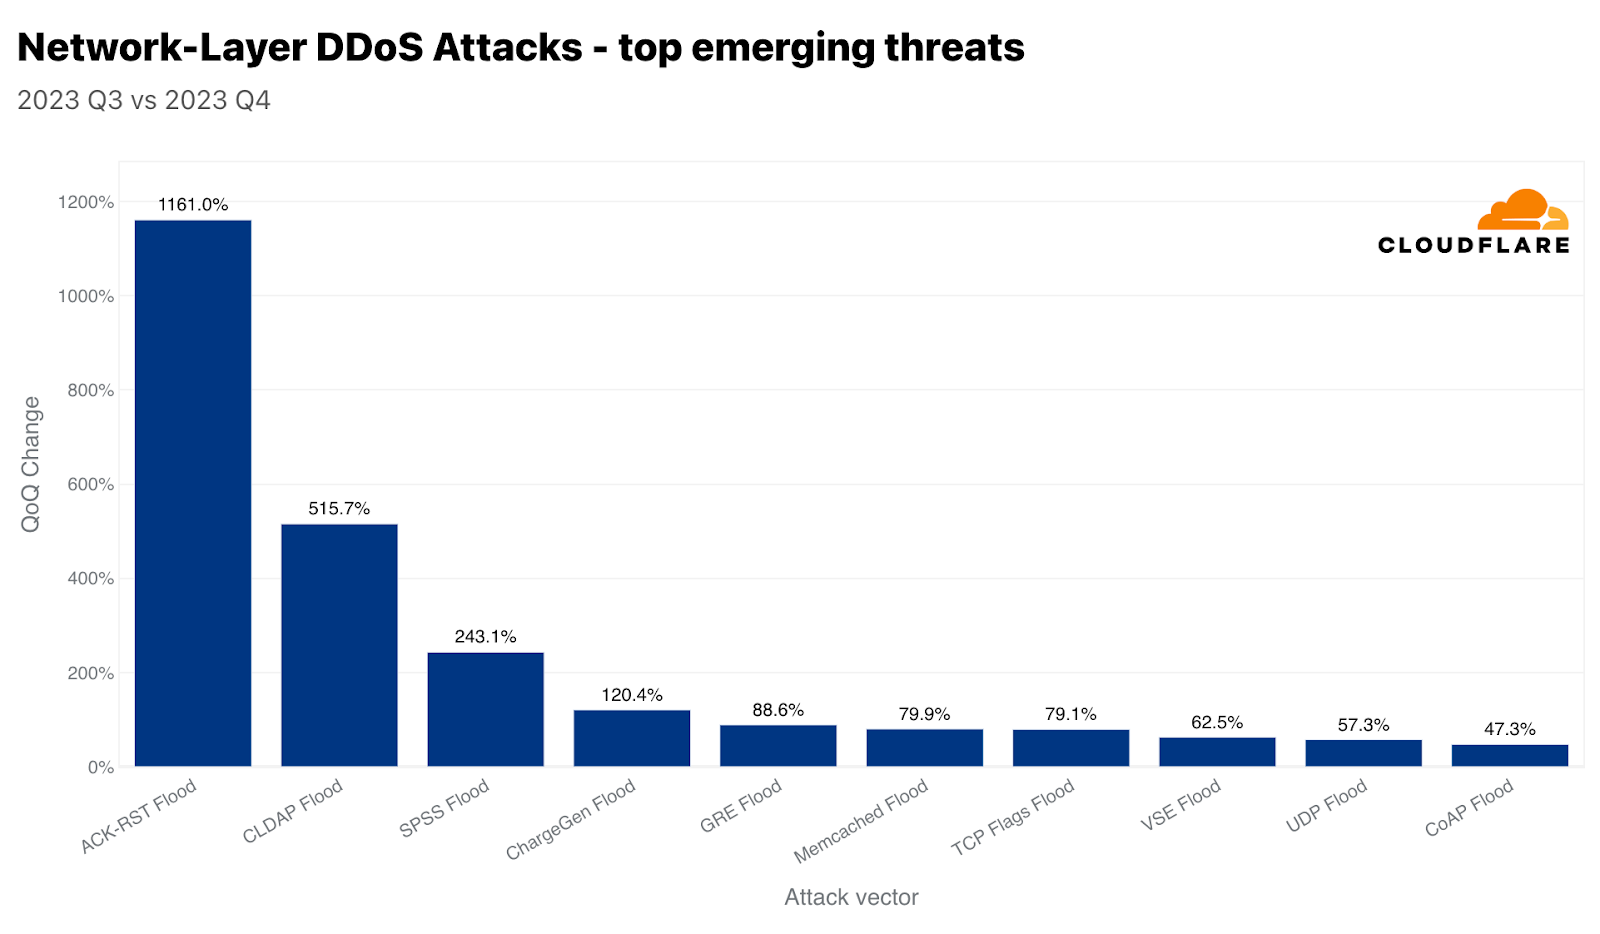
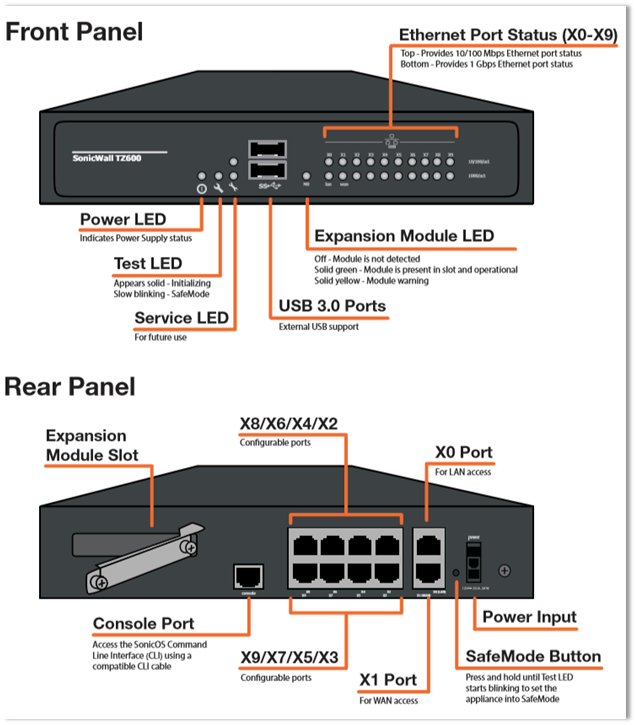
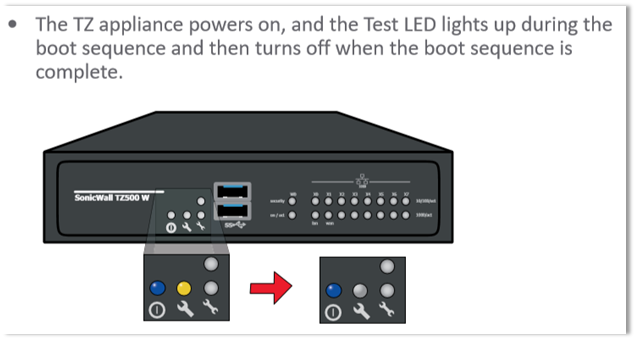
 NOTE: In the SonicWall TZ Series appliances there are two Service LEDs, which are reserved to reflect “Services” in the future, however in current SonicOS versions, they are used to reflect presence of the Alarms.