Speeding up your (WordPress) website is a few clicks away

22/06/2023

Every day, website visitors spend far too much time waiting for websites to load in their browsers. This waiting is partially due to browsers not knowing which resources are critically important so they can prioritize them ahead of less-critical resources. In this blog we will outline how millions of websites across the Internet can improve their performance by specifying which critical content loads first with Cloudflare Workers and what Cloudflare will do to make this easier by default in the future.

Popular Content Management Systems (CMS) like WordPress have made attempts to influence website resource priority, for example through techniques like lazy loading images. When done correctly, the results are magical. Performance is optimized between the CMS and browser without needing to implement any changes or coding new prioritization strategies. However, we’ve seen that these default priorities have opportunities to improve greatly.

In this co-authored blog with Google’s Patrick Meenan we will explain where the opportunities exist to improve website performance, how to check if a specific site can improve performance, and provide a small JavaScript snippet which can be used with Cloudflare Workers to do this optimization for you.

What happens when a browser receives the response?

Before we dive into where the opportunities are to improve website performance, let’s take a step back to understand how browsers load website assets by default.

After the browser sends a HTTP request to a server, it receives a HTTP response containing information like status codes, headers, and the requested content. The browser carefully analyzes the response’s status code and response headers to ensure proper handling of the content.

Next, the browser processes the content itself. For HTML responses, the browser extracts important information from the <head> section of the HTML, such as the page title, stylesheets, and scripts. Once this information is parsed, the browser moves on to the response <body> which has the actual page content. During this stage, the browser begins to present the webpage to the visitor.

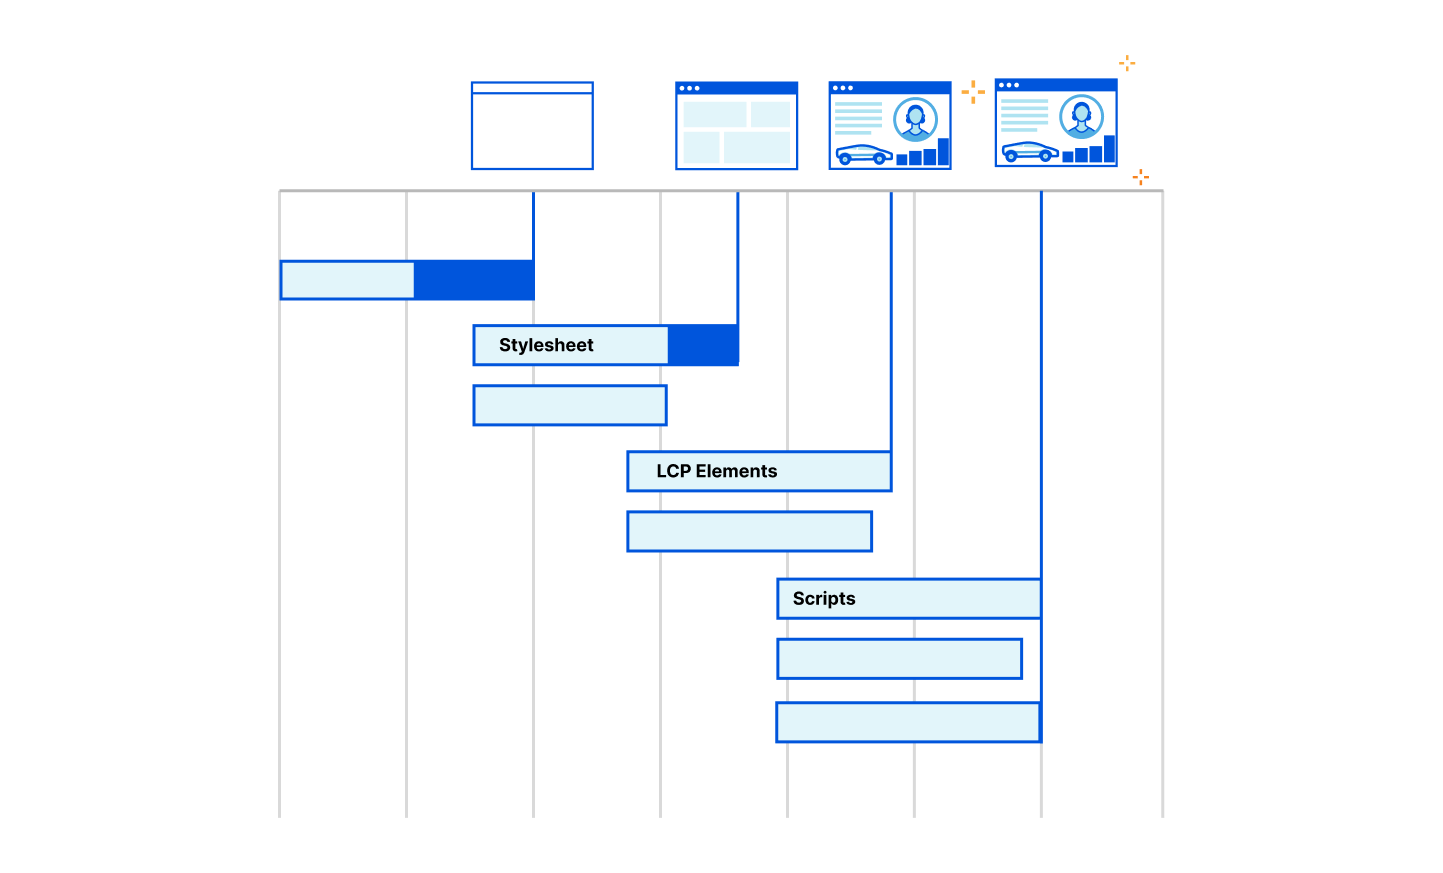
If the response includes additional 3rd party resources like CSS, JavaScript, or other content, the browser may need to fetch and integrate them into the webpage. Typically, browsers like Google Chrome delay loading images until after the resources in the HTML <head> have loaded. This is also known as “blocking” the render of the webpage. However, developers can override this blocking behavior using fetch priority or other methods to boost other content’s priority in the browser. By adjusting an important image’s fetch priority, it can be loaded earlier, which can lead to significant improvements in crucial performance metrics like LCP (Largest Contentful Paint).

Images are so central to web pages that they have become an essential element in measuring website performance from Core Web Vitals. LCP measures the time it takes for the largest visible element, often an image, to be fully rendered on the screen. Optimizing the loading of critical images (like LCP images) can greatly enhance performance, improving the overall user experience and page performance.

But here’s the challenge – a browser may not know which images are the most important for the visitor experience (like the LCP image) until rendering begins. If the developer can identify the LCP image or critical elements before it reaches the browser, its priority can be increased at the server to boost website performance instead of waiting for the browser to naturally discover the critical images.

In our Smart Hints blog, we describe how Cloudflare will soon be able to automatically prioritize content on behalf of website developers, but what happens if there’s a need to optimize the priority of the images right now? How do you know if a website is in a suboptimal state and what can you do to improve?

Using Cloudflare, developers should be able to improve image performance with heuristics that identify likely-important images before the browser parses them so these images can have increased priority and be loaded sooner.

Identifying Image Priority opportunities

Just increasing the fetch priority of all images won’t help if they are lazy-loaded or not critical/LCP images. Lazy-loading is a method that developers use to generally improve the initial load of a webpage if it includes numerous out-of-view elements. For example, on Instagram, when you continually scroll down the application to see more images, it would only make sense to load those images when the user arrives at them otherwise the performance of the page load would be needlessly delayed by the browser eagerly loading these out-of-view images. Instead the highest priority should be given to the LCP image in the viewport to improve performance.

So developers are left in a situation where they need to know which images are on users’ screens/viewports to increase their priority and which are off their screens to lazy-load them.

Recently, we’ve seen attempts to influence image priority on behalf of developers. For example, by default, in WordPress 5.5 all images with an IMG tag and aspect ratios were directed to be lazy-loaded. While there are plugins and other methods WordPress developers can use to boost the priority of LCP images, lazy-loading all images in a default manner and not knowing which are LCP images can cause artificial performance delays in website performance (they’re working on this though, and have partially resolved this for block themes).

So how do we identify the LCP image and other critical assets before they get to the browser?

To evaluate the opportunity to improve image performance, we turned to the HTTP Archive. Out of the approximately 22 million desktop pages tested in February 2023, 46% had an LCP element with an IMG tag. Meaning that for page load metrics, LCP had an image included about half the time. Though, among these desktop pages, 8.5 million had the image in the static HTML delivered with the page, indicating a total potential improvement opportunity of approximately 39% of the desktop pages within the dataset.

In the case of mobile pages, out of the ~28.5 million tested, 40% had an LCP element as an IMG tag. Among these mobile pages, 10.3 million had the image in the static HTML delivered with the page, suggesting a potential improvement opportunity in around 36% of the mobile pages within the dataset.

However, as previously discussed, prioritizing an image won’t be effective if the image is lazy-loaded because the directives are contradictory. In the dataset,  approximately 1.8 million LCP desktop images and 2.4 million LCP mobile images were lazy-loaded.

Therefore, across the Internet, the opportunity to improve image performance would be about ~30% of pages that have an LCP image in the original HTML markup that weren’t lazy-loaded, but with a more advanced Cloudflare Worker, the additional 9% of lazy-loaded LCP images can also be improved improved by removing the lazy-load attribute.

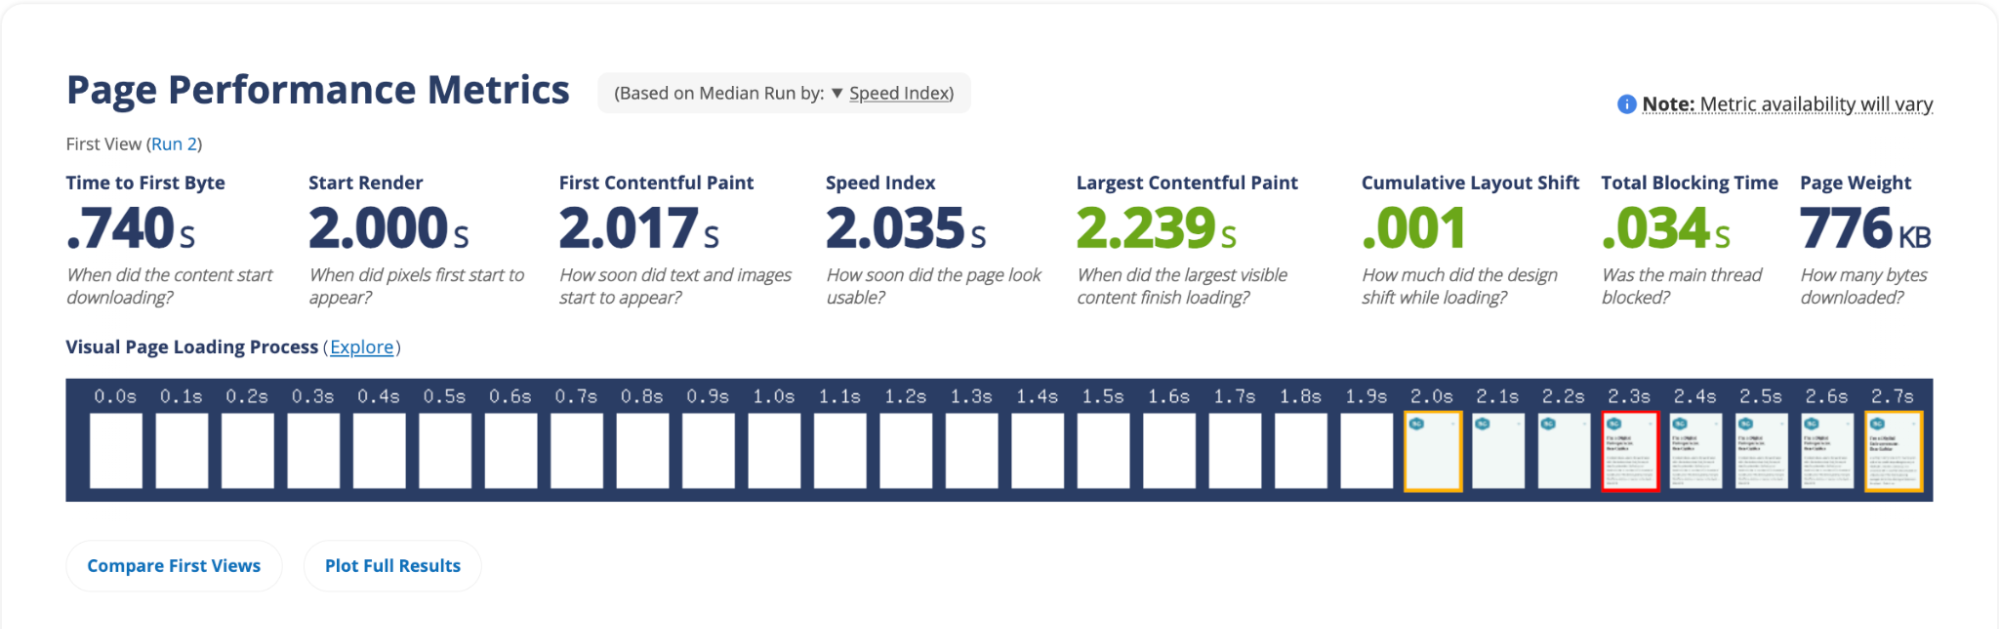
If you’d like to determine which element on your website serves as the LCP element so you can increase the priority or remove any lazy-loading, you can use browser developer tools, or speed tests like Webpagetest or Cloudflare Observatory.

39% of desktop images seems like a lot of opportunity to improve image performance. So the next question is how can Cloudflare determine the LCP image across our network and automatically prioritize them?

Image Index

We thought that how soon the LCP image showed up in the HTML would serve as a useful indicator. So we analyzed the HTTP Archive dataset to see where the cumulative percentage of LCP images are discovered based on their position in the HTML, including lazy-loaded images.

We found that approximately 25% of the pages had the LCP image as the first image in the HTML (around 10% of all pages). Another 25% had the LCP image as the second image. WordPress seemed to arrive at a similar conclusion and recently released a development to remove the default lazy-load attribute from the first image on block themes, but there are opportunities to go further.

Our analysis revealed that implementing a straightforward rule like “do not lazy-load the first four images,” either through the browser, a content management system (CMS), or a Cloudflare Worker could address approximately 75% of the issue of lazy-loading LCP images (example Worker below).

Ignoring small images

In trying to find other ways to identify likely LCP images we next turned to the size of the image. To increase the likelihood of getting the LCP image early in the HTML, we looked into ignoring “small” images as they are unlikely to be big enough to be a LCP element. We explored several sizes and 10,000 pixels (less than 100×100) was a pretty reliable threshold that didn’t skip many LCP images and avoided a good chunk of the non-LCP images.

By ignoring small images (<10,000px), we found that the first image became the LCP image in approximately 30-34% of cases. Adding the second image increased this percentage to 56-60% of pages.

Therefore, to improve image priority, a potential approach could involve assigning a higher priority to the first four “not-small” images.

Chrome 114 Image Prioritization Experiment

An experiment running in Chrome 114 does exactly what we described above. Within the browser there are a few different prioritization knobs to play with that aren’t web-exposed so we have the opportunity to assign a “medium” priority to images that we want to boost automatically (directly controlling priority with “fetch priority” lets you set high or low). This will let us move the images ahead of other images, async scripts and parser-blocking scripts late in the body but still keep the boosted image priority below any high-priority requests, particularly dynamically-injected blocking scripts.

We are experimenting with boosting the priority of varying numbers of images (2, 5 and 10) and with allowing one of those medium-priority images to load at a time during Chromes “tight” mode (when it is loading the render-blocking resources in the head) to increase the likelihood that the LCP image will be available when the first paint is done.

The data is still coming in and no “ship” decisions have been made yet but the early results are very promising, improving the LCP time across the entire web for all arms of the experiment (not by massive amounts but moving the metrics of the whole web is notoriously difficult).

How to use Cloudflare Workers to boost performance

Now that we’ve seen that there is a large opportunity across the Internet for helping prioritize images for performance and how to identify images on individual pages that are likely LCP images, the question becomes, what would the results be of implementing a network-wide rule that could boost image priority from this study?

We built a test worker and deployed it on some WordPress test sites with our friends at Rocket.net, a WordPress hosting platform focused on performance. This worker boosts the priority of the first four images while removing the lazy-load attribute, if present. When deployed we saw good performance results and the expected image prioritization.

export default {
  async fetch(request) {
    const response = await fetch(request);
 
    // Check if the response is HTML
    const contentType = response.headers.get('Content-Type');
    if (!contentType || !contentType.includes('text/html')) {
      return response;
    }
 
    const transformedResponse = transformResponse(response);
 
    // Return the transformed response with streaming enabled
    return transformedResponse;
  },
};
 
async function transformResponse(response) {
  // Create an HTMLRewriter instance and define the image transformation logic
  const rewriter = new HTMLRewriter()
    .on('img', new ImageElementHandler());
 
  const transformedBody = await rewriter.transform(response).text()
 
  const transformresponse = new Response(transformedBody, response)
 
  // Return the transformed response with streaming enabled
  return transformresponse
}
 
class ImageElementHandler {
  constructor() {
    this.imageCount = 0;
    this.processedImages = new Set();
  }
 
  element(element) {
    const imgSrc = element.getAttribute('src');
 
    // Check if the image is small based on Chrome's criteria
    if (imgSrc && this.imageCount < 4 && !this.processedImages.has(imgSrc) && !isImageSmall(element)) {
      element.removeAttribute('loading');
      element.setAttribute('fetchpriority', 'high');
      this.processedImages.add(imgSrc);
      this.imageCount++;
    }
  }
}
 
function isImageSmall(element) {
  // Check if the element has width and height attributes
  const width = element.getAttribute('width');
  const height = element.getAttribute('height');
 
  // If width or height is 0, or width * height < 10000, consider the image as small
  if ((width && parseInt(width, 10) === 0) || (height && parseInt(height, 10) === 0)) {
    return true;
  }
 
  if (width && height) {
    const area = parseInt(width, 10) * parseInt(height, 10);
    if (area < 10000) {
      return true;
    }
  }
 
  return false;
}

When testing the Worker, we saw that default image priority was boosted into “high” for the first four images and the fifth image remained “low.” This resulted in an LCP range of “good” from a speed test. While this initial test is not a dispositive indicator that the Worker will boost performance in every situation, the results are promising and we look forward to continuing to experiment with this idea.

While we’ve experimented with WordPress sites to illustrate the issues and potential performance benefits, this issue is present across the Internet.

Website owners can help us experiment with the Worker above to improve the priority of images on their websites or edit it to be more specific by targeting likely LCP elements. Cloudflare will continue experimenting using a very similar process to understand how to safely implement a network-wide rule to ensure that images are correctly prioritized across the Internet and performance is boosted without the need to configure a specific Worker.

Automatic Platform Optimization

Cloudflare’s Automatic Platform Optimization (APO) is a plugin for WordPress which allows Cloudflare to deliver your entire WordPress site from our network ensuring consistent, fast performance for visitors. By serving cached sites, APO can improve performance metrics. APO does not currently have a way to prioritize images over other assets to improve browser render metrics or dynamically rewrite HTML, techniques we’ve discussed in this post. Although this presents a potential opportunity for future development, it requires thorough testing to ensure safe and reliable support.

In the future we’ll look to include the techniques discussed today as part of APO, however in the meantime we recommend using Snippets (and Experiments) to test with the code example above to see the performance impact on your website.

Get in touch!

If you are interested in using the JavaScript above, we recommended testing with Workers or using Cloudflare Snippets. We’d love to hear from you on what your results were. Get in touch via social media and share your experiences.

We protect entire corporate networks, help customers build Internet-scale applications efficiently, accelerate any website or Internet applicationward off DDoS attacks, keep hackers at bay, and can help you on your journey to Zero Trust.

Visit 1.1.1.1 from any device to get started with our free app that makes your Internet faster and safer.

To learn more about our mission to help build a better Internet, start here. If you’re looking for a new career direction, check out our open positions.

Source :
https://blog.cloudflare.com/speeding-up-your-website-in-a-few-clicks/

Introducing the Cloudflare Radar Internet Quality Page

23/06/2023

Internet connections are most often marketed and sold on the basis of “speed”, with providers touting the number of megabits or gigabits per second that their various service tiers are supposed to provide. This marketing has largely been successful, as most subscribers believe that “more is better”. Furthermore, many national broadband plans in countries around the world include specific target connection speeds. However, even with a high speed connection, gamers may encounter sluggish performance, while video conference participants may experience frozen video or audio dropouts. Speeds alone don’t tell the whole story when it comes to Internet connection quality.

Additional factors like latency, jitter, and packet loss can significantly impact end user experience, potentially leading to situations where higher speed connections actually deliver a worse user experience than lower speed connections. Connection performance and quality can also vary based on usage – measured average speed will differ from peak available capacity, and latency varies under loaded and idle conditions.

The new Cloudflare Radar Internet Quality page

A little more than three years ago, as residential Internet connections were strained because of the shift towards working and learning from home due to the COVID-19 pandemic, Cloudflare announced the speed.cloudflare.com speed test tool, which enabled users to test the performance and quality of their Internet connection. Within the tool, users can download the results of their individual test as a CSV, or share the results on social media. However, there was no aggregated insight into Cloudflare speed test results at a network or country level to provide a perspective on connectivity characteristics across a larger population.

Today, we are launching these long-missing aggregated connection performance and quality insights on Cloudflare Radar. The new Internet Quality page provides both country and network (autonomous system) level insight into Internet connection performance (bandwidth) and quality (latencyjitter) over time. (Your Internet service provider is likely an autonomous system with its own autonomous system number (ASN), and many large companies, online platforms, and educational institutions also have their own autonomous systems and associated ASNs.) The insights we are providing are presented across two sections: the Internet Quality Index (IQI), which estimates average Internet quality based on aggregated measurements against a set of Cloudflare & third-party targets, and Connection Quality, which presents peak/best case connection characteristics based on speed.cloudflare.com test results aggregated over the previous 90 days. (Details on our approach to the analysis of this data are presented below.)

Users may note that individual speed test results, as well as the aggregate speed test results presented on the Internet Quality page will likely differ from those presented by other speed test tools. This can be due to a number of factors including differences in test endpoint locations (considering both geographic and network distance), test content selection, the impact of “rate boosting” by some ISPs, and testing over a single connection vs. multiple parallel connections. Infrequent testing (on any speed test tool) by users seeking to confirm perceived poor performance or validate purchased speeds will also contribute to the differences seen in the results published by the various speed test platforms.

And as we announced in April, Cloudflare has partnered with Measurement Lab (M-Lab) to create a publicly-available, queryable repository for speed test results. M-Lab is a non-profit third-party organization dedicated to providing a representative picture of Internet quality around the world. M-Lab produces and hosts the Network Diagnostic Tool, which is a very popular network quality test that records millions of samples a day. Given their mission to provide a publicly viewable, representative picture of Internet quality, we chose to partner with them to provide an accurate view of your Internet experience and the experience of others around the world using openly available data.

Connection speed & quality data is important

While most advertisements for fixed broadband and mobile connectivity tend to focus on download speeds (and peak speeds at that), there’s more to an Internet connection, and the user’s experience with that Internet connection, than that single metric. In addition to download speeds, users should also understand the upload speeds that their connection is capable of, as well as the quality of the connection, as expressed through metrics known as latency and jitter. Getting insight into all of these metrics provides a more well-rounded view of a given Internet connection, or in aggregate, the state of Internet connectivity across a geography or network.

The concept of download speeds are fairly well understood as a measure of performance. However, it is important to note that the average download speeds experienced by a user during common Web browsing activities, which often involves the parallel retrieval of multiple smaller files from multiple hosts, can differ significantly from peak download speeds, where the user is downloading a single large file (such as a video or software update), which allows the connection to reach maximum performance. The bandwidth (speed) available for upload is sometimes mentioned in ISP advertisements, but doesn’t receive much attention. (And depending on the type of Internet connection, there’s often a significant difference between the available upload and download speeds.) However, the importance of upload came to the forefront in 2020 as video conferencing tools saw a surge in usage as both work meetings and school classes shifted to the Internet during the COVID-19 pandemic. To share your audio and video with other participants, you need sufficient upload bandwidth, and this issue was often compounded by multiple people sharing a single residential Internet connection.

Latency is the time it takes data to move through the Internet, and is measured in the number of milliseconds that it takes a packet of data to go from a client (such as your computer or mobile device) to a server, and then back to the client. In contrast to speed metrics, lower latency is preferable. This is especially true for use cases like online gaming where latency can make a difference between a character’s life and death in the game, as well as video conferencing, where higher latency can cause choppy audio and video experiences, but it also impacts web page performance. The latency metric can be further broken down into loaded and idle latency. The former measures latency on a loaded connection, where bandwidth is actively being consumed, while the latter measures latency on an “idle” connection, when there is no other network traffic present. (These specific loaded and idle definitions are from the device’s perspective, and more specifically, from the speed test application’s perspective. Unless the speed test is being performed directly from a router, the device/application doesn’t have insight into traffic on the rest of the network.) Jitter is the average variation found in consecutive latency measurements, and can be measured on both idle and loaded connections. A lower number means that the latency measurements are more consistent. As with latency, Internet connections should have minimal jitter, which helps provide more consistent performance.

Our approach to data analysis

The Internet Quality Index (IQI) and Connection Quality sections get their data from two different sources, providing two different (albeit related) perspectives. Under the hood they share some common principles, though.

IQI builds upon the mechanism we already use to regularly benchmark ourselves against other industry players. It is based on end user measurements against a set of Cloudflare and third-party targets, meant to represent a pattern that has become very common in the modern Internet, where most content is served from distribution networks with points of presence spread throughout the world. For this reason, and by design, IQI will show worse results for regions and Internet providers that rely on international (rather than peering) links for most content.

IQI is also designed to reflect the traffic load most commonly associated with web browsing, rather than more intensive use. This, and the chosen set of measurement targets, effectively biases the numbers towards what end users experience in practice (where latency plays an important role in how fast things can go).

For each metric covered by IQI, and for each ASN, we calculate the 25th percentile, median, and 75th percentile at 15 minute intervals. At the country level and above, the three calculated numbers for each ASN visible from that region are independently aggregated. This aggregation takes the estimated user population of each ASN into account, biasing the numbers away from networks that source a lot of automated traffic but have few end users.

The Connection Quality section gets its data from the Cloudflare Speed Test tool, which exercises a user’s connection in order to see how well it is able to perform. It measures against the closest Cloudflare location, providing a good balance of realistic results and network proximity to the end user. We have a presence in 285 cities around the world, allowing us to be pretty close to most users.

Similar to the IQI, we calculate the 25th percentile, median, and 75th percentile for each ASN. But here these three numbers are immediately combined using an operation called the trimean — a single number meant to balance the best connection quality that most users have, with the best quality available from that ASN (users may not subscribe to the best available plan for a number of reasons).

Because users may choose to run a speed test for different motives at different times, and also because we take privacy very seriously and don’t record any personally identifiable information along with test results, we aggregate at 90-day intervals to capture as much variability as we can.

At the country level and above, the calculated trimean for each ASN in that region is aggregated. This, again, takes the estimated user population of each ASN into account, biasing the numbers away from networks that have few end users but which may still have technicians using the Cloudflare Speed Test to assess the performance of their network.

The new Internet Quality page includes three views: Global, country-level, and autonomous system (AS). In line with the other pages on Cloudflare Radar, the country-level and AS pages show the same data sets, differing only in their level of aggregation. Below, we highlight the various components of the Internet Quality page.

Global

The top section of the global (worldwide) view includes time series graphs of the Internet Quality Index metrics aggregated at a continent level. The time frame shown in the graphs is governed by the selection made in the time frame drop down at the upper right of the page, and at launch, data for only the last three months is available. For users interested in examining a specific continent, clicking on the other continent names in the legend removes them from the graph. Although continent-level aggregation is still rather coarse, it still provides some insight into regional Internet quality around the world.

Further down the page, the Connection Quality section presents a choropleth map, with countries shaded according to the values of the speed, latency, or jitter metric selected from the drop-down menu. Hovering over a country displays a label with the country’s name and metric value, and clicking on the country takes you to the country’s Internet Quality page. Note that in contrast to the IQI section, the Connection Quality section always displays data aggregated over the previous 90 days.

Country-level

Within the country-level page (using Canada as an example in the figures below), the country’s IQI metrics over the selected time frame are displayed. These time series graphs show the median bandwidth, latency, and DNS response time within a shaded band bounded at the 25th and 75th percentile and represent the average expected user experience across the country, as discussed in the Our approach to data analysis section above.

Below that is the Connection Quality section, which provides a summary view of the country’s measured upload and download speeds, as well as latency and jitter, over the previous 90 days. The colored wedges in the Performance Summary graph are intended to illustrate aggregate connection quality at a glance, with an “ideal” connection having larger upload and download wedges and smaller latency and jitter wedges. Hovering over the wedges displays the metric’s value, which is also shown in the table to the right of the graph.

Below that, the Bandwidth and Latency/Jitter histograms illustrate the bucketed distribution of upload and download speeds, and latency and jitter measurements. In some cases, the speed histograms may show a noticeable bar at 1 Gbps, or 1000 ms (1 second) on the latency/jitter histograms. The presence of such a bar indicates that there is a set of measurements with values greater than the 1 Gbps/1000 ms maximum histogram values.

Autonomous system level

Within the upper-right section of the country-level page, a list of the top five autonomous systems within the country is shown. Clicking on an ASN takes you to the Performance page for that autonomous system. For others not displayed in the top five list, you can use the search bar at the top of the page to search by autonomous system name or number. The graphs shown within the AS level view are identical to those shown at a country level, but obviously at a different level of aggregation. You can find the ASN that you are connected to from the My Connection page on Cloudflare Radar.

Exploring connection performance & quality data

Digging into the IQI and Connection Quality visualizations can surface some interesting observations, including characterizing Internet connections, and the impact of Internet disruptions, including shutdowns and network issues. We explore some examples below.

Characterizing Internet connections

Verizon FiOS is a residential fiber-based Internet service available to customers in the United States. Fiber-based Internet services (as opposed to cable-based, DSL, dial-up, or satellite) will generally offer symmetric upload and download speeds, and the FiOS plans page shows this to be the case, offering 300 Mbps (upload & download), 500 Mbps (upload & download), and “1 Gig” (Verizon claims average wired speeds between 750-940 Mbps download / 750-880 Mbps upload) plans. Verizon carries FiOS traffic on AS701 (labeled UUNET due to a historical acquisition), and in looking at the bandwidth histogram for AS701, several things stand out. The first is a rough symmetry in upload and download speeds. (A cable-based Internet service provider, in contrast, would generally show a wide spread of download speeds, but have upload speeds clustered at the lower end of the range.) Another is the peaks around 300 Mbps and 750 Mbps, suggesting that the 300 Mbps and “1 Gig” plans may be more popular than the 500 Mbps plan. It is also clear that there are a significant number of test results with speeds below 300 Mbps. This is due to several factors: one is that Verizon also carries lower speed non-FiOS traffic on AS701, while another is that erratic nature of in-home WiFi often means that the speeds achieved on a test will be lower than the purchased service level.

Traffic shifts drive latency shifts

On May 9, 2023, the government of Pakistan ordered the shutdown of mobile network services in the wake of protests following the arrest of former Prime Minister Imran Khan. Our blog post covering this shutdown looked at the impact from a traffic perspective. Within the post, we noted that autonomous systems associated with fixed broadband networks saw significant increases in traffic when the mobile networks were shut down – that is, some users shifted to using fixed networks (home broadband) when mobile networks were unavailable.

Examining IQI data after the blog post was published, we found that the impact of this traffic shift was also visible in our latency data. As can be seen in the shaded area of the graph below, the shutdown of the mobile networks resulted in the median latency dropping about 25% as usage shifted from higher latency mobile networks to lower latency fixed broadband networks. An increase in latency is visible in the graph when mobile connectivity was restored on May 12.

Bandwidth shifts as a potential early warning sign

On April 4, UK mobile operator Virgin Media suffered several brief outages. In examining the IQI bandwidth graph for AS5089, the ASN used by Virgin Media (formerly branded as NTL), indications of a potential problem are visible several days before the outages occurred, as median bandwidth dropped by about a third, from around 35 Mbps to around 23 Mbps. The outages are visible in the circled area in the graph below. Published reports indicate that the problems lasted into April 5, in line with the lower median bandwidth measured through mid-day.

Submarine cable issues cause slower browsing

On June 5, Philippine Internet provider PLDT Tweeted an advisory that noted “One of our submarine cable partners confirms a loss in some of its internet bandwidth capacity, and thus causing slower Internet browsing.” IQI latency and bandwidth graphs for AS9299, a primary ASN used by PLDT, shows clear shifts starting around 06:45 UTC (14:45 local time). Median bandwidth dropped by half, from 17 Mbps to 8 Mbps, while median latency increased by 75% from 37 ms to around 65 ms. 75th percentile latency also saw a significant increase, nearly tripling from 63 ms to 180 ms coincident with the reported submarine cable issue.

Conclusion

Making network performance and quality insights available on Cloudflare Radar supports Cloudflare’s mission to help build a better Internet. However, we’re not done yet – we have more enhancements planned. These include making data available at a more granular geographical level (such as state and possibly city), incorporating AIM scores to help assess Internet quality for specific types of use cases, and embedding the Cloudflare speed test directly on Radar using the open source JavaScript module.

In the meantime, we invite you to use speed.cloudflare.com to test the performance and quality of your Internet connection, share any country or AS-level insights you discover on social media (tag @CloudflareRadar on Twitter or @radar@cloudflare.social on Mastodon), and explore the underlying data through the M-Lab repository or the Radar API.

Watch on Cloudflare TV

https://customer-rhnwzxvb3mg4wz3v.cloudflarestream.com/debcbed2114d086c870059ac604eca49/iframe?preload=true&poster=https%3A%2F%2Fcustomer-rhnwzxvb3mg4wz3v.cloudflarestream.com%2Fdebcbed2114d086c870059ac604eca49%2Fthumbnails%2Fthumbnail.jpg%3Ftime%3D1s%26height%3D600

We protect entire corporate networks, help customers build Internet-scale applications efficiently, accelerate any website or Internet applicationward off DDoS attacks, keep hackers at bay, and can help you on your journey to Zero Trust.

Visit 1.1.1.1 from any device to get started with our free app that makes your Internet faster and safer.

To learn more about our mission to help build a better Internet, start here. If you’re looking for a new career direction, check out our open positions.

 Discuss on Hacker News

Source :
https://blog.cloudflare.com/introducing-radar-internet-quality-page/

Three Reasons Endpoint Security Can’t Stop With Just Patching

Last updated: June 14, 2023
James Saturnio
Security Unified Endpoint Management

With remote work now commonplace, having a good cyber hygiene program is crucial for organizations who want to survive in today’s threat landscape. This includes promoting a culture of individual cybersecurity awareness and deploying the right security tools, which are both critical to the program’s success. 

Some of these tools include endpoint patching, endpoint detection and response (EDR) solutions and antivirus software. But considering recent cybersecurity reports, they’re no longer enough to reduce your organization’s external attack surface.

Here are three solid reasons, and real-world situations, that happened to organizations that didn’t take this threat seriously.

  1. AI generated polymorphic exploits can bypass leading security tools
  2. Patching failures and patching fatigue are stifling security teams
  3. Endpoint patching only works for known devices and apps
  4. How can organizations reduce their external attack surface?

1. AI generated polymorphic exploits can bypass leading security tools

Recently, AI-generated polymorphic malware has been developed to bypass EDR and antivirus, leaving security teams with blind spots into threats and vulnerabilities.

Real-world example: ChatGPT Polymorphic Malware Evades “Leading” EDR and Antivirus Solutions

In one report, researchers created polymorphic malware by abusing ChatGPT prompts that evaded detection by antivirus software. In a similar report, researchers created a polymorphic keylogging malware that bypassed an industry-leading automated EDR solution.

These exploits achieved this by mutating its code slightly with every iteration and encrypting its malicious code without a command-and-control (C2) communications channel. 

This mutation is not detectable by traditional signature-based and low-level heuristics detection engines. This means that security time gaps are created for a patch to be developed and released, for the patch to be tested for effectiveness, for the security team to prioritize vulnerabilities and for the IT (Information Technology) team to rollout the patches onto affected systems.

In all, this could mean several weeks or months where an organization will need to rely on other security tools to help them protect critical assets until the patching process is completed successfully.
 

2. Patching failures and patching fatigue are stifling security teams

Unfortunately, updates breaking systems because patches haven’t been rigorously tested occur frequently. Also, some updates don’t completely fix all weaknesses, leaving systems vulnerable to more attacks and requiring additional patches to completely fix. 

Real-world example: Suffolk County’s ransomware attack

The Suffolk County government in New York recently released their findings from the forensic investigation of the data breach and ransomware attack, where the Log4j vulnerability was the threat actor’s entry point to breach their systems. The attack started back in December 2021, which was the same time Apache released security patches for these vulnerabilities. 

Even with updates available, patching never took place, resulting in 400 gigabytes of data being stolen including thousands of social security numbers and an initial ransom demand of $2.5 million.

The ransom was never paid but the loss of personal data and employee productivity and subsequent investigation outweighed the cost of updated cyber hygiene appliances and tools and a final ransom demand of $500,000. The county is still trying to recover and restore all their systems today, having already spent $5.5 million. 

Real world example: An errant Windows server update caused me to work 24-hours straight

From personal experience, I once worked 24 hours straight because one Patch Tuesday, a Microsoft Windows server update was automatically downloaded, installed which promptly broke authentication services between the IoT (Internet of Things) clients and the AAA (authentication, authorization and accounting) servers grinding production to a screeching halt.

Our company’s internal customer reference network that was implemented by our largest customers deployed Microsoft servers for Active Directory Certificate Services (ADCS) and Network Policy Servers (NPS) used for 802.1x EAP-TLS authentication for our IoT network devices managed over the air.

This happened a decade ago, but similar recurrences have also occurred over the next several years, including this update from July 2017, where NPS authentication broke for wireless clients and was repeated in May of last year.

At that time, an immediate fix for the errant patch wasn’t available, so I spent the next 22 hours rebuilding the Microsoft servers for the company’s enterprise public key infrastructure (PKI) and AAA services to restore normal operations. The saving grace was we took the original root certificate authority offline, and the server wasn’t affected by the bad update. 

However, we ended up having to revoke all the identity certificates issued by the subordinate certificate authorities to thousands of devices including routers, switches, firewalls and access points and re-enroll them back into the AAA service with new identity certificates.

Learning from this experience, we disabled automatic updates for all Windows servers and took more frequent backups of critical services and data.
 

3. Endpoint patching only works for known devices and apps 

With the pandemic came the shift to Everywhere Work, where employees worked from home, often connecting their personal devices to their organization’s network. This left security teams with a blind spot to shadow IT. With shadow IT, assets go unmanaged, are potentially out-of-date and cause insecure personal devices and leaky applications. 

The resurgence of bring your own device (BYOD) policies and the lack of company-sanctioned secure remote access quickly expanded the organization’s external attack surface, exposing other attack vectors for threat actors to exploit. 

Real-world example: LastPass’ recent breach 

LastPass is a very popular password manager that stores your passwords in an online vault. It has more than 25 million users and 100,000 businesses. Last year, LastPass experienced a massive data breach involving two security incidents.   

The second incident leveraged data stolen during the first breach to target four DevOps engineers, specifically, their home computers. One senior software developer used their personal Windows desktop to access the corporate development sandbox. The desktop also had an unpatched version of Plex Media Server (CVE-2020-5741) installed.

Plex provided a patch for this vulnerability three years ago. Threat actors used this vulnerability to deliver malware, perform privilege escalation (PE), then a remote code execution (RCE) to access LastPass cloud-based storage and steal DevOps secrets and multi-factor (MFA) and Federation databases.

“Unfortunately, the LastPass employee never upgraded their software to activate the patch,” Plex said in a statement. “For reference, the version that addressed this exploit was roughly 75 versions ago.”

If patching isn’t enough, how can organizations reduce their external attack surface?

Cyber hygiene

Employees are the weakest link to an organization’s cyber hygiene program. Inevitably, they’ll forget to update their personal devices, re-use the same weak password to different internet websites, install leaky applications, and click or tap on phishing links contained within an email, attachment, or text message. 

Combat this by promoting a company culture of cybersecurity awareness and practice vigilance that includes: 

· Ensuring the latest software updates are installed on their personal and corporate devices. 

· Recognizing social engineering attack techniques including the several types of phishing attacks.

· Using multi-factor authentication whenever possible. 

· Installing and automatically updating the databases on antivirus software for desktops and mobile threat defense for mobile devices. 

Continuing education is key to promoting great cyber hygiene within your organization, especially for anti-phishing campaigns.  

Cyber hygiene tool recomendations 

In cybersecurity, the saying goes, “You can’t protect what you can’t see!” Having a complete discovery and accurate inventory of all network-connected hardware, software and data, including shadow IT assets, is the important first step to assessing an organization’s vulnerability risk profile. The asset data should feed into an enterprise endpoint patch management system

Also, consider implementing a risk-based vulnerability management approach to prioritize the overwhelming number of vulnerabilities to only those that pose the greatest risk to your organization. Often included with risk-based vulnerability management solutions is a threat intelligence feed into the patch management system

Threat intelligence is information about known or potential threats to an organization. These threats can come from a variety of sources, like security researchers, government agencies, infrastructure vulnerability and application security scanners, internal and external penetration testing results and even threat actors themselves. 

This information, including specific patch failures and reliability reported from various crowdsourced feeds, can help organizations remove internal patch testing requirements and reduce the time gap to patch deployments to critical assets.

unified endpoint management (UEM) platform is necessary to remotely manage and provide endpoint security to mobile devices including shadow IT and BYOD assets.

The solution can enforce patching to the latest mobile operating system (OS) and applications, provision email and secure remote access profiles including identity credentials and multi-factor authentication (MFA) methods like biometrics, smart cards, security keys, certificate-based or token-based authentication.

The UEM solution should also integrate an AI machine learning-based mobile threat defense (MTD) solution for mobile devices, while desktops require next-generation antivirus (NGAV) with robust heuristics to detect and remediate device, network, and app threats with real-time anti-phishing protection.

And finally, to level the playing field against AI-generated malware, cyber hygiene tools will have to evolve quickly by leveraging AI guidance to keep up with the more sophisticated polymorphic attacks that are on the horizon.

Adding the solutions described above will help deter cyberattacks by putting impediments in front of threat actors to frustrate them and seek out easier targets to victimize. 

About James Saturnio

James Saturnio is the Technical Product Marketing Director for the Technical Marketing Engineering team at Ivanti. He immerses himself in all facets of cybersecurity with over 25 years’ hands-on industry experience. He is an always curious practitioner of the zero trust security framework. Prior to Ivanti, he was with MobileIron for almost 7 years as a Senior Solutions Architect and prior to that, he was at Cisco Systems for 19 years. While at Cisco, he started out as a Technical Assistance Center (TAC) Engineer and then a Technical Leader for the Security Technology and Internet of Things (IoT) business units. He is a former Service Provider and Security Cisco Certified Internetworking Expert (CCIE) and was the main architect for the IoT security architecture that is still used today by Cisco’s lighthouse IoT customers.

Source :
https://www.ivanti.com/blog/three-reasons-endpoint-security-can-t-stop-with-just-patching-or-antivirus

The 8 Best Practices for Reducing Your Organization’s Attack Surface

Last updated: June 20, 2023
Robert Waters
Security Unified Endpoint Management DEX

Increases in attack surface size lead to increased cybersecurity risk. Thus, logically, decreases in attack surface size lead to decreased cybersecurity risk.

While some attack surface management solutions offer remediation capabilities that aid in this effort, remediation is reactive. As with all things related to security and risk management, being proactive is preferred.

The good news is that ASM solutions aren’t the only weapons security teams have in the attack surface fight. There are many steps an organization can take to lessen the exposure of its IT environment and preempt cyberattacks.

How do I reduce my organization’s attack surface?

Unfortunately for everyone but malicious actors, there’s no eliminating your entire attack surface, but the following best practice security controls detailed in this post will help you significantly shrink it:

  1. Reduce complexity 
  2. Adopt a zero trust strategy for logical and physical access control
  3. Evolve to risk-based vulnerability management
  4. Implement network segmentation and microsegmentation
  5. Strengthen software and asset configurations
  6. Enforce policy compliance
  7. Train all employees on cybersecurity policies and best practices
  8. Improve digital employee experience (DEX)

As noted in our attack surface glossary entry, different attack vectors can technically fall under multiple types of attack surfaces — digital, physical and/or human. Similarly, many of the best practices in this post can help you reduce multiple types of attack surfaces.

For that reason, we have included a checklist along with each best practice that signifies which type(s) of attack surface a particular best practice primarily addresses.

#1: Reduce complexity

.

Digital attack surface Physical attack surface Human attack surface 
XX

.

Reduce your cybersecurity attack surface by reducing complexity. Seems obvious, right? And it is. However, many companies have long failed at this seemingly simple step. Not because it’s not obvious, but because it hasn’t always been easy to do.

Research from Randori and ESG reveals seven in 10 organizations were compromised by an unknown, unmanaged or poorly managed internet-facing asset over the past year. Cyber asset attack surface management (CAASM) solutions enable such organizations to identify all their assets — including those that are unauthorized and unmanaged — so they can be secured, managed or even removed from the enterprise network.

Any unused or unnecessary assets, from endpoint devices to network infrastructure, should also be removed from the network and properly discarded.

The code that makes up your software applications is another area where complexity contributes to the size of your attack surface. Work with your development team to identify where opportunities exist to minimize the amount of executed code exposed to malicious actors, which will thereby also reduce your attack surface.

#2: Adopt a zero trust strategy for logical and physical access control

.

Digital attack surface Physical attack surface Human attack surface 
XX

.

The National Institute of Standards and Technology (NIST) defines zero trust as follows:

“A collection of concepts and ideas designed to minimize uncertainty in enforcing accurate, least privilege per-request access decisions in information systems and services in the face of a network viewed as compromised.”

In other words, for every access request, “never trust, always verify.”

Learn how Ivanti can help you adopt the NIST CSF in The NIST Cybersecurity Framework (CSF): Mapping Ivanti’s Solutions to CSF Controls

Taking a zero trust approach to logical access control reduces your organization’s attack surface — and likelihood of data breaches — by continuously verifying posture and compliance and providing least-privileged access.

And while zero trust isn’t a product but a strategy, there are products that can help you implement a zero trust strategy. Chief among those products are those included in the secure access service edge (SASE) framework:

And though it’s not typically viewed in this manner, a zero trust strategy can extend beyond logical access control to physical access control. When it comes to allowing anyone into secure areas of your facilities, remember to never trust, always verify. Mechanisms like access cards and biometrics can be used for this purpose.

#3: Evolve to risk-based vulnerability management

.

Digital attack surface Physical attack surface Human attack surface 
X

.

First, the bad news: the US National Vulnerability Database (US NVD) contains over 160,000 scored vulnerabilities and dozens more are added every day. Now, the good news: a vast majority of vulnerabilities have never been exploited, which means they can’t be used to perpetrate a cyberattack, which means they aren’t part of your attack surface.

In fact, a ransomware research report from Securin, Cyber Security Works (CSW), Ivanti and Cyware showed only 180 of those 160,000+ vulnerabilities were trending active exploits.

Comparison of total NVD vulnerabilities vs. those that endanger an organization

Total NVD graph.
Only approximately 0.1% of all vulnerabilities in the US NVD are trending active exploits that pose an immediate risk to an organization

legacy approach to vulnerability management reliant on stale and static risk scores from the Common Vulnerability Scoring System (CVSS) won’t accurately classify exploited vulnerabilities. And while the Cybersecurity & Infrastructure Security Agency Known Exploited Vulnerabilities (CISA KEV) Catalog is a step in the right direction, it’s incomplete and doesn’t account for the criticality of assets in an organization’s environment.

A true risk-based approach is needed. Risk-based vulnerability management (RBVM) — as its name suggests — is a cybersecurity strategy that prioritizes vulnerabilities for remediation based on the risk they pose to the organization.

Read The Ultimate Guide to Risk-Based Patch Management and discover how to evolve your remediation strategy to a risk-based approach.

RBVM tools ingest data from vulnerability scannerspenetration teststhreat intelligence tools and other security sources and use it to measure risk and prioritize remediation activities.

With the intelligence from their RBVM tool in hand, organizations can then go about reducing their attack surface by remediating the vulnerabilities that pose them the most risk. Most commonly, that involves patching exploited vulnerabilities on the infrastructure side and fixing vulnerable code in the application stack.

#4: Implement network segmentation and microsegmentation

.

Digital attack surface Physical attack surface Human attack surface 
X

.

Once again, borrowing from the NIST glossary, network segmentation is defined as follows:

Splitting a network into sub-networks, for example, by creating separate areas on the network which are protected by firewalls configured to reject unnecessary traffic. Network segmentation minimizes the harm of malware and other threats by isolating it to a limited part of the network.

From this definition, you can see how segmenting can reduce your attack surface by blocking attackers from certain parts of your network. While traditional network segmentation stops those attackers from moving north-south at the network level, microsegmentation stops them from moving east-west at the workload level.

More specifically, microsegmentation goes beyond network segmentation and enforces policies on a more granular basis — for example, by application or device instead of by network.

For example, it can be used to implement restrictions so an IoT device can only communicate with its application server and no other IoT devices, or to prevent someone in one department from accessing any other department’s systems.

#5: Strengthen software and asset configurations

.

Digital attack surface Physical attack surface Human attack surface 
X

.

Operating systems, applications and enterprise assets — such as servers and end user, network and IoT devices — typically come unconfigured or with default configurations that favor ease of deployment and use over security. According to CIS Critical Security Controls (CIS Controls) v8, the following can all be exploitable if left in their default state:

  • Basic controls
  • Open services and ports
  • Default accounts or passwords
  • Pre-configured Domain Name System (DNS) settings
  • Older (vulnerable) protocols
  • Pre-installation of unnecessary software

Clearly, such configurations increase the size of an attack surface. To remedy the situation, Control 4: Secure Configuration of Enterprise Assets and Software of CIS Controls v8 recommends developing and applying strong initial configurations, then continually managing and maintaining those configurations to avoid degrading security of software and assets.

Here are some free resources and tools your team can leverage to help with this effort:

#6: Enforce policy compliance

.

Digital attack surface Physical attack surface Human attack surface 
XX

.

It’s no secret that endpoints are a major contributor to the size of most attack surfaces — especially in the age of Everywhere Work when more employees are working in hybrid and remote roles than ever before. Seven in 10 government employees now work virtually at least part of the time.

It’s hard enough getting employees to follow IT and security policies when they’re inside the office, let alone when 70% of them are spread all over the globe.

Unified endpoint management (UEM) tools ensure universal policy compliance by automatically enforcing policies. This fact should come as no surprise to IT and security professionals, many of whom consider UEM a commodity at this point. In fact, Gartner predicts that 90% of its clients will manage most of their estate with cloud-based UEM tools by just 2025.

Nonetheless, UEM is the best option for enforcing IT and security policy compliance, so I’d be remiss to omit it from this list.

Read The Ultimate Guide to Unified Endpoint Management and learn about the key business benefits and endpoint security use cases for modern UEM solutions.

Additionally, beyond compliance, modern UEM tools offer several other capabilities that can help you identify, manage and reduce your attack surface:

  • Have complete visibility into IT assets by discovering all devices on your network — a key ASM capability for organizations without a CAASM solution.
  • Provision devices with the appropriate software and access permissions, then automatically update that software as needed — no user interactions required.
  • Manage all types of devices across the entire lifecycle, from onboarding to retirement, to ensure they’reproperly discarded once no longer in use.
  • Automatically enforce device configurations (refer to #5: Strengthen software and asset configurations to learn more about the importance of this capability).
  • Support zero trust access and contextual authentication, vulnerability, policy, configuration and data management by integrating with identity, security and remote-access tools. For example, UEM and mobile threat defense (MTD) tools can integrate to enable you to enact risk-based policies to protect mobile devices from compromising the corporate network and its assets.

#7: Train all employees on cybersecurity policies and best practices

.

Digital attack surface Physical attack surface Human attack surface 
X

.

Seventy-four percent of breaches analyzed for the 2023 Verizon Data Breaches Investigation Report (DBIR) involved a human element.

Thus, it should come as no surprise when you review the data from Ivanti’s 2023 Government Cybersecurity Status Report and see the percentages of employees around the world that don’t believe their actions have any impact on their organization’s ability to avert cyberattacks:

Do employees think their own actions matter?

Many employees don’t believe their actions impact their organization’s ability to stay safe from cyberattacks.

In the immortal words of Alexander Pope: “To err is human…” In cybersecurity terms: until AI officially takes over, humans will remain a significant part of your attack surface. And until then, human attack surfaces must be managed and reduced wherever possible.

Thus far, the best way to do that’s proven to be cybersecurity training, both on general best practices and company-specific policies — and definitely don’t forget to include a social engineering module.

Many cybersecurity practitioners agree. When the question “In your experience, what security measure has been the most successful in preventing cyberattacks and data breaches?” was posed in Reddit’s r/cybersecurity subreddit, many of the top comments referenced the need for user education:

Reddit / u/Forbesington
Reddit / u/slybythenighttothecape
Reddit / u/_DudeWhat
Reddit / u/onneseen

To once again borrow from CIS Controls v8, Control 14: Security Awareness and Skills Training encourages organizations to do the following: “Establish and maintain a security awareness program to influence behavior among the workforce to be security conscious and properly skilled to reduce cybersecurity risks to the enterprise.”

CIS — the Center for Internet Security — also recommends leveraging the following resources to help build a security awareness program:

Security and IT staff — not just those in non-technical roles — should also be receiving cybersecurity training relevant to their roles. In fact, according to the IT and security decision-makers surveyed by Randori and ESG for their 2022 report on The State of Attack Surface Management, providing security and IT staff with more ASM training would be the third most-effective way to improve ASM.

Ensuring partners, vendors and other third-party contractors take security training as well can also help contain your human attack surface.

#8: Improve digital employee experience (DEX)

.

Digital attack surface Physical attack surface Human attack surface 
XX

.

No matter how much cybersecurity training you provide employees, the more complex and convoluted security measures become, the more likely they are to bypass them. Sixty-nine percent of end users report struggling to navigate overly convoluted and complex security measures. Such dissatisfied users are prone to distribute data over unsecured channels, prevent the installation of security updates and deploy shadow IT.

That seems to leave IT leaders with an impossible choice: improve digital employee experience (DEX) at the cost of security or prioritize security over experience? The truth is, security and DEX are equally important to an organization’s success and resilience. In fact, according to research from Enterprise Management Associates (EMA), reducing security friction leads to far fewer breach events.

So what do you do? Ivanti’s 2022 Digital Employee Experience Report indicates IT leaders — with support from the C-suite — need to put their efforts toward providing a secure-by-design digital employee experience. While that once may have seemed like an impossible task, it’s now easier than ever thanks to an emerging market for DEX tools that help you measure and continuously improve employees’ technology experience.

Read the 2022 Digital Employee Experience Report to learn more about the role DEX plays in cybersecurity.

One area in which organizations can easily improve both security and employee experience is authentication. Annoying and inefficient to remember, enter and reset, passwords have long been the bane of end users.

On top of that, they’re extremely unsecure. Roughly half of the 4,291 data breaches not involving internal malicious activity analyzed for the 2023 Verizon DBIR were enabled through credentials — about four times the amount enabled by phishing — making them by far the most popular path into an organization’s IT estate.

Passwordless authentication software solves this problem. If you’d like to improve end user experience and reduce your attack surface in one fell swoop, deploy a passwordless authentication solution that uses FIDO2 authentication protocols. Both you and your users will rejoice when you can say goodbye to passwords written on Post-it Notes forever.

For more guidance on how to balance security with DEX, refer to the following resources:

Additional guidance from free resources

Ivanti’s suggested best practices for reducing your attack surface combine learnings from our firsthand experience plus secondhand knowledge gleaned from authoritative resources.

And while these best practices will indeed greatly diminish the size of your attack surface, there’s no shortage of other steps an organization could take to combat the ever-expanding size and complexity of modern attack surfaces.

Check out the following free resources — some of which were referenced above — for additional guidance on shrinking your attack surface:

Next steps

So, you’ve implemented all the best practices above and you’re wondering what’s next. As with all things cybersecurity, there’s no time for standing still. Attack surfaces require constant monitoring.

You never know when the next unmanaged BYOD device will connect to your network, the next vulnerability in your CRM software will be exploited or the next employee will forget their iPhone at the bar after a team happy hour.

On top of tracking existing attack vectors, you also need to stay informed about emerging ones. For example, the recent explosion of AI models is driving substantial attack surface growth, and it’s safe to say more technologies that open the door to your IT environment are on the horizon. Stay vigilant.

About Robert Waters

Robert Waters is the Lead Product Marketing Manager for endpoint security at Ivanti. His 15 years of marketing experience in the technology industry include an early stint at a Fortune 1000 telecommunications company and a decade at a network monitoring and managed services firm.

Robert joined Ivanti in November of 2022 and now oversees all things risk-based vulnerability management and patch management.

Source :
https://www.ivanti.com/blog/the-8-best-practices-for-reducing-your-organization-s-attack-surface

How Cloud Migration Helps Improve Employee Experience

Last updated: June 26, 2023
DEX ITSM and ITAM

The old saying goes, “practice what you preach.” When Ivanti started its “Customer Zero” initiative, Bob Grazioli, Chief Information Officer, saw it as a perfect opportunity to test the products and services consumed by customers.  

For example, during Ivanti’s move to the cloud, Grazioli and the team experienced the same issues that customers would’ve experienced in their migration process. This first-hand experience allowed them to make improvements along the way. Listen to Grazioli go into detail about other crucial findings in the Customer Zero initiative and how expanding ITSM helps elevate the employee experience. 

Key learnings from Ivanti’s “Customer Zero” program  

https://youtube.com/watch?v=unBhdg2rwkg%3Fenablejsapi%3D1%26origin%3Dhttps%253A%252F%252Fwww.ivanti.com

“That’s great to call out our Customer Zero program because we’re really proud of it, actually. We are the first customer in Ivanti. We take every one of our tools that are obviously applicable to IT or SaaS and we implement them first, before the customer,  to provide the feedback to our product managers, our engineering team and make sure that that feedback either makes it into the product or eliminates any potential problems that our customers might experience if something obviously wasn’t discovered during our testing.   

But having said that, we have learned an awful lot about actually moving from on-prem to SaaS. If you look at what we’ve done with Customer Zero, our focus now has been to take a look at the Ivanti on-prem products and move ourself to the cloud. Obviously, I manage SaaS, so I’m very biased towards being in the cloud and that is our focus right now. So, we’ve taken patch, we’ve moved that from on-prem to cloud.  

We now have taken our ITSM converged product with workflow management, with all of low-code, no code, we moved that into IT for ITSM. We have our own CMDB that we’re running against Discovery. Going out to our data centers, we have close to what, 40 different geos globally that we manage — thousands and thousands of assets across all of those data centers. Those are all being discovered placed in our own CMBD and managed.   

We’re now deploying GRC for our compliance. We were like a lot of, you know, companies struggle through our SOC 2, SOC 2 type 2, where artifacts are put into certain repositories. We managed those assets. Now we have GRC, where all those artifacts get managed to ITSM. They’re linked to the proper controls. It makes the audit process so much simpler, so much easier for us to get through every year for compliance.    

We’re learning that through the efficiency of moving to cloud from on-prem to SaaS, we’re learning those efficiencies do save us time, have a great ROI in terms of the OpeEx – CapEx equation, if most of you CIOs that go through that, there is a big advantage on the Capex-Opex side.”

Using ITSM to support a broader organization  

https://youtube.com/watch?v=unBhdg2rwkg%3Fstart%3D152%26enablejsapi%3D1%26origin%3Dhttps%253A%252F%252Fwww.ivanti.com

“And then, just having all of our data in the cloud in ITSM, as I said earlier, becoming a single source of truth for PatchDiscovery, RiskSense [now known as Risk-Based Vulnerability Mangement] vulnerabilities. And obviously, the main focus, all the tickets that are created on the customer facing side, giving us insight into the customer, into what they’re using or what they’re not using. So really, adoption, big part of obviously what you need in SaaS to manage, the real true user experience.   

It really has been eye opening, moving all of our products from on-prem to SaaS, leveraging those SaaS products in our own cloud, gaining that experience, pushing it back to product managers, pushing it back to engineering to produce a better quality product and a better service for all of our customers as they migrate to the cloud.   

So, we kind of blunt any particular problems that our customers would have experienced when they move from on-prem to cloud. Customer Zero – it’s definitely eliminating a lot of issues that customers would have had if they move on-prem to SaaS. And we’re providing valuable telemetry to help improve our product and improve the quality and service to our customers.” 

Important takeaways from Ivanti’s Customer Zero initiative 

https://youtube.com/watch?v=IzbJvG6Izs0%3Fenablejsapi%3D1%26origin%3Dhttps%253A%252F%252Fwww.ivanti.com

“Well, so we’ve improved our catalog for service requests and so on. That is the evolution of what ITSM should do. But DEX is the key. Having all of those tickets in ITSM that show customer issues or customer successes or what they’re using in our product, etc.

That is the game changer because now, as I said earlier, having DEX out there, looking at all those tickets, analyzing the tickets and then proactively either anticipating a problem with their device or potentially the way a customer is adopting certain technologies that we pushed out into the environment.  

Those tickets are gold for that level of telemetry that allows us to gain the insights we need to provide the customer with a better experience. I think ticket management is really, it’s tough — you don’t want a lot of tickets, obviously, because sometimes that’s not a good thing. But what these tickets represent in terms of knowledge of the customer, it really is instrumental in us making things better, making the service better and having the customer have a better experience.” 

How to use DEX to drive cultural change  

https://youtube.com/watch?v=x71aP3P4OCs%3Fenablejsapi%3D1%26origin%3Dhttps%253A%252F%252Fwww.ivanti.com

“I mean, we use the word culture, but let’s face it, the generation of customers that are out there today growing up with technology and having the ability to control a lot of that technology right at their fingertips, that’s really what you’re trying to accommodate.  

You don’t want someone to come into your company as an employee and have them not have that same experience. Not have them engaged with technology the same way they can engage at home or anywhere else out in the market. That’s what we’re trying to get to and be for that customer.   

And we’re doing that because today, with the proactive nature that we’re creating within our products. Proactive nature, that’s DEX.  

That’s having all that intelligence to engage the customer with empathy and with a proactive approach to giving them a solution to whatever issue they have. It’s empathy to what they’re going through and then proactively providing them with a fast, reliable solution to whatever experience they’re calling in on. 

I think that’s our goal and I think ITSM is evolving to that because again, of the amount of information it’s able to collect and use with all of the AI and ML that we’re applying to it, to really create that more proactive experience with a very intelligent, very tech savvy customer that we have both in and outside our company.   

And that’s happening. That’s the culture, if you will, that I see, that I’m engaged with, and we want to make sure our products can satisfy. ”

Broadening ITSM to support other areas brings with it new levels of proactive troubleshooting and empathy, helping you drive a better digital employee experience.

.

If you’d like to learn more, dive into our ITSM + toolkit and listen to this on-demand webinar on Expanding your ITSM: key learnings for building connected enterprise workflows.  

Source :
https://www.ivanti.com/blog/how-cloud-migration-helps-improve-employee-experience

Configure DoH on your browser

There are several browsers compatible with DNS over HTTPS (DoH). This protocol lets you encrypt your connection to 1.1.1.1 in order to protect your DNS queries from privacy intrusions and tampering.

Some browsers might already have this setting enabled.

​​Mozilla Firefox

  1. Select the menu button > Settings.
  2. In the General menu, scroll down to access Network Settings.
  3. Select Settings.
  4. Select Enable DNS over HTTPS. By default, it resolves to Cloudflare DNS.

​​Google Chrome

  1. Select the three-dot menu in your browser > Settings.
  2. Select Privacy and security > Security.
  3. Scroll down and enable Use secure DNS.
  4. Select the With option, and from the drop-down menu choose Cloudflare (1.1.1.1).

​​Microsoft Edge

  1. Select the three-dot menu in your browser > Settings.
  2. Select Privacy, Search, and Services, and scroll down to Security.
  3. Enable Use secure DNS.
  4. Select Choose a service provider.
  5. Select the Enter custom provider drop-down menu and choose Cloudflare (1.1.1.1).

​​Brave

  1. Select the menu button in your browser > Settings.
  2. Select Security and Privacy > Security.
  3. Enable Use secure DNS.
  4. Select With Custom and choose Cloudflare (1.1.1.1) as a service provider from the drop-down menu.

​​Check if browser is configured correctly

Visit 1.1.1.1 help pageOpen external link and check if Using DNS over HTTPS (DoH) show Yes.

Source :
https://developers.cloudflare.com/1.1.1.1/encryption/dns-over-https/encrypted-dns-browsers/

SeroXen Mechanisms: Exploring Distribution, Risks, and Impact

By: Peter Girnus, Aliakbar Zahravi
June 20, 2023
Read time: 10 min (2790 words)

This is the third installment of a three-part technical analysis of the fully undetectable (FUD) obfuscation engine BatCloak and SeroXen malware. In this entry, we document the techniques used to spread and abuse SeroXen, as well as the security risks, impact, implications of, and insights into highly evasive FUD batch obfuscators.

The remote access trojan (RAT) SeroXen tool can be purchased on the clearnet. During our investigation, we uncovered multiple domains selling not only this nefarious tool but also a cracked version of it hosted on a popular crack forum. We also uncovered individuals on popular video sites such as YouTube and TikTok acting as distributors for this piece of fully undetectable (FUD) malicious software. At the time of writing, many of these videos remain available for viewing.

This is the final installment of a three-part series delving into BatCloak and SeroXen. The first entry, titled “The Dark Evolution: Advanced Malicious Actors Unveil Malware Modification Progression,” looked into the evolution of the BatCloak obfuscation engine, while the second part, titled “SeroXen Incorporates Latest BatCloak Engine Iteration,” discussed the SeroXen malware and its inclusion of the latest iteration of BatCloak to generate an FUD “.bat” loader.

Distribution methods: SeroXen’s online platforms

In this section, we break down the different platforms that SeroXen uses to spread malware.

Website

fig1-seroxen-mechanisms-exploring-distribution-risks-impact-batcloak-fud
Figure 1. SeroXen website

The tool SeroXen sports a sleek website with pages that users might expect from any number of websites selling software on the internet. However, sometime between the last week of May and the first week of June, a new shutdown notice has surfaced on its website due to SeroXen’s popularity and cybercriminal efficacy. Considering the content of the notice, there are strong indications that this shutdown is merely for show and that distribution is still ongoing through other platforms and channels.

fig2-seroxen-mechanisms-exploring-distribution-risks-impact-batcloak-fud
Figure 2. SeroXen’s website shutdown notice

Prior to the shutdown notice, we observed the main SeroXen website offering a comprehensive list of features to prospective consumers. Examining some of the core features advertised by SeroXen shows a rich feature selection, including:

  • A Windows Defender-guaranteed bypass for both scan time and runtime.
  • FUD scan time and runtime evasion against most antivirus engines.
  • Hidden Virtual Network Computing (hVNC).
  • Full modern Windows support.
fig3-seroxen-mechanisms-exploring-distribution-risks-impact-batcloak-fud
Figure 3. SeroXen’s features list

In addition to the sophisticated evasion and FUD component, the inclusion of hVNC is concerning as it is often deployed by highly sophisticated types of malware and advanced persistent threat (APT) groups. The hVNC component allows threat actors to operate a hidden or “virtual” desktop rather than the main desktop to keep the malicious sessions in the background running uninterrupted.

Meanwhile, the SeroXen web application provides users with the option to acquire either a monthly license key or a lifetime key using cryptocurrency.

fig4-seroxen-mechanisms-exploring-distribution-risks-impact-batcloak-fud
Figure 4. SeroXen monthly subscription (top) and lifetime (bottom) price options
fig5-seroxen-mechanisms-exploring-distribution-risks-impact-batcloak-fud
Figure 5. SeroXen is currently unavailable for purchase at the website

The SeroXen web application also boasts a product support team available from Monday to Friday following a location for a time zone reference in the US. The Telegram account of the developer is also available for messaging, and the relevant channels are still active. At one point, a Discord account might also have been available for contact, although it was already unavailable at the time of this writing.

fig6-seroxen-mechanisms-exploring-distribution-risks-impact-batcloak-fud
Figure 6. SeroXen’s product support offers

During our investigation, we encountered the disclosure of the developers and contributors associated with SeroXen’s development. Notably, the list includes the individual who also contributed to the creation of batch obfuscators such as Jlaive, BatCrypt, CryBat, Exe2Bat, and ScrubCrypt. This direct linkage therefore establishes a clear association between these historical FUD batch obfuscators and the SeroXen malware. In June, we also noticed that the website’s acknowledgments included the social media handle of the distributor.

fig7-seroxen-mechanisms-exploring-distribution-risks-impact-batcloak-fud
Figure 7. The developers of Jlaive, BatCloak, CryBat, Exe2Bat, ScrubCrypt, and social media distributor’s username acknowledged on the SeroXen website

Social media accounts

While investigating SeroXen’s website, we uncovered a link to a review video hosted on YouTube. 

fig8-seroxen-mechanisms-exploring-distribution-risks-impact-batcloak-fud
Figure 8. Link to SeroXen review hosted on YouTube

The content is presented as a “review” and facilitated by a reseller. More importantly, it functions not only as an evaluation but also as a promotional advertisement coupled with a tutorial showcasing the capabilities of SeroXen. We found a collection of videos that was also attributed to a reseller of the malware. These videos function to endorse and market SeroXen, reinforcing its presence and appeal within the designated market. Details such as knowledge, discounts offered, and claims of being a distributor indicate the increased likelihood of this user being connected to the owner of the web app.

fig9-seroxen-mechanisms-exploring-distribution-risks-impact-batcloak-fud
Figure 9. SeroXen YouTube advertisements
fig10-seroxen-mechanisms-exploring-distribution-risks-impact-batcloak-fud
Figure 10. SeroXen distributor selling the malware on YouTube

Certain prospective customers of SeroXen have demonstrated an inclination toward exploring specific aspects associated with illicit activities. Their expressed interest encompasses the use of SeroXen in the context of engaging in potentially unlawful endeavors within the Roblox community.

fig11-seroxen-mechanisms-exploring-distribution-risks-impact-batcloak-fud
Figure 11. Prospective customer interested in Roblox cookie theft

For context, Roblox is a widely popular video game with a user base of over 214 million active monthly users across the globe, predominantly comprised of minors, with approximately 67% of the player demographic aged below 16 years. In the US, over half of Roblox players are minors. In Figure 10, the significance of the inquiry lies in the potential risks and impact associated with the theft of the .ROBLOSECURITY cookie from an unsuspecting victim. If successfully stolen, this cookie would grant a threat actor the ability to compromise the targeted Roblox account by overriding two-factor authentication (2FA).

This exchange also highlights the risk associated with highly evasive and modular types of malware — namely, a modular design with the ability to load additional components to create a bigger impact on targeted and unwitting victims. In this instance, the reseller mentions the ability to use SeroXen with Hazard, a stealer with many features, including the capability to steal Discord webhooks.

At one point, the distributor sold SeroXen on Discord, but their accounts have a history of being terminated. In an exchange with a prospective customer on YouTube, a YouTube channel owner shows a clear understanding of how this tool will be used for criminal activity, after which they encourage a prospective customer to get in touch with them since they are a reseller. We also uncovered the reseller’s Twitter profile, which hosted more promotional content for SeroXen.

fig12-seroxen-mechanisms-exploring-distribution-risks-impact-batcloak-fud
Figure 12. A reseller’s conversation with a prospective buyer on YouTube (top) and the reseller’s YouTube and Twitter profiles (middle and bottom)

As of this blog entry’s week of publishing, we noted that the social media distributor confirmed that SeroXen’s “sale” (referred to only as “offsale” on the website) is now offline. Still, this mainstream availability and exchange raise substantial concerns, given its occurrence outside the boundaries of underground hacking forums. While researchers and ordinary users alike might expect this kind of complacence and leeway on the darknet, they do not expect the same on a popular mainstream platform such as YouTube. This underscores the potential implications of the exchange, as it indicates that cybercriminals have become bolder in infiltrating mainstream platforms online. In turn, malicious activities and discussions related to illicit cybersecurity practices are now able to infiltrate mainstream online platforms.

fig13-seroxen-mechanisms-exploring-distribution-risks-impact-batcloak-fud
Figure 13. SeroXen’s social media distributor confirms the RAT as unavailable for interested buyers/users

Additionally, during the investigation of this reseller’s YouTube profile we uncovered a batch-to-dropper file uploaded to Virus Total around the time of the latest SeroXen promotional video. The name of the batch file matches the username of this reseller’s YouTube profile. This batch attempts to download an infected batch file from Discord and run the infected file that leads to a SeroXen infection.

fig14-seroxen-mechanisms-exploring-distribution-risks-impact-batcloak-fud
Figure 14. YouTube reseller includes SeroXen developer’s Telegram handle
fig15-seroxen-mechanisms-exploring-distribution-risks-impact-batcloak-fud
Figure 15. Reseller names file after uploading to a public repository, matching it with their YouTube profile name

SeroXen’s forum presence

We also discovered that the author of SeroXen actively engages with prominent hacking enthusiast forums to promote and distribute the malware. This strategic use of established forums catering to the hacking community serves as an additional avenue for the author to market and sell SeroXen, expanding its reach.

fig16-seroxen-mechanisms-exploring-distribution-risks-impact-batcloak-fud
Figure 16. SeroXen advertisement on a popular hacking forum

Upon investigating the post of SeroXen’s developer, we saw that the author of Jlaive, BatCrypt, CryBat, Exe2Bat, and ScrubCrypt was once again acknowledged as playing a part in the development of SeroXen’s FUD capabilities. Additionally, on another forum, we found a cracked version of SeroXen that allows cybercriminals to bypass the payment requirement set up by the malware’s original developers.

fig17-seroxen-mechanisms-exploring-distribution-risks-impact-batcloak-fud
Figure 17. Acknowledgement of developers and contributors in a forum post
fig18-seroxen-mechanisms-exploring-distribution-risks-impact-batcloak-fud
Figure 18. A cracked version of SeroXen

Examining the prevalence and impact of SeroXen

Throughout our investigation of the scope of infections, we discovered a substantial collection of forum posts containing reports from victims who fell prey to the SeroXen infection. This particular strain of malware showed a notable increase in users reporting their infections, with well-meaning individuals advising victims to implement security and antivirus solutions, which all failed to detect any malicious activity. This then perpetuates a distressing cycle of infections driven by the malware’s FUD capabilities.

Understanding SeroXen infections through an analysis of community discussions

We conducted an analysis on Reddit by analyzing reports of SeroXen infections. Many of these posts reported that the users noticed suspicious actions but were powerless to remediate the ongoing infection.

We went through different forum threads and observed a common theme among the scores of individuals whose systems were infected: they were downloading and executing highly suspect pieces of software hosted on Discord and other file-hosting services related to special interests. We also noticed reports of deceptive batch installers (downloaded from GitHub) claiming to be legitimate software installers or tools for highly sought-after applications and interests like Photoshop, image loggers, TikTok, quality-of-life tools, and Tor, among others. The primary intention behind this fraudulent activity is to lure unsuspecting individuals into unintentionally installing malicious programs that lead to compromise. 

fig19-seroxen-mechanisms-exploring-distribution-risks-impact-batcloak-fud
Figure 19. A user’s system is infected after they download the game Counter Strike: Global Offensive (CSGO).
fig20-seroxen-mechanisms-exploring-distribution-risks-impact-batcloak-fud
Figure 20. Samples of users reporting infections

Based on our analysis of the collected samples, one of the largest target communities are gamers playing popular titles such as Roblox, Valorant, Counter Strike, Call of Duty, and Fortnite. These multiplayer online games contain a rich ecosystem of desirable, high-value, and in-game items that make a rich in-game economy, making them a viable target of malicious actors using SeroXen. In particular, theft appears to be the primary motive driving these infections. Over the years, a thriving underground ecosystem has been established for the illicit resale of stolen in-game items, with a particular emphasis on the popular game Roblox via beaming.

What is Roblox beaming?

Within the Roblox community, the unauthorized sale of items, referred to as “beaming” in the community, has proven itself to be an immensely profitable venture for nefarious actors. It is worth noting that certain rare items within Roblox, known as “limiteds,” can command significant prices that reach thousands of dollars in real-world commercial values. Discord has served as fertile ground  for buying and selling these items, allowing cybercriminals to exploit and profit from unsuspecting children who fall victim to their schemes.

During our investigation, we uncovered a thriving underground community using Discord to post stolen cookies to beam victims. Frequently, the practice of beaming is employed to generate content specifically intended for popular online platforms like YouTube and TikTok. Numerous individuals, often including minors, are subjected to beaming for the purpose of entertainment. Over the course of our investigation, we also uncovered many instances of beaming tutorials and how-to videos on both TikTok and YouTube.

fig21-seroxen-mechanisms-exploring-distribution-risks-impact-batcloak-fud
Figure 21. A .ROBLOSECURITY cookie posted on Discord for beaming
fig22-seroxen-mechanisms-exploring-distribution-risks-impact-batcloak-fud
Figure 22. Roblox beaming videos on YouTube (top and middle) and TikTok (bottom)
fig23-seroxen-mechanisms-exploring-distribution-risks-impact-batcloak-fud
Figure 23. Roblox beaming tutorials on TikTok

Furthermore, our findings have revealed that these video platforms frequently function as recruitment platforms, funneling individuals into beaming Discord channels to engage in unethical and detrimental activities.

fig24-seroxen-mechanisms-exploring-distribution-risks-impact-batcloak-fud
Figure 24. A Roblox beamer recruitment video on TikTok

FUD batch obfuscation techniques coupled with hVNC-capable toolkits provide actors powerful tools not only for stealing content but also for creating significant psychological distress in communities with a significant number of minors.

Examining SeroXen infections with insights from the Microsoft Support community

During our investigation of the prevalence and impact of SeroXen infections, we also examined posts within the Microsoft Support community. We observed striking similarities between the infection chain reported in this community and the discussions in Reddit. Moreover, a deeper understanding of the actions perpetrated revealed two distinct and concerning patterns. The first pattern involved direct extortion tactics, while the second involved the issuance of threats to victims’ lives through swatting.

fig25-seroxen-mechanisms-exploring-distribution-risks-impact-batcloak-fud
Figure 25. Samples of reports seeking help against an extortion attempt (top) and a threat of swatting (bottom) after hackers gain control of users’ infected systems through SeroXen

Conclusion

Considering the capabilities and potential damage resulting from this tool, the costs for entry are low to null (given the cracked versions available online). This means that both cybercriminals and script kiddies experimenting with malware deployments can avail of SeroXen. Depending on the goals of cybercriminals — whether they care for arrests and notoriety or simply want to spread the tool — the sophistication of the infection routines does not appear to match with the chosen methods for distribution. The almost-amateur approach of using social media for aggressive promotion, considering how it can be easily traced, makes these developers seem like novices by advanced threat actors’ standards. That being said, the real-life consequences of abusing highly evasive malware as a tool to threaten other users via swatting and other threats to personal safety remain highly concerning especially as these developers might interact with online communities populated by minors.

The addition of SeroXen and BatCloak to the malware arsenal of malicious actors highlights the evolution of FUD obfuscators with a low barrier to entry. This can be considered an upcoming trend for a range of cybercriminals who can use a wide range of distribution mechanisms like Discord and social media platforms and their features (such as YouTube and short-from videos in TikTok) to push their preferred types of destructive software for abuse. Additionally, this trend also highlights the potential of highly evasive malware to proliferate in communities that host a significant number of minors who might be ill-equipped to confront destructive pieces of malware. Considering the low-to-nil detections in public repositories once a piece of malware is armed with these tools, this evolution presents new challenges to security teams and organizations alike, especially since FUD obfuscation can be used to deliver any kind of imaginable threat, including those that are not yet known.

Parents and guardians are encouraged to proactively familiarize themselves with the contemporary digital dynamics their children use regularly. This includes gaining an understanding of the various online communities that their children participate in, as well as communicating essential safe online practices and skills to their children. Adults are also encouraged to familiarize themselves with the colloquialisms minors use online and the platforms they frequent. By becoming familiar with these areas and simultaneously equipping children with such knowledge, guardians can play a pivotal role in ensuring everyone’s online safety and well-being.

Trend Vision One™️ enables security teams to continuously identify the attack surface, including known, unknown, managed, and unmanaged cyber assets. It automatically prioritizes risks, including vulnerabilities, for remediation, taking into account critical factors such as the likelihood and impact of potential attacks. Vision One offers comprehensive prevention, detection, and response capabilities backed by AI, advanced threat research, and intelligence. This leads to faster mean time to detect, respond, and remediate, improving the overall security posture and effectiveness.

When uncertain of intrusions, behaviors, and routines, assume compromise or breach immediately to isolate affected artifacts or tool chains. With a broader perspective and rapid response, an organization can address these and keep the rest of its systems protected. Organizations should consider a cutting-edge multilayered defensive strategy and comprehensive security solutions such as Trend Micro™ XDR that can detect, scan, and block malicious content across the modern threat landscape.

Our commitment to online safety

Trend Micro is committed to digital safety through our Trend Micro Initiative for Education , our outreach program that aims to improve internet safety awareness, digital literacy, and malware defense capabilities for a safer digital world. Our initiatives and participation for security and safety include but are not limited to:

If you receive a swatting threat or information that an individual is planning to engage in swatting activities, please report it to local law enforcement and/or the Federal Bureau of Investigation (FBI) at 1-800-CALL-FBI immediately.

Source :
https://www.trendmicro.com/it_it/research/23/f/seroxen-mechanisms-exploring-distribution-risks-and-impact.html

SeroXen Incorporates Latest BatCloak Engine Iteration

By: Peter Girnus, Aliakbar Zahravi
June 15, 2023
Read time: 7 min (2020 words)

We looked into the documented behavior of SeroXen malware and noted the inclusion of the latest iteration of the batch obfuscation engine BatCloak to generate a fully undetectable (FUD) .bat loader. This is the second part of a three-part series documenting the abuse of BatCloak’s evasion capabilities and interoperability with other malware.

The recent rise of highly sophisticated malware’s ability to evade detection through fully undetectable (FUD) capabilities, low-cost financial accessibility, and minimal skill barriers have created a pervasive threat targeting online communities and organizations. One particular malware known as SeroXen has deployed an advanced, fully undetectable (FUD) technique via highly obfuscated batch files to infect victims with hVNC-(Hidden Virtual Network Computing) capable malware.

This entry is the second installment of a three-part series featuring BatCloak engine, its iterations, and inclusion in SeroXen malware as the main loading mechanism. The first entry, titled “The Dark Evolution: Advanced Malicious Actors Unveil Malware Modification Progression,” looked into the beginnings and evolution of the BatCloak obfuscation engine. The third part of this series, “SeroXen Mechanisms: Exploring Distribution, Risks, and Impact,” analyzes the distribution mechanism of SeroXen and BatCloak, including the security impact and insights of FUD batch obfuscation. As of this writing, a quick online search for SeroXen will show top results for an official website and social media and sharing pages with videos on how to use the remote access trojan (RAT) as if it were a legitimate tool. We will go over these dissemination strategies in the subsequent entry.

SeroXen’s FUD batch patterns

To attain FUD status, the obfuscation patterns employed in SeroXen have shown multilayered tiers in its evolution, evolving from notable predecessors such as Jlaive, BatCloak, CryBat, Exe2Bat, and ScrubCrypt. Notably, the author of these FUD tools is acknowledged as a contributor in various instances, including attributions present on the main SeroXen website and forum posts authored by the individual behind SeroXen.

Examining the SeroXen infection chain

fig1-seroxen-incorporates-latest-batcloak-engine-iteration
Figure 1. SeroXen infection chain

To successfully initiate the infection process, the targeted user is lured into executing a batch file. These lures are often presented as software-specific to enthusiast groups such as gaming communities. The infection process’ efficiency is enhanced because of the batch file’s FUD capability.

We found a compilation of compromised archives associated with cheats pertaining to prominent game titles. Each of these archives harbors a highly obfuscated batch file that serves as the infection vector initiating a SeroXen infection. Alarmingly, none of the archives exhibited any form of security solution detection. In most instances, these malicious archives are hosted on the Discord CDN (content delivery network) catering to specific interested communities, but they could also be hosted on any number of cloud storage options as well as special interest forums.

Taking a visual representation of a SeroXen sample submitted to a public repository under the false pretense of being a popular online video game cheat, the sample showcases the comprehensive concealment capabilities inherent. Through investigative analysis, we found a consistent pattern in the dimensions of SeroXen’s obfuscated batch files, which commonly exhibit sizes ranging from approximately 10MB to 15MB.

fig2-seroxen-incorporates-latest-batcloak-engine-iteration
Figure 2. Gaming lures with no detections

Analyzing the obfuscation patterns deployed by SeroXen

To develop a comprehensive understanding of the obfuscation algorithm utilized within SeroXen, we conducted an in-depth examination on a multitude of heavily obfuscated batch files. The figure sample exhibits an obfuscated SeroXen batch payload camouflaged under the guise of a Fortnite hack.

fig3-seroxen-incorporates-latest-batcloak-engine-iteration
Figure 3. SeroXen obfuscated batch payload

The batch obfuscation patterns implemented by the SeroXen FUD algorithm can be summarized as follows:

  1. Suppression of console output through the inclusion of the directive “@echo off”
  2. Utilization of sophisticated string manipulation techniques to obfuscate the initial “set” command
  3. Assignment of the “set” command to a user-defined variable
  4. Assignment of equal operations (“=”) to a user-defined variable
  5. Utilization of steps 3 and 4 to assign values to the additional user-defined variables
  6. Concatenation of variables at the conclusion of the obfuscation process to construct a command, which is subsequently executed

Furthermore, our investigation showed that the implementation of layered obfuscation techniques alongside the incorporation of superfluous code fragments or “junk code” were employed to impede the analysis of the batch file hindering detections.

Summary of commands executed during the SeroXen infection process

We break down the core commands concatenated and executed in order to infect the victim as follows:

  1. Ensure all batch commands run are suppressed with “@echo off”
  2. Copy the PowerShell executable from System32 to the current directory
  3. Set the current directory
  4. Name this copied PowerShell after the batch filename with an appended .exe, such as <mal_bat>.exe
  5. Use the PowerShell command to decrypt and execute the encrypted payload
  6. Build the final PowerShell command used to decrypt the final payload
  7. Use the static operator to decrypt the final payload

Analyzing the deobfuscated SeroXen batch files

During our technical analysis of FUD-enabled SeroXen batch payloads, we were able to deobfuscate the commands associated with its execution and patch key points in its operation to dump the deobfuscated version.

fig4-seroxen-incorporates-latest-batcloak-engine-iteration
Figure 4. Deobfuscated SeroXen batch payload

If we compare the deobfuscated sample presented with the highly obfuscated sample (Figure 3), we can demonstrate the core function of the batch script: to generate a series of set commands in an obfuscated manner to evade detection. We see the result of the numerous obfuscated set commands in its deobfuscated equivalent. Throughout the obfuscated batch file, numerous variables are concatenated together to be executed.

fig5-seroxen-incorporates-latest-batcloak-engine-iteration
Figure 5. Deobfuscated SeroXen PowerShell commands

Analyzing the final PowerShell decryption command

The PowerShell command to be executed in the FUD obfuscated batch file is a series of hidden PowerShell commands used to decrypt and deliver the .Net loader.

fig6-seroxen-incorporates-latest-batcloak-engine-iteration
Figure 6 . Final PowerShell command executed in the SeroXen batch file

The deobfuscated sequence of PowerShell commands decrypt the payload and employ an assembly reflection mechanism to reflectively load it. The essential characteristics of the final sequence of PowerShell commands include:

  1. Decode payload using Base64
  2. Decrypt payload using AES OR XOR algorithm. In the case of AES:
    • Instantiate an AES decryption object with the cipher block chaining (CBC) mode
    • Use a Base64 blob for the key and IV
  3. Unzip the payload
  4. Reflectively load the payload

From the next figure, we demonstrate how the C# loader is decrypted from the deobfuscated batch files, after which we unzip the decrypted archive to drop the .Net binary.

We decoded the payload using Base64, which is then AES-decrypted using the deobfuscated Key and IV and finally gunzipped to reveal the .Net loader. This payload is then loaded into memory using reflection.

fig7-seroxen-incorporates-latest-batcloak-engine-iteration
Figure 7. Using Python to decrypt the .Net loader

Deep dive into SeroXen builder

fig8-seroxen-incorporates-latest-batcloak-engine-iteration
Figure 8. Obfuscated builder

The SeroXen builder binary file is protected by the Agile .NET. After unpacking the functions and builder resources, this section shows that SeroXen is a modified version of Quasar RAT with a rootkit and other modifications, such as adopting the loader builder Jlaive and BatCloak obfuscation engine to generate a FUD .bat loader. The evolution and technical analysis of Jlaive and BatCloak was discussed in part 1 of this series.

fig9-seroxen-incorporates-latest-batcloak-engine-iteration
Figure 9 . Unpacked builder resources (left) and builder function names (right) a modified version of Quasar RAT in its arsenal
fig10-seroxen-incorporates-latest-batcloak-engine-iteration
Figure 10. SeroXen builder adopting Jlaive and BatCloak source codes

As of this writing, SeroXen offers monthly and lifetime key options for purchase online, as well as instructions for using the RAT. We go over this in detail in the third installment of this series as part of the cybercriminals’ distribution strategies.

fig11-seroxen-incorporates-latest-batcloak-engine-iteration
Figure 11. SeroXen builder usage instruction

SeroXen payload generation process

Upon pressing the “build” button, the builder writes the user-given configuration to the pre-compiled file called “client.bin,” and this produces the Quasar RAT payload and passes it to a function called “Crypt.”  

fig12-seroxen-incorporates-latest-batcloak-engine-iteration
Figure 12. SeroXen vs Quasar RAT payload generation

The Crypt function employs the Jlaive crypter multi-stage loader generator and BatCloack obfuscator source code to produce undetectable loaders. This function first reads the Quasar RAT payload content and verifies if it is a valid .NET assembly. Crypt then patches some string and opcode within the binary and encrypts it using the AES algorithm with CBC cipher mode, and saves it as “payload.exe.” 

fig13-seroxen-incorporates-latest-batcloak-engine-iteration
Figure 13. Payload encryption and obfuscation process

Much like a Jlaive crypter, the builder takes in user configuration and produces the first loader. This is achieved using a C# template file, “Quasar.Server.Stub.cs,” found embedded within its resources. The author has integrated an extra functionality in this adapted version of the Jlaive CreateCS function such as API unhooking.

fig14-seroxen-incorporates-latest-batcloak-engine-iteration
Figure 14. Create C# loader

Apiunhooker.dll is an open-source project called “SharpUnhooker,” which is a C#-based universal API unhooker that automatically Unhooks API Hives (i.e., ntdll.dllkernel32.dlladvapi32.dll, and kernelbase.dll). This technique is used to attempt evading user-land monitoring done by antivirus technologies and/or endpoint detection and response (EDR) solutions by cleansing or refreshing API DLLs that loaded during the process.

The builder subsequently compiles the C# loader stub, adding necessary files and dependencies such as encrypted Quasart RAT (payload.exe) and SharpUnhooker (Apiunhooker.dll) to its resources. 

fig15-seroxen-incorporates-latest-batcloak-engine-iteration
Figure 15. C# loader compilation

Next, the builder compresses the C# loader, encrypts it using AES/XOR (depending on the configuration), and encodes it in Base64. Finally, it creates a batch file and includes the encoded C# loader binary into it. It also manages the compression, decoding, and decryption processes using an obfuscated PowerShell script, which is also appended to the batch file.

The batch file’s role is to deobfuscate the PowerShell script and execute it. This PowerShell script scans the content of the batch file for the value following “::“, extracts this value, decodes it, decompresses it, decrypts it, and finally executes it in memory.

fig16-seroxen-incorporates-latest-batcloak-engine-iteration
Figure 16. Creating and writing encrypted data to a batch file, and deleting temporary files
fig17-seroxen-incorporates-latest-batcloak-engine-iteration
Figure 17. Generating an obfuscated batch loader (top) and PowerShell loader (bottom)

Two PowerShell templates, “Qusar.Server.AESStub.ps1” and “Quasar.Server.XORStub.ps1,” exist in the resource section of the builder. Depending on the configuration, one of these will be loaded and utilized.

fig18-seroxen-incorporates-latest-batcloak-engine-iteration
Figure 18. PowerShell stub

Conclusion

In this entry, we include a Yara rule that organizations and security teams can use to detect SeroXen obfuscated batch files. Additionally, here’s a PowerShell script that can reveal the final deobfuscated batch file and commands to be run. It is critically important that this PowerShell script be run in an isolated malware sandbox. This script can be used to deobfuscate the SeroXen batch file where security teams can inspect its output file for the PowerShell command to be executed in the deobfuscation routine. By inspecting this deobfuscated payload, the analyst can grab the Key and IV from the PowerShell command to decrypt the final payload.

Overall, SeroXen is a full-feature remote administration tool (RAT) coded in C# and built using a combination of various open-source projects that work together to generate a FUD payload. Reports have emerged of SeroXen being abused for several infections and attacks. We foresee the evolved BatCloak engine at the core of SeroXen’s FUD capabilities as the BatCloak obfuscation engine continues to evolve and be used as a FUD tool for future malware attacks.

Individuals are strongly advised to adopt a skeptical stance when encountering links and software packages associated with terms such as “cheats,” “hacks,” “cracks,” and other pieces of software related to gaining a competitive edge. Users, developers, gamers, and enthusiasts are also advised to exercise caution when executing batch files obtained from the internet. Additionally, organizations are encouraged to stay vigilant against phishing attacks that might attempt to entice users to download and run batch installers (e.g., scripting and automation of repetitive tasks).

Organizations should consider employing a cutting edge multilayered defensive strategy and comprehensive security solutions, such as Trend Micro™ XDR, that can detect, scan, and block malicious content such as SeroXen and BatCloak across the modern threat landscape. An extended detection and response capability across endpoint, servers, workloads, email, network, cloud, and identity observed from a single platform like Trend Vision One™️ can mitigate these risks by considering adversarial tactics, techniques, and procedures (TTPs) to profile the entirety of a routine. Learn more about how the Zero Day Initiative (ZDI) bug bounty program rewards researchers for responsible vulnerability disclosure as well as protects organizations globally and stay up to date on the latest news regarding mission critical security patches.

Source :
https://www.trendmicro.com/en_us/research/23/f/seroxen-incorporates-latest-batcloak-engine-iteration.html

Analyzing the FUD Malware Obfuscation Engine BatCloak

By: Peter Girnus, Aliakbar Zahravi
June 09, 2023
Read time: 3 min (681 words)

We look into BatCloak engine, its modular integration into modern malware, proliferation mechanisms, and interoperability implications as malicious actors take advantage of its fully undetectable (FUD) capabilities.

UPDATE as of 6/15/2023 7:30PM (PHT): We’ve updated this entry to include indicators of compromise (IOCs) for BatCloak.

In our recent investigation, we discovered the use of heavily obfuscated batch files utilizing the advanced BatCloak engine to deploy various malware families at different instances. Running analysis and sample collection from September 2022 to June 2023, we found that these batch files are designed to be fully undetectable (FUD) and have demonstrated a remarkable ability to persistently evade security solutions. As a result, threat actors can load various malware families and exploits by leveraging highly obfuscated batch files seamlessly. Our initial research titled “The Dark Evolution: Advanced Malicious Actors Unveil Malware Modification Progression” delves into the continuing evolution of BatCloak, uncovering the modifications that have propelled modern malware to new levels of security evasion.

This is the first entry in a three-part technical research series taking an in-depth look at the continuing evolution of the highly evasive batch obfuscation engine BatCloak. The second part of this series, “SeroXen Incorporates Latest BatCloak Engine Iteration,” will look into the remote access trojan (RAT) SeroXen, a piece of malware gaining popularity for its stealth and, in its latest iterations, targets gamers, enthusiast communities, and organizations. Aside from the RAT’s own tools, we will look into the updated BatCloak engine included as SeroXen’s loading mechanism. The third and last part of this series, “SeroXen Mechanisms: Exploring Distribution, Risks, and Impact,” will detail the distribution mechanisms of SeroXen and BatCloak. We also include our security insights on the community and demographic impact of this level of sophistication when it comes to batch FUD obfuscation.

Defying detection: A preview of BatCloak engine’s efficacy

We analyzed hundreds of batch samples sourced from a public repository. The results showed a staggering 80% of the retrieved samples exhibiting zero detections from security solutions. This finding underscores the ability of BatCloak to evade traditional detection mechanisms employed by security providers. Moreover, when considering the overall sample set of 784, the average detection rate was less than one, emphasizing the challenging nature of identifying and mitigating threats associated with BatCloak-protected pieces of malware.

fig1-analyzing-the-fud-malware-obfuscation-engine-batcloak
Figure 1. BatCloak detection counts from a public repository; samples and detection results collected from September 2022 to June 2023

Understanding the evolving landscape of advanced malware techniques such as FUD obfuscator BatCloak enables us to develop more effective strategies for combating the ever-evolving threats posed by these sophisticated adversaries. These findings highlight the pressing need for enhanced approaches to malware detection and prevention, such as a cutting-edge multilayered defensive strategy and comprehensive security solutions.

Security teams and organizations are advised to exercise a zero-trust approach. Teams should implement solutions capable of combining multiple rules, filters, and analysis techniques, including data stacking and machine learning to address the need for precise detection, as these tools can analyze individual and dynamic file signatures and observe patterns via heuristics and behavioral analysis. When uncertain of intrusions, behaviors, and routines, assume compromise or breach immediately to isolate affected artifacts or tool chains. With a broader perspective and rapid response, an organization can address these and keep the rest of its systems protected. Multilayered technologies and solutions, such as Trend Micro XDR™️, efficiently monitor, detect, and block tiered threats and attacks, as well as their clones and modified versions.

Instead of marking the end of an infection or an attack prior to the target because of siloed solutions, an extended detection and response capability across endpoint, servers, workloads, email, network, cloud, and identity observed from a single platform like Trend Vision One™️ can mitigate these risks by considering adversarial tactics, techniques, and procedures (TTPs) to profile the entirety of a routine. Trend Vision One also correlates with a connected threat intelligence system and rapidly prioritizes and responds with the necessary security and defensive actions as far left of the routine as possible.

Download the first part of our analysis on BatCloak engine here, and the indicators of compromise (IOCs) here and below :

The Dark Evolution: Advanced Malicious Actors Unveil Malware Modification Progression

BatCloak Indicators of Compromise (IOCs)

SHA256 of Trojan.BAT.BATCLOAK.A:

4981e6c42e66972a94077e3407823e212b7499f4be14c18e32e446b6bd5566d6
02169ca4a1fcaec423fdf033794f88266f1dec691ee527f91d9ef444b9e8fd00
024121ce693560695ffbb31714145647039dd0a33c7a637614ee3d408dd88c9b
02cd4e343fdfe9246977bd997ae7faa91b469df0bc9ed4c20cc2fa7898cb54e3
036132bcdc00e75dd71b6cba78c976ec50a52fd1b891a4f873bde87269007e0d
05e50707fc035d4045f52538cbd40df61bfc342ce90578780f169b0148e9e48a
06ee424a019da7a98de8ce82fde4b37037fd59f5f72ed882f63e7d054515785c
0a485b2a30d7818cadedc4b5c8d6a04cee2b4e98d58e292c4f6febc25553a43f
0ce9c7a4bc46fe2f92adf194767f02b460283ebd2100a4c4b6d9c8c03f05cc51
0e44555e8804fc351ca7b5369fef719691ebe3ac2e2dee92abe1359b06327ec3
0ea6d6a7f9532f5d6f2f1438349587aae83b7d82f7e92b3daa2b51658183308a
0f379d61a334d1cce8b67940696c527bb76392bdfae9f41bd4ea159aa0e8794e
1264fbc6fb67678c410dcea283342189c3f5a62b2cebfbbef3e5e88cae40c299
1cbab58e69089b40b0eca4aafa33bfb734707885c9d482f58da7fd2f22fa3f07
1ff46fa8630fe6104b6b31e88b4227474faa5b4891952381d745f0b6c1194d9a
2705be6a7e9fe94d0c90127bdd5cd3677af9a713b99ffaa302cd03d835b5b193
2fca9a8b9c2843001dd1f7d668f94f4aef6cf9fbfe0968dabd38c59f7ad7bf1b
378eea991cec20b879983f25c03c72d9c6492759ff0306267bb0af1934cecb5b
3ac9136078f802199506b4ce532fd221201b15d7d4eb84ce8a5128409d821c46
50e7ddd4d1fd4d6f57e5a39f9e31f20ea967a032ab60458af63bb43c0996b67b
545fa399c3d25ddeb9b1ce7dff99faf86b761937681a02377f6b22bab6953f74
57b573189433839f49b3694fb9dde7d6361a70d0d6d01b8bb5c052ac35e64966
5b1d862533bf0c6eddf0add97fe1d91f24489c9d43dba021a6cd433465abe670
5dc6ddbadfe77dae58755ab3524b8366ac52d6e4b0636cd5e88a9ee83fec93dd
66fbf321cb983176ab327c9357ab6970235263ed1f363960aa512adb255ce327
6fb3642107a5e541be64be269c91de20f10b5aba238a3552c0815ca290f0035e
720ec08526839f9f558439edeb86b0e30ed782edf0cfcc9709157e9963801a5c
735e591c7e0667087aff75f9923a7653b4f9661838e947d842171c20773a8913
73630f5690a1882296878e02fb9ef6ca8ab5f85bc60305682a872096ab59685e
7d1b4c45622ec5efebe8d6ef266a8ff8499285162305f2eb8eb3d09362b032dd
7dfe5e29b6278ddefa27217c26e09cd70c9ce2c920e30dd8e11d29b161a59fad
83046ab10ae92c337f7837191014d6f4aa792575947ad2ebbbdde247edabffad
846d4cf9af2e431ca61a7378fca693acc8cdf31348ce3bb09917de12e8a3de95
895d8257fc523a824e2eaf5a62a94e3cf2a3b87b797f696aa028f8443dd7a5e1
8ae18fc31866c3a35ede249b97457598e78cb6a0988df1dd58b9ddb1f3e88c05
8cf47ef94a01172ac5ed78fa657a2406e199691df02d58630d9b845dfd05007c
8df68758b29abe5c0807cc74221617052a175619121c1b41c1462e2e2c12d080
943c7e473924ff1efd4925eb8f2bf745008365f0256567009e5eb6d6b2f17e65
978361f5cea5e7b2ff801b74ed02a7e0a57ed80ac37c01a403b0614e789765c4
9949481d6311a298b4de1ac0d24d85583c8386bd03dc69cbb5995de475859ebc
994a9f76be5355444056833e0fdf5f9408ce6a028578571caa7eaaeb7176d50d
9c51fec7f9c7217fbaffef2e9476b1c74c6f9abdcfd68f58009307d3a1ced344
a07e12074c4013ff9a16b41822b9c2025fd42c2a6bb749f2489d533c73257bea
ab0e910f7470bbe3f612646e420836937bb26dbf87b2df48d47480d2835f384a
abd92088dc5a7a67ed7f0f27fac6b90cd3042f9c1966b3ec35798e3cf9d0b4ec
b0da1288c592b5710ec6e33f0af7dd69f3264e98c7fcdc0089e9a26e1ebf607a
b12ce995e5f3bd33f290be5ccd80ba847fcbde0d41ea53b8cb9f7f7cb25ab98d
b9077ca1640423f6b085d5b72e6bd0aac7877b6f40886db9f5e150cc5ca4bf9f
bb505db4936541c964c4f8c59e520b89ce83db76564f57548eebe8630758888a
c1e77860cd66a98f34ba4cf5bf55370d35bfba1950b6f79a84ab2f90c48fed86
c4ec0641549cdb66a8f9040a53d9ead724a0e2902866b43221e02c2c4fdcb900
c737111db0397904414e315dbe4604f1705b3cd7ee5579d6c0751752de25877d
c9259d18c1ba7e446406e206e0769ed74acc55c0cf40608c3e3d3ef6cc0e56c7
cda4e8d85f718233b93c4cfad2c28d333ffec523ebd32b1af47b6fa7c26345e6
cf8d86c39f7e76c889b6409ed9477c7b91f9424f491fb835f3643d8d55d5fd9e
d3fe2ae10b1c2dd2cf7339ba91bb4fac4454149361a3a9e8069901e3ea56ea8b
d45b5fde0b10a7d8a3227fac8b7af6f01adc8e78d6adc350588b7cebdd1c5894
d84390808d5a83d58d6f5544f9a717e736be234d18b4b607d8b8e842fb935d24
d8cde0701032e03ff9739889872547325881383791961a67ddebf07f8b80ab6a
d9afd0b9174140c001d6b0c60d02f5ba0469a14733a159c0e44045641b814aa1
daa08a205eec4e318c3f3eb6a001ec5ae16d3870ca1f05b3e8bb6838082910d9
de1356d868e63b027791957accaa3087f18901ae87eb01f6f09b7b88e6958e79
df5497ffb3b407397424ce7992ed62d8907d570668c79f9daef40863702349c0
e101b85439062a92773b046bee20d076513b81ddaa946c28096454c9fb934e19
f52ee895d9e8fd600ce4ea05d4a95443c8916af33a1b7b8b668007813fb61f8b
f62a915f1add8b29ebea13db7bc9c9314557f579631d0bebc3dc7044eaf7bbd7
f6a31c5a33d8b8dd38f39e31f27a32616cef12340c5a1b5914f8105abd22a710
fddce59e2c24f44c73c9913ca2415ec95f5a92cb2d94426aa4f8821952f2ddc2
fff222ff3c259db64dbd18e9382cc47ce8577a4069ba05b6db11b6b52d654294

Source :
https://www.trendmicro.com/en_us/research/23/f/analyzing-the-fud-malware-obfuscation-engine-batcloak.html

Human vs Machine Identity Risk Management

By: Trend Micro
June 29, 2023
Read time: 5 min (1290 words)

Risk Management of Human and Machine Identity in a Zero Trust Security Context

In today’s business world’s dynamic and ever-changing digital landscape, organizations encounter escalating security challenges that demand a more business-friendly and pertinent approach. Conventional security measures frequently lead to adverse effects on business operations.

However, the advent of Zero Trust security offers organizations the opportunity to embrace a risk-based response strategy that effectively mitigates these risks. The concept of identity is central to the effectiveness of security functions, which serves as a critical factor in guaranteeing the precision and security of transactions and data storage.

Identity and the Evolving Role of Humans and Machines

All security functions are fundamentally centered around identity. The statement, “Who did what to what, when,” encapsulates the core significance of identity in security. The accuracy and integrity of this statement rely on the accuracy and integrity of each identity clause. By ensuring the integrity of these identity clauses, organizations can automate the risk management process with high confidence in the outcomes.

Traditionally, security systems were designed assuming that human operators were solely responsible for all decisions made by machines. However, with the advent of computers and the increasing reliance on automated processes, this operator-centric model has become increasingly inadequate.

While humans and their associated accounts are often the primary targets of security measures, they merely represent the activity of the machines they interact with. In a Zero Trust deployment, embracing the concept of “machine as proxy human” becomes crucial. This approach allows organizations to apply security rules and surveillance to all devices, treating them like a malicious human is operating behind them.

By considering machines as proxy humans within the context of Zero Trust, organizations can extend security measures to encompass all devices and systems within their environment. This includes user devices, servers, IoT devices, and other interconnected components. Organizations can enforce strict access controls by treating machines as potential threat actors, applying behavioral analytics, and continuously monitoring for suspicious activities or deviations from expected behavior.

This shift in mindset enables organizations to proactively detect and respond to potential security threats, regardless of whether they originate from human actors or compromised machines. It allows for a more comprehensive and robust security posture, as security measures are applied at the device level, reducing the risk of unauthorized access, data breaches, and other security incidents.

Recognizing the centrality of identity in security and embracing the concept of “machine as proxy human” in a Zero Trust deployment enhances the effectiveness and comprehensiveness of security measures. By treating all devices as potential threat actors and applying security rules and surveillance accordingly, organizations can strengthen their risk management process, automate security controls, and mitigate the risks associated with human and machine-based security threats.

Applying Zero Trust to Machine-Human Approach

Treating all accounts, human or not, as machine/service accounts offer architectural flexibility in a Zero Trust environment. This approach allows organizations to apply consistent security measures to unknown devices, users, networks, and known entities, regardless of how frequently they change.

However, harmonized identity telemetry is crucial for this machine-human approach to be effective. Subscriber Identity Modules (SIM cards) and additional credentials facilitate Zero Trust management in 4G and 5G environments.

Organizations can incorporate a Software Bill of Materials (SBOM) into their Zero Trust solution to address the risks associated with the software. A SBOM is a comprehensive inventory that identifies the software components within an organization’s infrastructure, including internally developed and third-party/vendor-provided software.

By implementing a SBOM in a Zero Trust environment, organizations can establish a baseline for expected software behavior. This baseline includes the software’s version, dependencies, and associated digital signatures. Any deviations from this baseline can be identified as potential security threats or indicators of compromise.

One of the significant advantages of incorporating SBOM into a Zero Trust solution is the ability to monitor unexpected behaviors. Organizations can detect any suspicious activities or unauthorized modifications by continuously monitoring the software components and comparing their actual behavior against the established baseline. This proactive monitoring helps incident responders and risk management teams identify potential threats early and respond effectively to mitigate the risks.

Furthermore, SBOM facilitates supply chain component mapping, crucial for incident response and risk management. With a detailed inventory of software components, organizations can trace the origin of each component and identify potential vulnerabilities or compromised elements within their supply chain. This mapping capability enhances incident response capabilities by providing visibility into the interconnectedness of various software components and their potential impact on the organization’s overall security.

Ultimately incorporating SBOM into a Zero Trust solution helps organizations address software-related risks more effectively. By establishing baselines for expected software behavior and monitoring for any deviations, organizations can detect and respond to potential threats promptly. SBOM also facilitates supply chain component mapping, enabling organizations to enhance their incident response capabilities and mitigate the risks associated with software vulnerabilities and compromises.

Recommendations

Zero Trust security offers a surveillance-based approach that continuously checks and cross-references identity, assesses behavioral risk, and compares it to potential losses and revenue. This approach brings several recommendations for organizations looking to enhance their security posture:

  • Changes to executive responsibility and board governance require the adoption of Zero Trust security
    With the increasing importance of cybersecurity in today’s digital landscape, executive leadership, and board members need to prioritize and understand the significance of Zero Trust security. This includes making it a strategic focus and allocating resources for its implementation. By recognizing the value of Zero Trust and incorporating it into governance structures, organizations can ensure a top-down commitment to robust security practices.
  • Zero Trust can help organizations meet government and customer requirements for supply chain resiliency
    Supply chains have become more vulnerable to cyber threats, and government regulations and customer expectations emphasize supply chain resiliency. Zero Trust security measures can provide transparency, control, and trust within the supply chain ecosystem. Organizations can demonstrate their commitment to supply chain security and meet compliance requirements by establishing rigorous authentication, continuous monitoring, and granular access controls.
  • Operational risk management automation tools in Zero Trust can streamline security management and reduce enterprise risk and total cost of ownership
    Zero Trust security frameworks offer automation tools that streamline security management processes. Organizations can reduce human error and enhance operational efficiency by automating tasks such as identity verification, access controls, and threat detection. This automation minimizes security risks and reduces the total cost of ownership associated with managing complex security infrastructures.
  • Simplification of security management in Zero Trust can address the security skills gap by enabling reliance on junior or offshore staff for incident diagnoses
    The shortage of skilled cybersecurity professionals is a significant challenge for many organizations. Zero Trust can alleviate this skills gap by simplifying security management and enabling the reliance on junior or offshore staff for incident diagnoses. With streamlined processes, intuitive security controls, and automated monitoring, organizations can empower less experienced staff to effectively handle security incidents, optimizing resources and addressing the skills shortage.

By prioritizing identity integrity and leveraging the benefits of Zero Trust, organizations can establish a robust security framework that maximizes enterprise functionality while minimizing risk. In an increasingly unstable world where cyber threats continue to evolve, adopting a sophisticated, nuanced, and cost-effective security approach such as Zero Trust becomes essential for organizations to thrive and maintain resilience in the face of emerging challenges.

Ready to take your organization’s security to the next level? Download our comprehensive report on “Zero Trust: Enforcing Business Risk Reduction Through Security Risk Reduction” to gain valuable insights and practical strategies for implementing a business-friendly security approach. Discover how Zero Trust can minimize negative impacts, enhance risk management, and safeguard digital assets. Click here to download the report now!

Source :
https://www.trendmicro.com/it_it/research/23/f/human-vs-machine-identity-management.html