More than ever, social media channels are putting video content front and center on their feeds, as audiences increasingly turn to TikTok, Reels, and live videos to be entertained, discover products, and even learn about exciting new brands.
And for marketers, leveraging video not only offers the highest ROI of any media format, but it plays a key role in helping marketers exceed their goals.
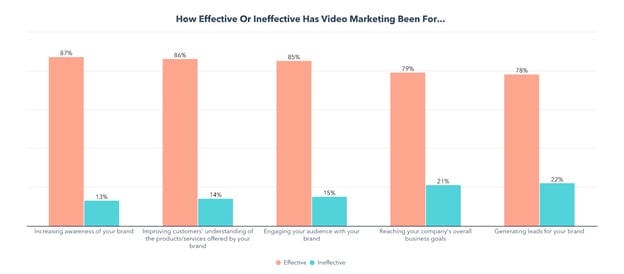
To learn more about the top strategies and opportunities in video marketing today, we surveyed over 500 professionals that specialize in this field. Immediately, the effectiveness of video marketing became obvious.
→ Access Now: Video Marketing Starter Pack [Free Kit]
But where in the world of video marketing should you focus your efforts first? To help you determine your next steps, we gained insights from video marketers about all sorts of topics and tactics including:
- Video Marketing Benchmarks and Metrics
- The Top Video Marketing Goals and Strategies
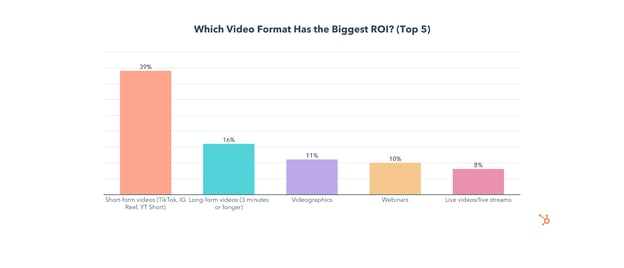
- Which Video Formats Have the Highest ROI?
- Which Channels and Platforms are Most Effective For Video?
- How to Make Viral Videos
Let’s dive in.
Video Marketing Survey Findings
Video Marketing Benchmarks
If no one sees your video, was it even worth making?
We first asked video marketers how many views their videos get on average. Here’s what we found:
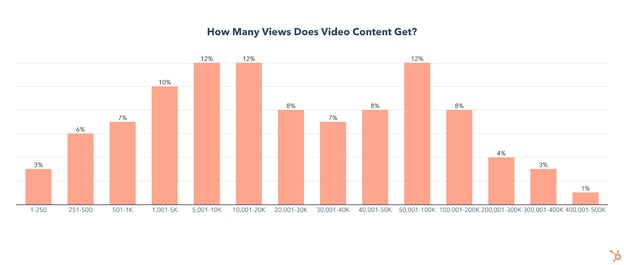
- 38% of marketing videos average less than 10K views
- 16% average under 1,000 views
- 16% average over 100K views
But views aren’t the only metric marketers track. There’s a long list of data points you could be keeping your eyes on, so let’s take a look at which are the best measure of your video’s performance.
The Most Prioritized Video Marketing Metrics
Once you begin to get views, you’ll also want to build on your strategy by looking at and improving on a few other metrics.
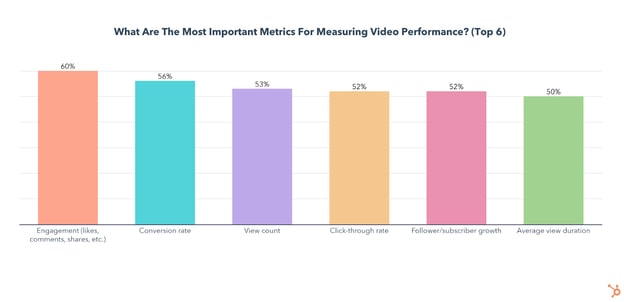
Among video marketers, video engagement, conversion rate, and click-through rate are among a handful of other KPIs marketers look at, with engagement rate being prioritized by 60% of marketers, and conversion and click-through rates being a focus of 56% and 52% of marketers respectively.
Below, we’ll dig a bit deeper into the importance of each major metric.
1. Engagement Rate
According to 60% of video marketers, engagement is the most important metric to watch. After all, when a video sees high engagement, that means it is resonating with your audience enough to make them want to drop a like, write a comment, or share it with their friends.
2. Conversion Rate
Conversion rate comes in at #2 and can be a great indicator of how successful your video is at getting viewers to take the desired action.
3. Click-through Rate Speaks to Your Thumbnail and Title/Caption
Click-through rate (CTR) comes in at #4 and can tell you how effective your thumbnail is at getting people to watch the video in the first place. Before watching a video, your audience is also seeing the title or caption attached to it, which your CTR will also reflect.
4. Follower and Subscriber Growth
If you are gaining followers/subscribers from a video, that means it’s resonating with viewers and they want to see more from your brand.
If one of your videos grows your following more than usual, try to think about what set this video apart from the rest and replicate it. Also, check your analytics for helpful information on how these new subscribers/followers found your video. How can you keep providing them with valuable content?
5. Average View Time
Average view duration is key to understanding which parts of your video are highly engaging and which sections needed more work or should have been cut out entirely. While the overall average can offer useful insights when comparing similar-length videos, if possible, check the percentage of viewers watching at key moments throughout the video.
For example, if a high percentage of viewers stick around through the introduction, you successfully hooked them. However, if you see a huge dropoff halfway through, the video may have been too long.
Speaking of video length, we also asked video marketers how long a marketing video should be. Let’s take a look at what they told us.
How Long Should a Marketing Video Be?
A whopping 96% of marketers agree that the optimal length of a marketing video is under 10 minutes.
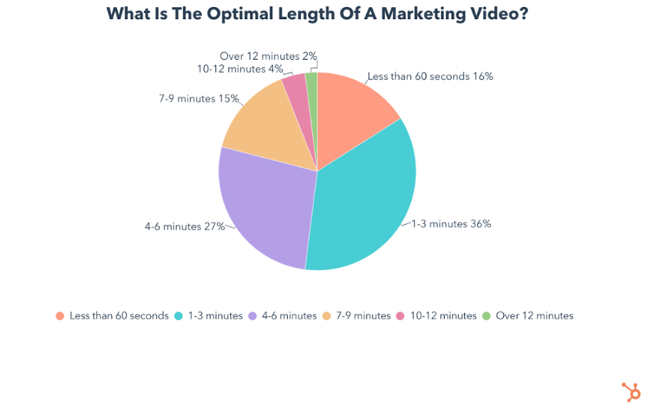 Beyond that, opinions start to differ, with the largest chunk of them (36%) saying videos should be between 1-3 minutes, while 27% think the sweet spot is between 4-6 minutes. Another 16% say the optimal video length is under 60 seconds. On the other hand 15% advocate for videos between 7-9 minutes long.
At the end of the day, the length of your video will largely depend on which type of video best suits your goals. So let’s dive into video marketers’ top goals in 2022.
Video Marketing Goals
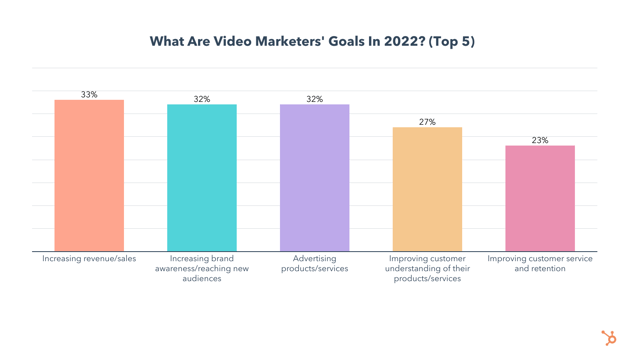
The top three video marketing goals include increasing revenue (focused on by 33% of respondents(, raising brand awareness and advertising products/services (with 32% of marketers focusing on each).
More than one-fourth of marketers are also focused on improving customers’ understanding of products/services, while 23% want to improve customer service and retention with video.
As I mentioned at the very start, our survey shows video marketing is highly effective for reaching all of these goals, so let’s dive into some of the strategies video marketers are using to succeed.
Video Marketing Strategies
The Top Tactics for Creating Effective Videos
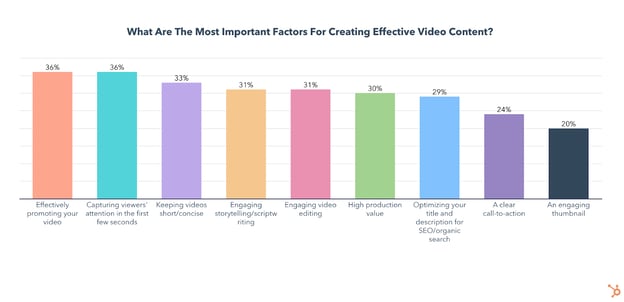
The most important factors for creating effective marketing videos are effectively promoting your video, capturing viewers’ attention in the first few seconds, and keeping your videos short/concise.
Why Video Promotion Is Key
It can be tempting to dedicate all of your time to crafting the “perfect” video with slick edits, high production value, and an irresistible thumbnail. While these things are important, they lose their power without effective video promotion.
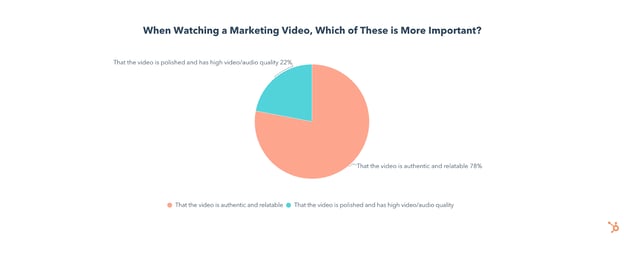
In fact, in a recent trends survey, we found that 78% of consumers say it is more important for marketing videos to be authentic and relatable than polished and high-quality. That doesn’t mean you should neglect video/audio quality, but it isn’t going to make or break a video’s success.
On the other hand, ineffectively promoting your video can cause your video to flop, so let’s take a look at a few strategies video marketers use to make sure that doesn’t happen.
How to Promote a Marketing Video
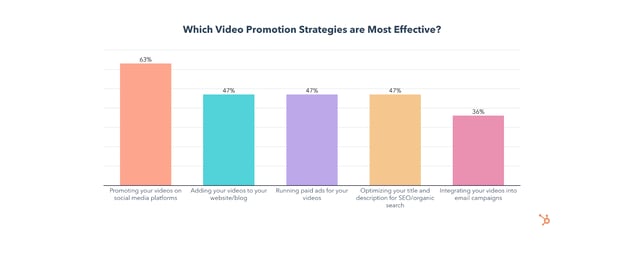
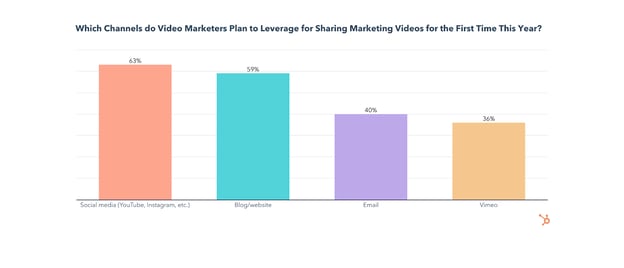
The most effective video promotion strategies are sharing them on social media, adding videos to your website/blog, running paid ads for your videos, optimizing your title/description for search, and integrating videos into your email campaigns.
Whichever channels you choose for video promotion, remember that simply sharing a video isn’t enough. Effective video promotion begins before a video is even complete and continues long after a video is published.
For example, if your video is going live on YouTube in the next 24 hours, hop on Instagram and start a countdown on your story. Share the thumbnail and title 3-5 hours before the video drops to generate more interest. Prepare a teaser to hook viewers in and share that on social media as soon as your video releases.
Once the video is out, you can run an interactive poll related to your video on social media to engage your core audience and pique the interest of those who haven’t seen it yet. You can also set up an email campaign to go out announcing your video a few hours later, or add a banner to your website linking to the video.
Lastly, make sure to continue promoting when the opportunity arises. For example, if you see a Reddit or Twitter thread related to the topic of your video and think your content could add value to the conversation, drop it in the comment section.
Now that you’re up to speed on video marketing goals and strategies, let’s take a look at which video formats are most effective.
Top Video Formats
The top video three video formats are short-form, long-form, and live videos. In this section, we’ll take a deep dive into each of these, looking at which has the best ROI, how long each type of video should be, and a few relevant benchmarks.
1. Short-form Video
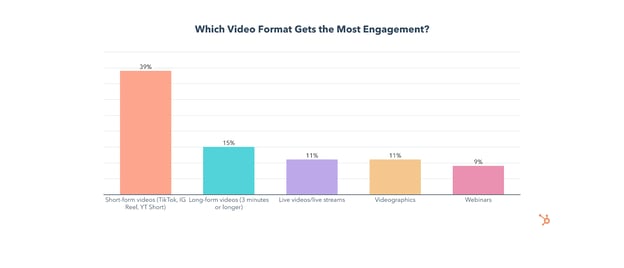
Of all the video formats, short-form has the highest ROI and is also #1 for lead generation and engagement.
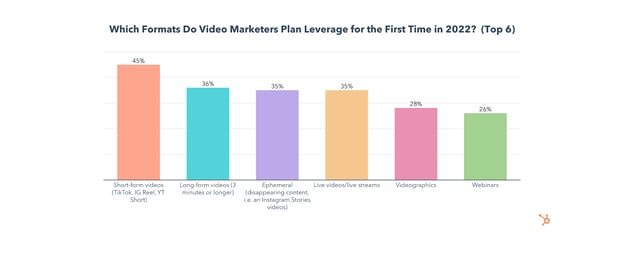
The use of short-form video will grow significantly in 2022, with 36% of video marketers planning to invest more in it than any other format, and 45% planning to use it for the first time this year.
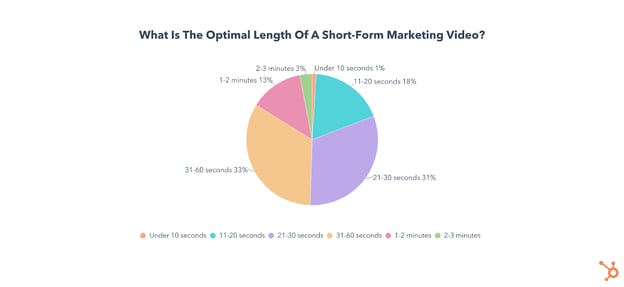
If you’re one of those marketers, you may be wondering how long a short-form video should be. The consensus among video marketers is that a short-form video is under 60 seconds, with the biggest chunk (33%) saying the optimal length is 31-60 seconds.
When it comes to the percentage of time a video is watched, nearly all short-form videos are watched for over 40% of their duration, which isn’t surprising due to their quick runtime. 59% of them are watched for 41-80% of their length, and 30% have an average watch percentage over 81%.
The average watch percentage for these videos can even exceed 100% as your audience replays them over and over.
Lastly, when looking at click-through rates, nearly half of short-form marketing videos also have a CTR between 5-8%.
2. Long-Form Video
Long-form videos, defined in this survey as videos over three minutes, come in 2nd to short-form for ROI, lead generation, and engagement.
Long-form video will also see significant growth in 2022 as 18% of video marketers plan to invest more in it than any other format, and 36% of will use it for the first time this year.
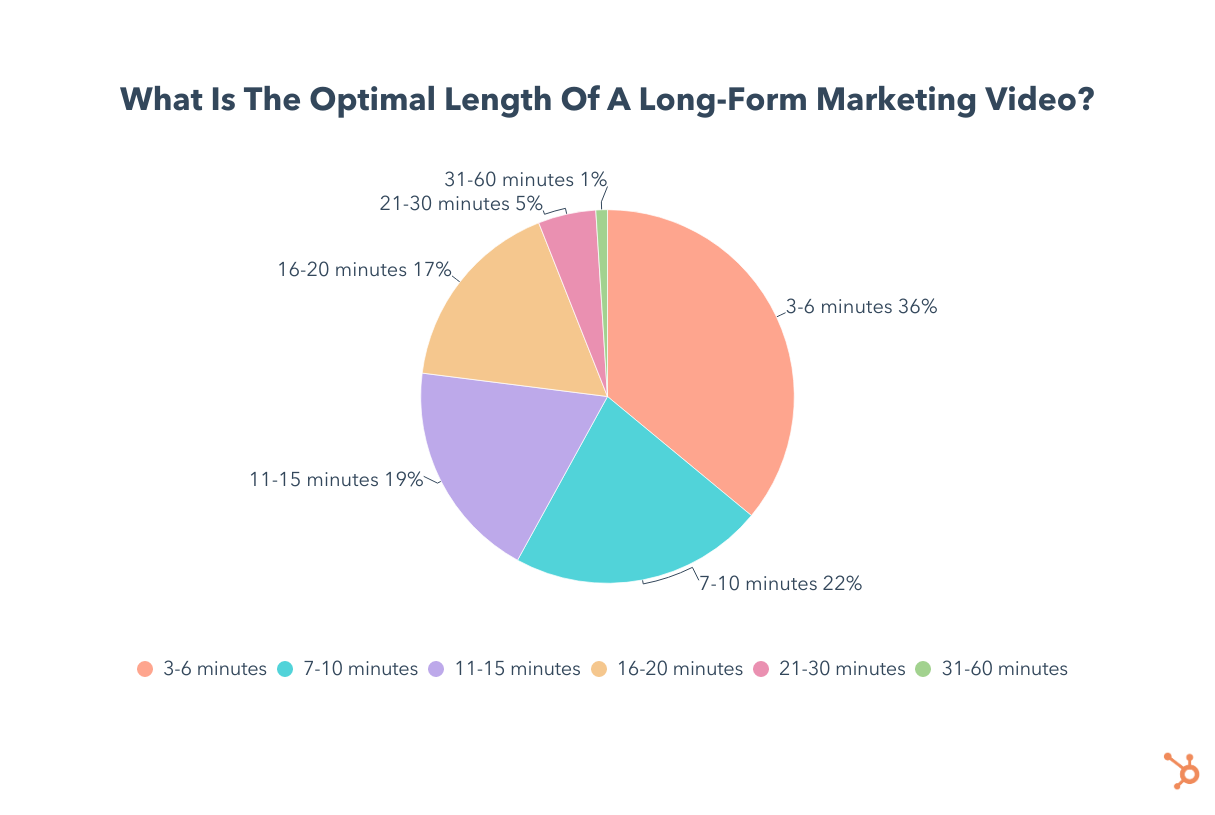
The biggest chunk of video marketers (36%) say the ideal length for long-form videos is 3-6 minutes, though many also advocate for videos up to 20 minutes long.
Looking at the average watch percentage, 38% of long-form marketing videos fall between 41-60%, while one in four sees an average watch percentage of 61-80%. Another 22% fall between 21 to 40%.
When it comes to CTR, the biggest chunk (57%) of long-form marketing videos are between 5-8%, which is similar to the CTR for short-form videos.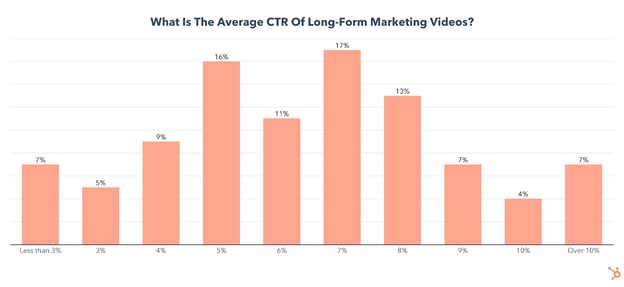
3. Live Videos/Live Streams Metrics And Benchmarks
Live videos or streams are used by 32% of video marketers and come in #4 for ROI and #3 for engagement. And, use of live videos/live streams will also grow in 2022, with 35% of video marketers planning on leveraging it for the first time.
The optimal length of a live video/live stream is between 4-9 minutes, according to 51% of video marketers. Another 22% prefer to go live for 1-3 minutes, while around one in five recommends a longer time frame of 10-30 minutes.
When it comes to the average percentage of a video watched, over 60% of live videos/live streams fall are viewed for 41% to 80% of their duration.
The Top Video Marketing Channels
1. Social Media
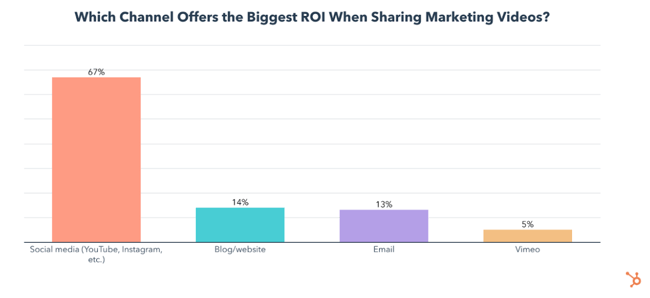
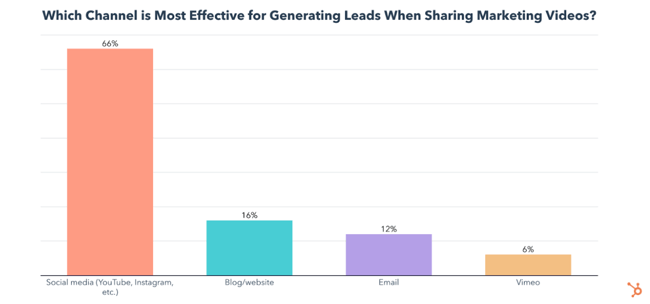
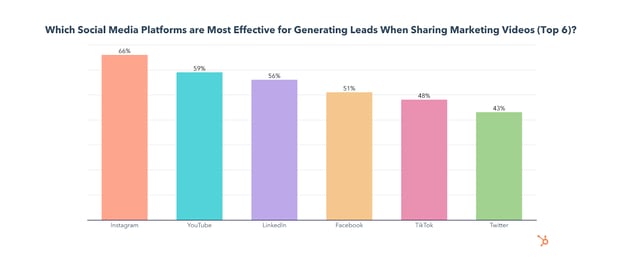
Social media is used for video sharing by 76% of video marketers and has the biggest ROI of any video marketing channel, by far. It is also the most effective channel for generating leads from marketing videos.
 Use of social media for sharing marketing videos will grow significantly in 2022, with, 61% of all video marketers planning to invest more in sharing videos on social media than any other channel this year. Additionally, almost 2 in 3 of those who never used social media for sharing videos plan to do so for the first time this year.
2. Blog/Website Pages
A blog or website is used by 55% of video marketers to share their videos, has the 2nd highest ROI, and is the 2nd most effective at generating leads.
Use of a blog or website for sharing marketing videos will also grow in 2022, with 59% of video marketers planning to try it for the first time, and 18% of all video marketers investing in using their blog/website for sharing marketing videos over any other channel.
3. Email
Email is used by 44% of video marketers to share their videos and nearly tied with blog or website for ROI.
40% of video marketers plan to share videos through email for the first time in 2022, and 11% plan to invest more in sharing videos through email than through any other channel this year.
While all these channels can be effective for sharing marketing videos, social media is the clear winner. So let’s dive into which social media apps are most effective for video sharing.
The Best Social Media Channels for Sharing Videos
1. Instagram
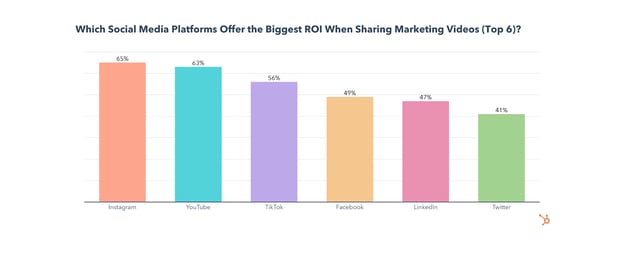
Instagram is the top social media platform for ROI, engagement, and lead generation for sharing marketing videos and will see significant investment from video marketers in 2022.
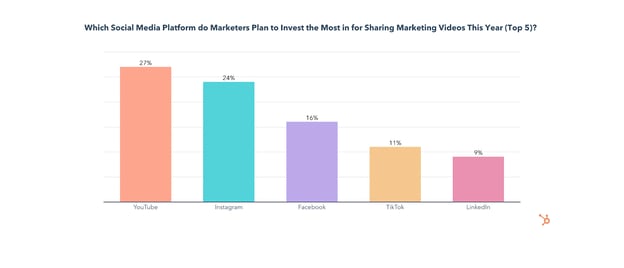
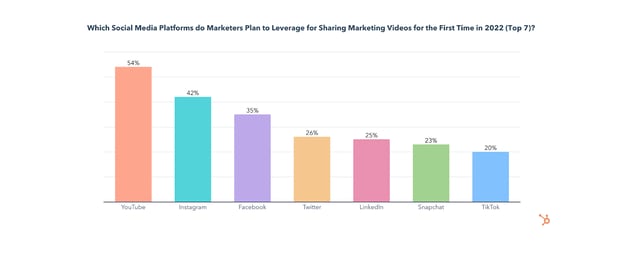
Use of Instagram by video marketers will grow significantly in 2022, as 24% of them will invest more into sharing videos on Instagram than on any other platform. Additionally, 42% of those who don’t use Instagram for sharing videos will do so for the first time this year.
2. YouTube
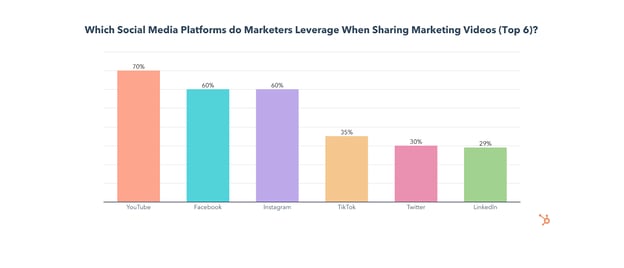
While YouTube comes in at #2 behind Instagram for ROI and lead generation, it is the most used app for video sharing, with 70% of video marketers leveraging it.
YouTube will also see the most investment from video marketers in 2022, with 27% investing more into sharing videos on YouTube than any other platform. On top of that, over half of those who don’t use YouTube for sharing videos will do so for the first time in 2022.
3. Facebook
Facebook is used by 60% of video marketers when sharing marketing videos (tied at #2 for usage with Instagram), though it comes in 4th for ROI, engagement, and lead generation.
35% will invest in sharing videos on Facebook for the first time in 2022 and 16% of video marketers will invest more in sharing videos on Facebook than on any other platform this year.
4. TikTok
While TikTok has the 3rd highest ROI and comes in 2nd for engagement, only 35% of video marketers currently share videos on the app, and just 20% plan to start for the first time in 2022.
Which social media channels have low video performance?
Reddit, Tumblr, Twitch, Snapchat, and Pinterest are consistently the worst channels for sharing marketing videos and will see the least investment from video marketers in 2022.
Another consideration when sharing videos on social media is whether you will pay for ads or share your content organically. Let’s take a look at which video marketers are using.
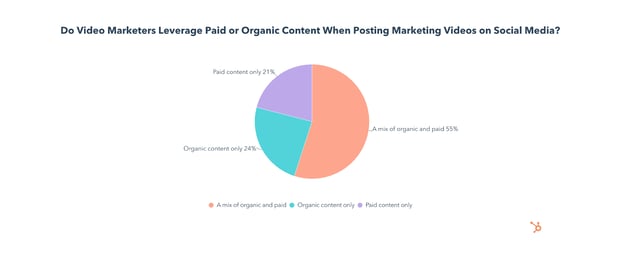
Should you use paid or organic video posts on social media?
55% of video marketers leverage a mix of organic and paid content when posting videos on social media, while 24% use organic only, and 21% use paid only.
Now that we’ve looked at how marketers are sharing their videos on social media, let’s compare two of the most common platforms for hosting videos – YouTube and Vimeo.
Hosting Videos on YouTube vs. Vimeo
We asked video marketers who use both YouTube and Vimeo to compare the two, and not only do 78% of them say YouTube is more effective for reaching their overall business goals, but YouTube is far superior in every category.
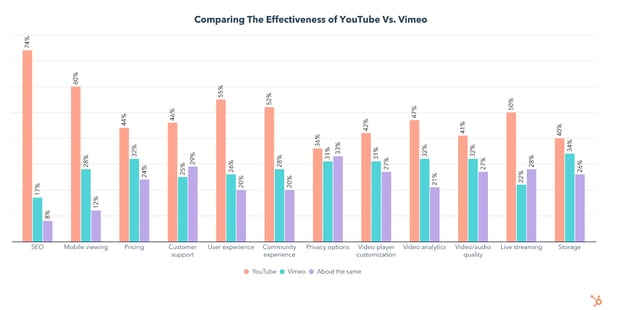
Vimeo comes close to being as effective as YouTube for privacy options, storage, video/audio quality, and video player customization, but still lags behind or is considered about the same as YouTube.
What are the Top Content Types for Marketing Videos?
1. Content Showcasing Your Products and Services
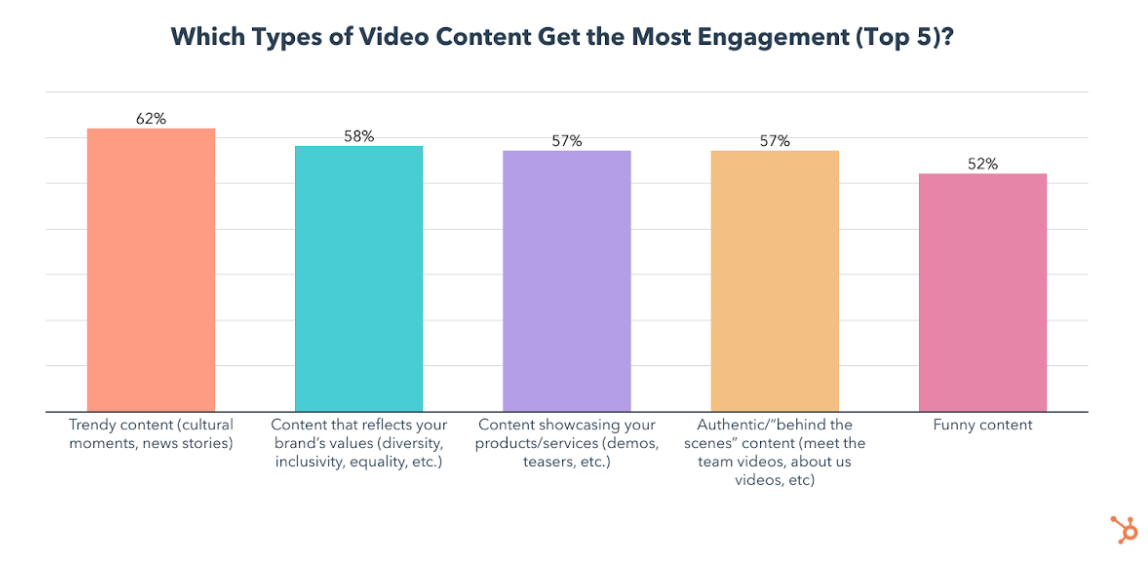
Content showcasing products/services is the most leveraged type of video content and has the highest ROI of any content type, with 66% of participants reporting high returns. It is also the most effective at generating leads and gets the 2nd most engagement of all content types we asked about.
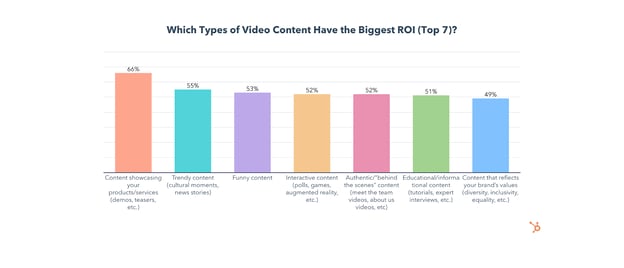
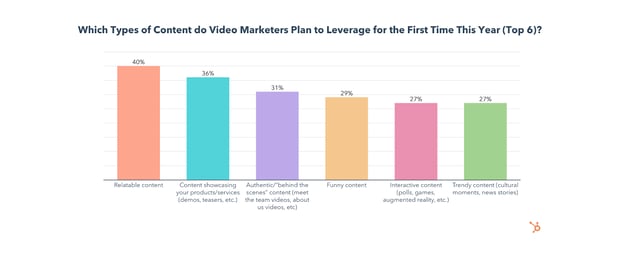
Product and service content will also see the most investment of any video content type this year, with 17% planning to invest in it more than any other, while 36% plan to leverage it for the first time in 2022.
2. Content That Reflects Your Brands Values
Content that reflects a brand’s values is the second most leveraged type of video content and the 2nd most effective for generating leads and engagement.
3. Trendy Content
People generally don’t want to watch videos that feel out of date or out of touch, but they’re drawn to videos that discuss topics that they’re currently intreested in, like trends or news related to their industry or hobbies. This is likely why “trendy content” has the second-highest ROI and gets the most engagement.
 4. Relatable Content
Relatable content will see the most new investment in 2022, with 40% planning to leverage it for the first time, while 12% will invest more in it than any other content type.
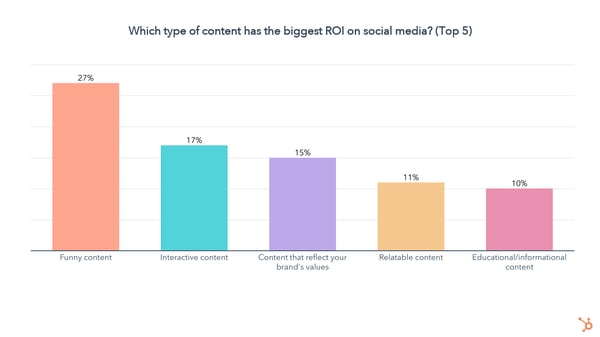
5. Funny and Interactive Content
Both funny and interactive content have high ROI and will be leveraged by 29% and 27% of video marketers for the first time in 2022, respectively.
Next, let’s look at the different styles of videos you can use, and which are most effective.
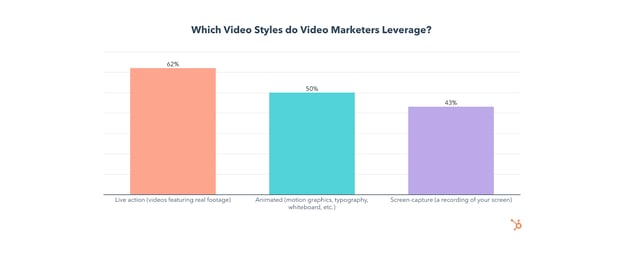
Top Video Styles
1. Live-Action (Videos Featuring Real Footage)
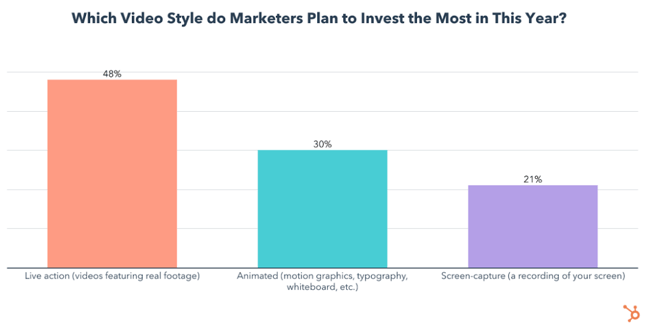
Live-action videos are leveraged most often, have the biggest ROI, are the most effective for lead generation, and get the most engagement.
Use of live-action video will grow significantly in 2022, as 55% plan to use it for the first time ever and 48% of all video marketers will invest more in live-action than any other video style.
 2. Animated Videos
Animated videos are used by one in two video marketers, have the second-highest ROI, and are the 2nd most effective for lead generation and engagement.
49% of video marketers will also leverage animated videos for the first time this year, and 30% will invest in them more than any other video style.
3. Screen-Capture or Screen Recording
Screen-capture videos are used by 43% of video marketers, the least of the three video styles. Screen-capture has the lowest ROI, by far, and is much less effective for generating leads and engagement.
However, screen-recorded videos will see more use in 2022, with 52% planning to leverage them for the first time and 21% planning to invest more in them than any other video style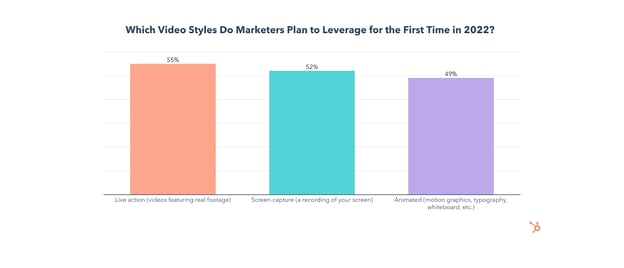
Now that you know the top formats, styles, and content types for marketing videos, as well as where to share them, we can dive into our research on how to create viral videos.
Viral Videos
Getting one of your videos to go viral might seem like a pipe dream, but it isn’t as out of reach as you might think.
63% of video marketers have created a viral video – so let’s take a look at exactly how they did it so your next video can blow up too.
How to Make a Video Go Viral
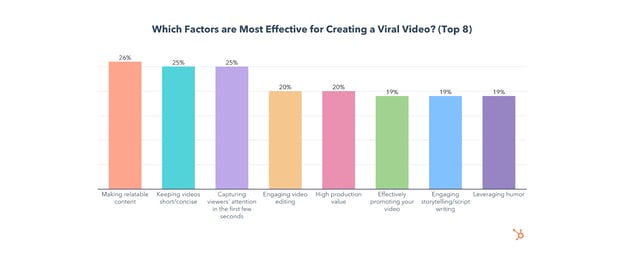
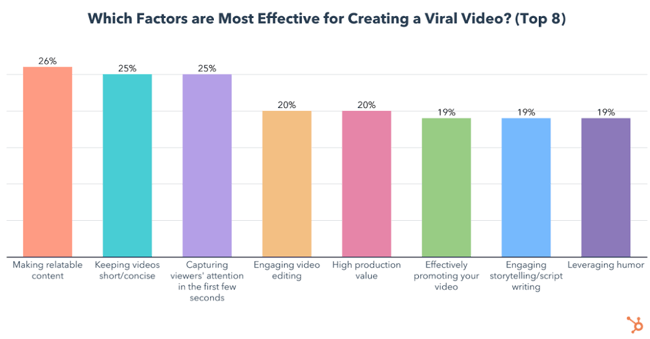
The most effective strategies for creating a viral video are making retable content, keeping videos short/concise, and capturing viewers’ attention in the first few seconds.
Let’s dig a little deeper into these top three strategies and how you can use them.
1. Making Relatable Content Means More Engagement
Making relatable content is key to getting viewers to engage with your video. Whether they comment on your video or share it with a friend, the algorithm takes notice and boosts your video to more viewers, increasing its chances to go viral.
2. Shorter Is Better
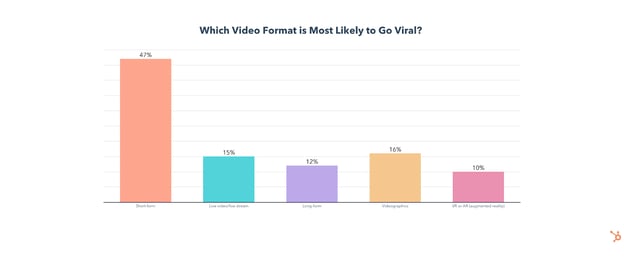
Keeping videos short is also crucial to virality. According to 47% of video marketers, short-form videos are the most likely to go viral.
But how long is a short-form video exactly? Our video marketing trends report found that the consensus among video marketers is under 60 seconds, with the biggest chunk (33%) saying the optimal length is 31-60 seconds.
3. Capture Attention Immediately
Capturing viewers’ attention in the first few seconds is the third most effective way to make a video go viral.
This could be as simple as starting a video with a colorful animation, an intriguing question, showing text on-screen, or even with physical movements like hand motions or jumping out of your chair to set a video off.
Now that you know the top strategies to make a video go viral, let’s take a look at which platforms you should use.
Which Platform are Videos Most Likely to Go Viral On?
YouTube, TikTok, Instagram, and Facebook are the platforms that video marketers say are most likely to have a video go viral.
 If you have a social media presence on any of those three, they can be powerful for scoring a viral video. But if you’re not leveraging them yet, it might be time to finally give TikTok, Instagram Reels, or YouTube Shorts a shot.
Which Type of Video Content is Most Likely to Go Viral?
Funny, trendy, and relatable videos that reflect a brand’s values are most likely to go viral.
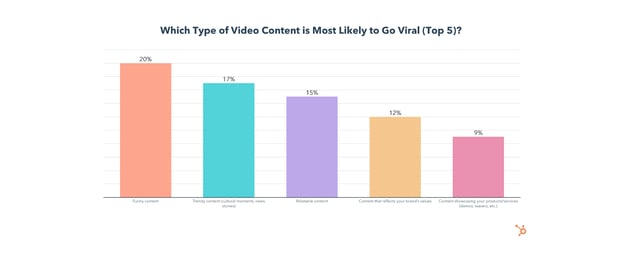 Combine these top content types by creating a funny, relatable, and on-trend video for the best chance of going viral.
Lastly, we’ll take a look at the different video styles and which is most effective for a viral video.
Which Style of Video Content is Most Likely to Go Viral?
Live-action videos are most likely to go viral according to 49% of video marketers, but animation is also effective for 31% of respondents.
If you can, use both. Keep viewers engaged by switching back and forth between your live-action shot and animation with a voiceover.
Video Marketing Benefits & Challenges
Video Marketing Benefits
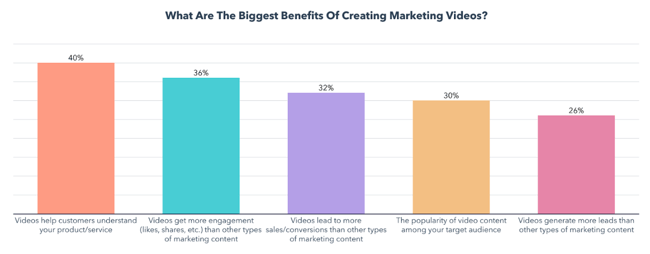
The biggest benefits of creating marketing videos are that they help customers understand a product/service, get more engagement than other marketing content, and lead to more sales/conversions than other marketing content.
While this seems perfectly in line with video marketers’ goals, those benefits also come with a few challenges.
Video Marketing Challenges
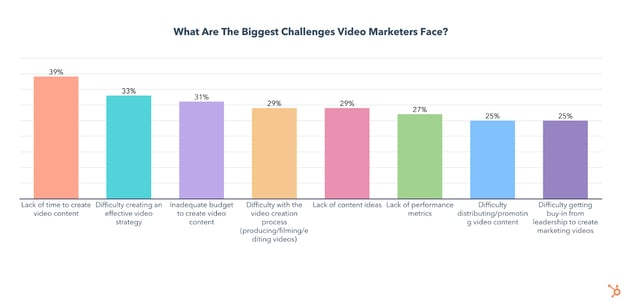
The biggest challenges video marketers face are a lack of time to create video content, difficulty creating an effective video strategy, and inadequate budget to create video content.
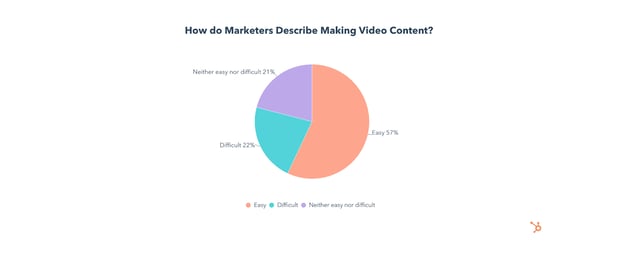
The great news is that video marketing is simpler than ever, with 57% of video marketers describing video marketing as easy.
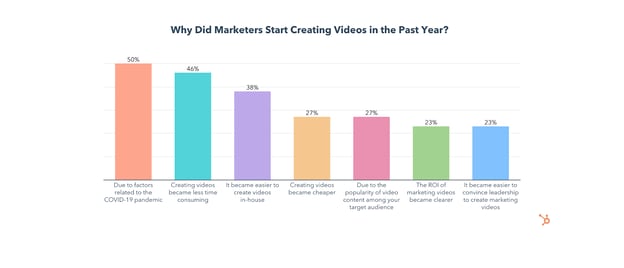
On top of that, 46% of those who started making videos in the past year did so because creating marketing videos became less time-consuming, and 38% said they started because videos became easier to make in-house. 1 in 2 also started making marketing videos in response to the pandemic.
Whether you’re just starting out or you’ve been making videos for a while, budgeting can be a stressful part of the process. To help you navigate your video marketing budget, let’s take a look at how other marketers are budgeting for their videos.
Video Marketing Budgets
81% of video marketers have a dedicated budget for video marketing. Here’s what those budgets look like:
- 20% of companies spend over $100K on video marketing per quarter
- Around 1 in 4 spend under $20K
- 42% spend between $20K-$100K
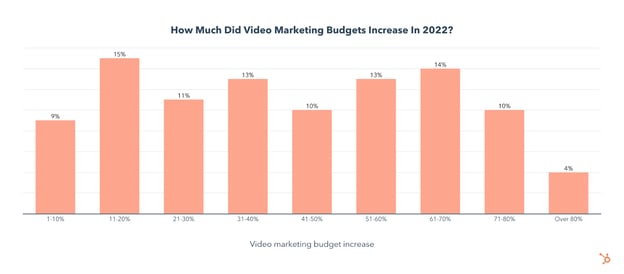
We also asked video marketers how their budget changed from 2021 to 2022, and found that 52% of video marketers saw a budget increase in 2022, while 46% saw no change. Just 2% saw a decrease.
Marketers who saw an increase in their video budget generally received a substantial boost in their budget, with 41% of video marketers getting an increase of over 51%.
You may also be wondering what percentage of total marketing budgets goes towards video marketing, so let’s take a look at that too.
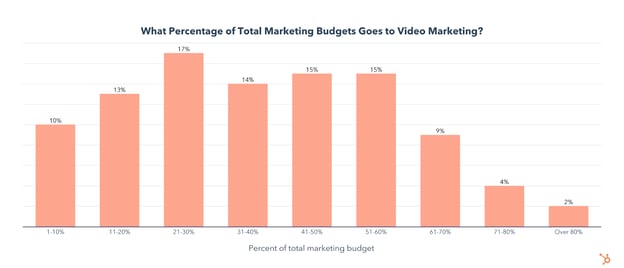
It turns out that 44% of companies spend 31-60% of their total marketing budget on video marketing.
How Much Does Creating a Marketing Video Cost?
91% of marketers’ companies spend under $50,000 to create a marketing video, and over half spend under $10,000.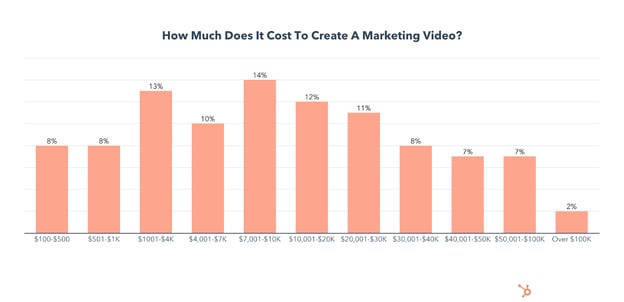
With the total cost of making a marketing video in mind, let’s look into how much video marketers are spending on each step in the video creation process.
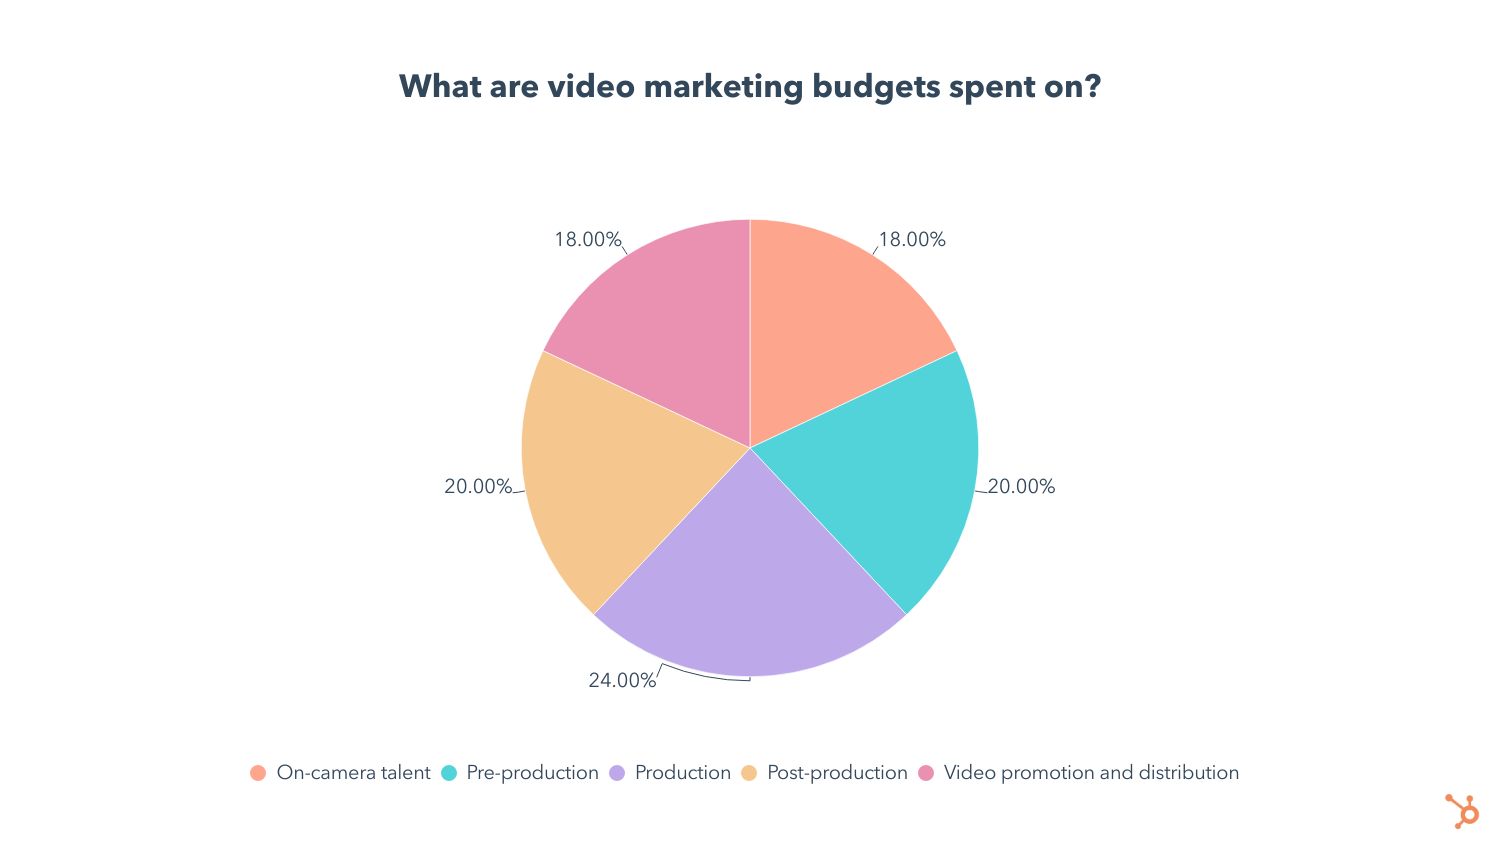
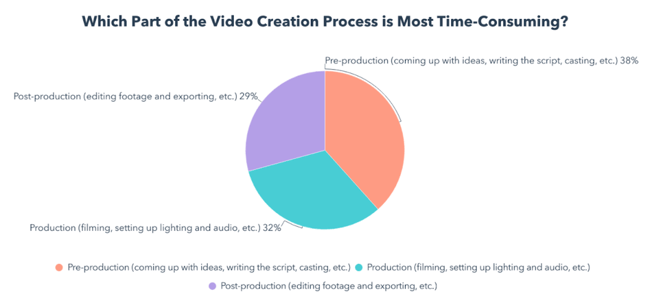
Production takes up 24% of the average video marketer’s budget, followed by pre-production and post-production tied at 20%. Another 18% is spent on talent and video promotion/distribution.
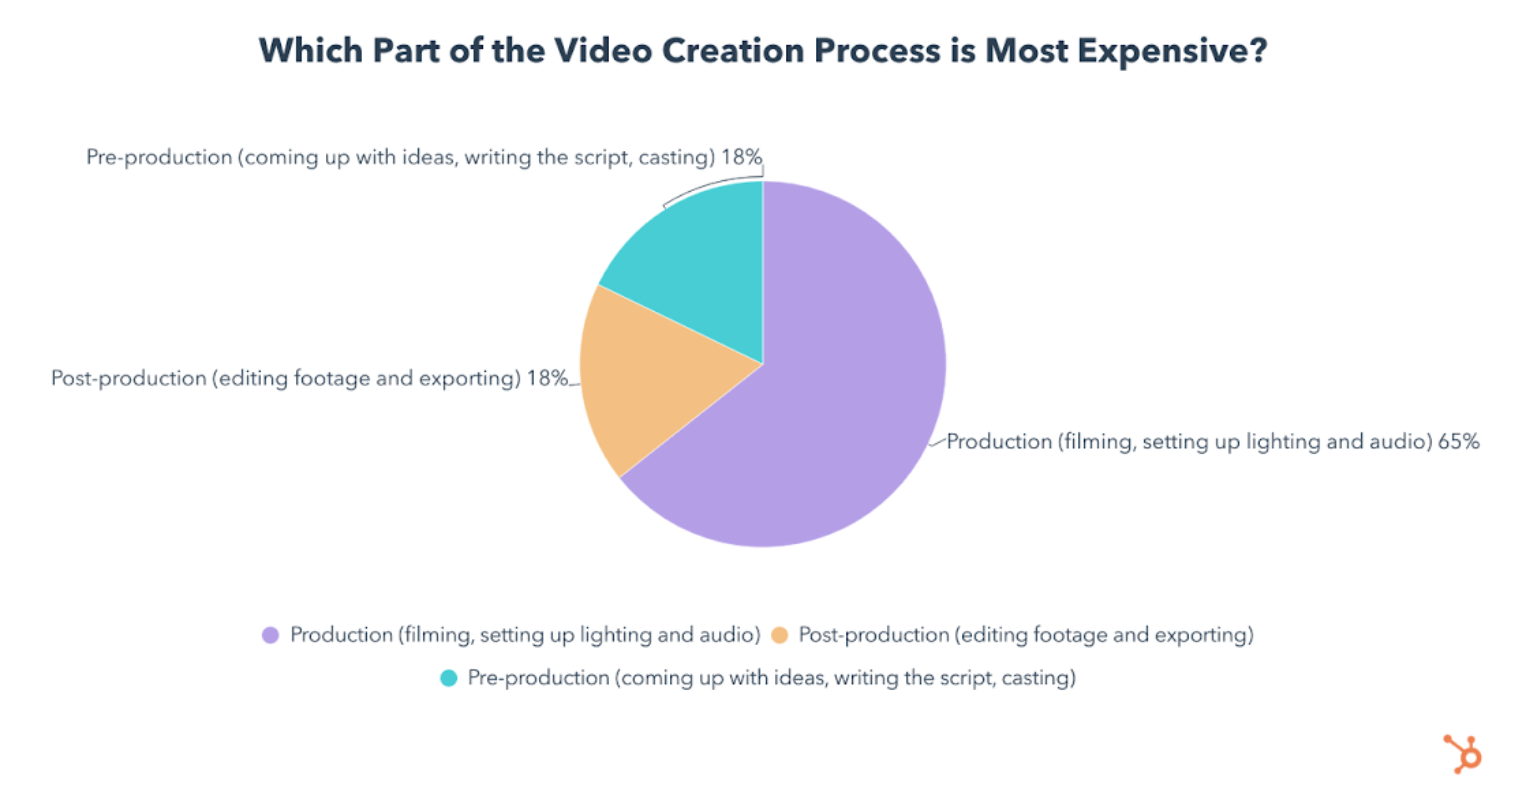
We also asked video marketers which part of the video creation process is most expensive, and 65% of them say production is the costliest step.
 Lastly, let’s talk about how long it takes to create a marketing video and which parts are most time-consuming.
How Long Does it Take to Create a Marketing Video?
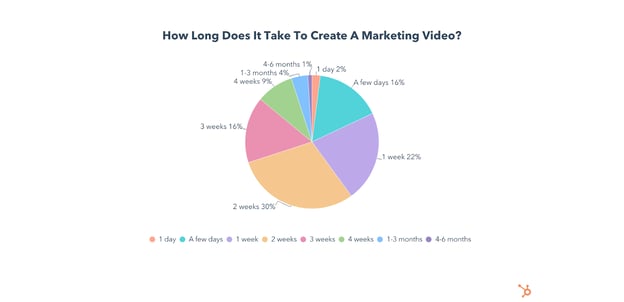
86% of marketing videos are created in 3 weeks or less, and 40% are made in under a week.
The most time-consuming part of the video creation process is pre-production (coming up with ideas, writing script, casting, etc.), according to 38% of those who make marketing videos in-house.
 More Insights From the HubSpot Blog
Whether you’re just getting started with video marketing or a seasoned video professional, keeping up with the latest trends and marketing strategies is key.
While video marketing is currently one of the top marketing strategies, there are a few others that have even better ROI – luckily, you can incorporate most of them into your video marketing strategy for even better results.
If you’re ready to take your video marketing strategy to the next level, check our Marketing Trends and Social Media Trends research from earlier this year!
Just getting started with video? You can also download our free Video Marketing Starter Pack below.

Source :
https://blog.hubspot.com/marketing/video-marketing-report
.png?width=1500&name=social-media-trends-bar-graph%20(15).png)


![Global Corporate PPA Volumes - Chart [June 2022].jpg](https://storage.googleapis.com/gweb-cloudblog-publish/images/Global_Corporate_PPA_Volumes_-_Chart_June_.max-2800x2800.jpg)


 in-the-wild 0-days per year. The bar graph is split into two color: yellow for Anonymously reported 0-days and green for non-anonymous reported 0-days. 2021 is the only year with any anonymously reported 0-days. 2015: 0, 2016: 3, 2018: 2, 2019: 1, 2020: 3, 2021: Non-Anonymous: 8, Anonymous- 12. Data from: https://docs.google.com/spreadsheets/d/1lkNJ0uQwbeC1ZTRrxdtuPLCIl7mlUreoKfSIgajnSyY/edit#gid=2129022708")

