István Márton
December 12, 2023
On August 14, 2023, the Wordfence Threat Intelligence team began a research project to find Stored Cross-Site Scripting (XSS) via Shortcode vulnerabilities in WordPress repository plugins. This type of vulnerability enables threat actors with contributor-level permissions or higher to inject malicious web scripts into pages using plugin shortcodes, which will execute whenever a victim accesses the injected page. We found over 100 vulnerabilities across 100 plugins which affect over 6 million sites. You can find the complete chart of affected plugins below.
All Wordfence Premium, Wordfence Care, and Wordfence Response customers, as well as those still using the free version of our plugin, are protected by the Wordfence firewall’s built-in Cross-Site Scripting protection against any exploits targeting this type of vulnerability.
Why are these vulnerabilities so common?
By a general definition, shortcodes are unique macro codes added by plugin developers to dynamically and automatically generate content. Developers can use shortcode attributes to optionally add settings, making the content even more dynamic and providing more options for users.
It is important to note that shortcodes are typically used in the post content on WordPress sites, and the post content input is sanitized before being saved to the database, which is a WordPress core functionality, so it is often sanitized in all cases.
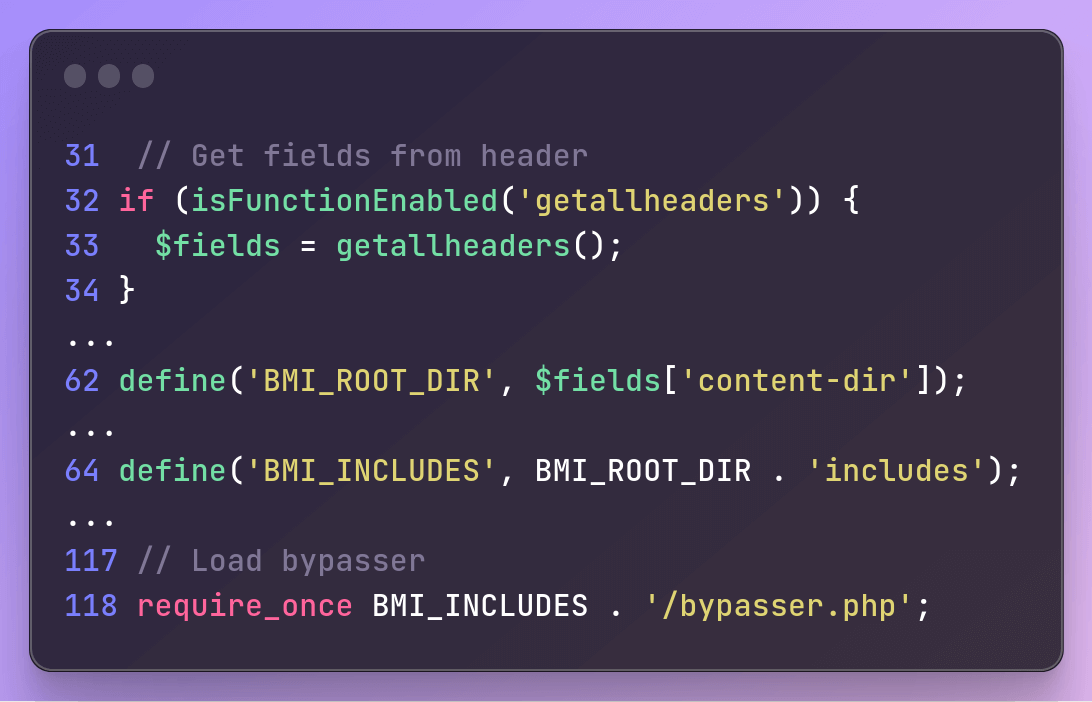
Developers might assume that since WordPress core sanitizes post content, the attributes used in shortcodes are also sanitized and secure. However, the wp_kses_post() sanitization function only sanitizes complete HTML elements.
These vulnerabilities occur when the value provided in the shortcode attribute is output in dynamically generated content within the attributes of an HTML element. In such cases, the value specified in the shortcode contains only HTML element attributes, which are not sanitized during the save of a post. As mentioned earlier, the sanitize function only sanitizes complete HTML tags.
An example shortcode containing an HTML tag sanitized by the wp_kses_post() function:
[custom_link class=”<p onmouseover=’alert(/XSS/)’>Click Here!</p>”]
In this case, wp_kses_post() checks and sanitizes the entire <p> tag and its attributes.
An example shortcode not sanitized by the wp_kses_post() function:[cutsom_link class="' onmouseover='alert(/XSS/)'"]
As there is no HTML tag in this case, the wp_kses_post() function does not check or sanitize anything.
Note: The above explanation demonstrates the usage of cross-site scripting within HTML attributes as it is the most common scenario, but the same problem applies to JS variable values, which will be equally vulnerable if not properly escaped.
Even the WordPress security handbook says the following about escaping output:
“Most WordPress functions properly prepare the data for output, and additional escaping is not needed.”
https://developer.wordpress.org/apis/security/escaping/
After reading this, developers might reasonably assume that the shortcode attributes are sanitized and secure. However, as demonstrated in the above example, there are exceptions.
Vulnerability Summary from Wordfence Intelligence
| Plugin Name | Plugin Slug | CVE | Affected Versions | Patched Version |
|---|---|---|---|---|
| VK Filter Search | vk-filter-search | CVE-2023-5705 | <= 2.3.1 | 2.3.2 |
| Telephone Number Linker | telephone-number-linker | CVE-2023-5743 | <= 1.2 | |
| Tab Ultimate | tabs-pro | CVE-2023-5667 | <= 1.3 | 1.4 |
| Ibtana – WordPress Website Builder | ibtana-visual-editor | CVE-2023-6684 | <= 1.2.2 | 1.2.2.1 |
| Featured Image Caption | featured-image-caption | CVE-2023-5669 | <= 0.8.10 | 0.8.11 |
| Reusable Text Blocks | reusable-text-blocks | CVE-2023-5745 | <= 1.5.3 | |
| Font Awesome More Icons | font-awesome-more-icons | CVE-2023-5232 | <= 3.5 | |
| Podcast Subscribe Buttons | podcast-subscribe-buttons | CVE-2023-5308 | <= 1.4.8 | 1.4.9 |
| Slick Contact Forms | slick-contact-forms | CVE-2023-5468 | <= 1.3.7 | |
| LiteSpeed Cache | litespeed-cache | CVE-2023-4372 | <= 5.6 | 5.7 |
| Theme Switcha – Easily Switch Themes for Development and Testing | theme-switcha | CVE-2023-5614 | <= 3.3 | 3.3.1 |
| WordPress Charts | wp-charts | CVE-2023-5062 | <= 0.7.0 | |
| EasyRotator for WordPress – Slider Plugin | easyrotator-for-wordpress | CVE-2023-5742 | <= 1.0.14 | |
| Leaflet Map | leaflet-map | CVE-2023-5050 | <= 3.3.0 | 3.3.1 |
| Bitly’s WordPress Plugin | wp-bitly | CVE-2023-5577 | <= 2.7.1 | |
| flowpaper | flowpaper-lite-pdf-flipbook | CVE-2023-5200 | <= 2.0.3 | 2.0.4 |
| SEO Slider | seo-slider | CVE-2023-5707 | <= 1.1.0 | 1.1.1 |
| CallRail Phone Call Tracking | callrail-phone-call-tracking | CVE-2023-5051 | <= 0.5.2 | 0.5.3 |
| iframe | iframe | CVE-2023-4919 | <= 4.6 | 4.7 |
| Feeds for YouTube (YouTube video, channel, and gallery plugin) | feeds-for-youtube | CVE-2023-4841 | <= 2.1 | 2.1.2 |
| Instagram for WordPress | instagram-for-wordpress | CVE-2023-5357 | <= 2.1.6 | |
| Awesome Weather Widget | awesome-weather | CVE-2023-4944 | <= 3.0.2 | |
| FareHarbor for WordPress | fareharbor | CVE-2023-5252 | <= 3.6.7 | 3.6.8 |
| Shortcode Menu | shortcode-menu | CVE-2023-5565 | <= 3.2 | |
| Modal Window – create popup modal window | modal-window | CVE-2023-5161 | <= 5.3.5 | 5.3.6 |
| Sponsors | wp-sponsors | CVE-2023-5662 | <= 3.5.0 | |
| Gift Up Gift Cards for WordPress and WooCommerce | gift-up | CVE-2023-5703 | <= 2.20.1 | 2.20.2 |
| Bellows Accordion Menu | bellows-accordion-menu | CVE-2023-5164 | <= 1.4.2 | 1.4.3 |
| TCD Google Maps | tcd-google-maps | CVE-2023-5128 | <= 1.8 | |
| Super Testimonials | super-testimonial | CVE-2023-5613 | <= 2.9 | 3.0 |
| SlimStat Analytics | wp-slimstat | CVE-2023-4597 | <= 5.0.9 | 5.0.10 |
| WP Font Awesome | wp-font-awesome | CVE-2023-5127 | <= 1.7.9 | |
| Advanced Menu Widget | advanced-menu-widget | CVE-2023-5085 | <= 0.4.1 | |
| Comments by Startbit | facebook-comment-by-vivacity | CVE-2023-5295 | <= 1.4 | |
| BSK PDF Manager | bsk-pdf-manager | CVE-2023-5110 | <= 3.4.1 | 3.4.2 |
| Video PopUp | video-popup | CVE-2023-4962 | <= 1.1.3 | 1.1.4 |
| Privacy Policy Generator, Terms & Conditions Generator WordPress Plugin : WPLegalPages | wplegalpages | CVE-2023-4968 | <= 2.9.2 | 2.9.3 |
| WP Responsive header image slider | responsive-header-image-slider | CVE-2023-5334 | <= 3.2.1 | |
| Interact: Embed A Quiz On Your Site | interact-quiz-embed | CVE-2023-5659 | <= 3.0.7 | 3.1 |
| WDContactFormBuilder | contact-form-builder | CVE-2023-5048 | <= 1.0.72 | |
| Widget Responsive for Youtube | youtube-widget-responsive | CVE-2023-5063 | <= 1.6.1 | 1.6.2 |
| TM WooCommerce Compare & Wishlist | tm-woocommerce-compare-wishlist | CVE-2023-5230 | <= 1.1.7 | |
| Pop ups, WordPress Exit Intent Popup, Email Pop Up, Lightbox Pop Up, Spin the Wheel, Contact Form Builder – Poptin | poptin | CVE-2023-4961 | <= 1.3 | 1.3.1 |
| WhatsApp Share Button | CVE-2023-5668 | <= 1.0.1 | ||
| Delete Me | delete-me | CVE-2023-5126 | <= 3.0 | 3.1 |
| WP MapIt | wp-mapit | CVE-2023-5658 | <= 2.7.1 | |
| iframe forms | iframe-forms | CVE-2023-5073 | <= 1.0 | |
| Newsletter – Send awesome emails from WordPress | newsletter | CVE-2023-4772 | <= 7.8.9 | 7.9.0 |
| Theme Blvd Shortcodes | theme-blvd-shortcodes | CVE-2023-5338 | <= 1.6.8 | |
| Social Feed | All social media in one place | add-facebook | CVE-2023-5661 | <= 1.5.4.6 | |
| WS Facebook Like Box Widget | ws-facebook-likebox | CVE-2023-4963 | <= 5.0 | |
| Garden Gnome Package | garden-gnome-package | CVE-2023-5664 | <= 2.2.8 | 2.2.9 |
| Social Sharing Plugin – Social Warfare | social-warfare | CVE-2023-4842 | <= 4.4.3 | 4.4.4 |
| Skype Legacy Buttons | skype-online-status | CVE-2023-5615 | <= 3.1 | |
| Simple Cloudflare Turnstile – CAPTCHA Alternative | simple-cloudflare-turnstile | CVE-2023-5135 | <= 1.23.1 | 1.23.2 |
| Booster for WooCommerce | woocommerce-jetpack | CVE-2023-4945 | <= 7.1.0 | 7.1.1 |
| Simple Shortcodes | smpl-shortcodes | CVE-2023-5566 | <= 1.0.20 | |
| Font Awesome Integration | font-awesome-integration | CVE-2023-5233 | <= 5.0 | |
| Giveaways and Contests by RafflePress – Get More Website Traffic, Email Subscribers, and Social Followers | rafflepress | CVE-2023-5049 | <= 1.12.0 | 1.12.2 |
| ImageMapper | imagemapper | CVE-2023-5507 | <= 1.2.6 | |
| Accordion | accordions-wp | CVE-2023-5666 | <= 2.6 | 2.7 |
| GEO my WordPress | geo-my-wp | CVE-2023-5467 | <= 4.0 | 4.0.1 |
| Related Products for WooCommerce | woo-related-products-refresh-on-reload | CVE-2023-5234 | <= 3.3.15 | 3.3.16 |
| Live Chat with Facebook Messenger | wp-facebook-messenger | CVE-2023-5740 | <= 1.0 | |
| Contact form Form For All – Easy to use, fast, 37 languages. | formforall | CVE-2023-5337 | <= 1.2 | |
| JQuery Accordion Menu Widget | jquery-vertical-accordion-menu | CVE-2023-4890 | <= 3.1.2 | |
| Blog Filter – Advanced Post Filtering with Categories Or Tags, Post Portfolio Gallery, Blog Design Template, Post Layout | blog-filter | CVE-2023-5291 | <= 1.5.3 | 1.5.4 |
| WordPress Social Login | wordpress-social-login | CVE-2023-4773 | <= 3.0.4 | |
| QR Code Tag | qr-code-tag | CVE-2023-5567 | <= 1.0 | |
| Buzzsprout Podcasting | buzzsprout-podcasting | CVE-2023-5335 | <= 1.8.4 | 1.8.5 |
| Drop Shadow Boxes | drop-shadow-boxes | CVE-2023-5469 | <= 1.7.13 | 1.7.14 |
| Carousel, Recent Post Slider and Banner Slider | spice-post-slider | CVE-2023-5362 | <= 2.0 | 2.1 |
| Weather Atlas Widget | weather-atlas | CVE-2023-5163 | <= 1.2.1 | 2.0.0 |
| Contact Form – Custom Builder, Payment Form, and More | powr-pack | CVE-2023-5741 | <= 2.1.0 | |
| MapPress Maps for WordPress | mappress-google-maps-for-wordpress | CVE-2023-4840 | <= 2.88.4 | 2.88.5 |
| Media Library Assistant | media-library-assistant | CVE-2023-4716 | <= 3.10 | 3.11 |
| Google Maps Plugin by Intergeo | intergeo-maps | CVE-2023-4887 | <= 2.3.2 | |
| SendPress Newsletters | sendpress | CVE-2023-5660 | <= 1.22.3.31 | 1.23.11.6 |
| Magic Action Box | magic-action-box | CVE-2023-5231 | <= 2.17.2 | |
| Embed Calendly | embed-calendly-scheduling | CVE-2023-4995 | <= 3.6 | 3.7 |
| Team Showcase | team-showcase | CVE-2023-5639 | <= 2.1 | 2.2 |
| Horizontal scrolling announcement | horizontal-scrolling-announcement | CVE-2023-5001 | <= 9.2 | |
| WP Post Columns | wp-post-columns | CVE-2023-5708 | <= 2.2 | |
| Font Awesome 4 Menus | font-awesome-4-menus | CVE-2023-4718 | <= 4.7.0 | |
| Advanced Custom Fields: Extended | acf-extended | CVE-2023-5292 | <= 0.8.9.3 | 0.8.9.4 |
| Options for Twenty Seventeen | options-for-twenty-seventeen | CVE-2023-5162 | <= 2.5.0 | 2.5.1 |
| Etsy Shop | etsy-shop | CVE-2023-5470 | <= 3.0.4 | 3.0.5 |
| Copy Anything to Clipboard | copy-the-code | CVE-2023-5086 | <= 2.6.4 | 2.6.5 |
| Email Encoder – Protect Email Addresses and Phone Numbers | email-encoder-bundle | CVE-2023-4599 | <= 2.1.8 | 2.1.9 |
| Advanced iFrame | advanced-iframe | CVE-2023-4775 | <= 2023.8 | 2023.9 |
| WP Mailto Links – Protect Email Addresses | wp-mailto-links | CVE-2023-5109 | <= 3.1.3 | 3.1.4 |
| Booster for WooCommerce | woocommerce-jetpack | CVE-2023-5638 | <= 7.1.2 | 7.1.3 |
| Ziteboard Online Whiteboard | ziteboard-online-whiteboard | CVE-2023-5076 | <= 2.9.9 | 3.0.0 |
| Simple Like Page Plugin | simple-facebook-plugin | CVE-2023-4888 | <= 1.5.1 | 1.5.2 |
| CPO Shortcodes | cpo-shortcodes | CVE-2023-5704 | <= 1.5.0 | |
| WCFM Marketplace – Best Multivendor Marketplace for WooCommerce | wc-multivendor-marketplace | CVE-2023-4960 | <= 3.6.2 | 3.6.3 |
| Connect Matomo (WP-Matomo, WP-Piwik) | wp-piwik | CVE-2023-4774 | <= 1.0.28 | 1.0.29 |
| Very Simple Google Maps | very-simple-google-maps | CVE-2023-5744 | <= 2.9 | 2.9.1 |
| Contact Form by FormGet – Best Form Builder Plugin for WordPress | formget-contact-form | CVE-2023-5125 | <= 5.5.5 | |
| Professional Social Sharing Buttons, Icons & Related Posts – Shareaholic | shareaholic | CVE-2023-4889 | <= 9.7.8 | 9.7.9 |
Security recommendations for developers
We recommend using one of the built-in WordPress escaping functions before outputting user data. WordPress has a number of functions that can be used for different situations. You can read more about these functions at: https://developer.wordpress.org/apis/security/escaping/
Technical Analysis #1
A general but fictional shortcode will be used to demonstrate a shortcode XSS vulnerability, focusing only on the most important details.
Let’s take an example where shortcode attributes are used as HTML attributes.
The vulnerable shortcode function:
|
1
2
3
4
5
6
7
8
9
10
11
12
|
function custom_link_shortcode( $atts, $content ) { $atts = shortcode_atts( array( 'class' => 'custom-link', // default class value 'href' => '#', // default href value ), $atts ); $output = '<a class="' . $atts['class'] . '" href="' . $atts['href'] . '">' . $content . '</a>'; return $output;}add_shortcode( 'custom_link', 'custom_link_shortcode' ); |
Let’s take a look at an example where the following shortcode is used in the post content:[custom_link class='my-custom-class']Link Text[/custom_link]
As a result, the following link will be displayed in the post:
| 1 | <aclass="my-custom-class"href="#">Link Text</a> |
In this case, the class attribute of the shortcode is used and outputted in the class attribute of the <a> HTML tag.
The Exploit
Now, let’s take a look at a threat actor that wants to inject malicious web scripts into a post using the plugin’s shortcode. To accomplish this, the attacker needs to leave the specified HTML attribute, which in the example is the “class” attribute and add an additional malicious HTML attribute after.
Here’s an exploit example:[custom_link class='" onmouseover="alert(/XSS/)']Link Text[/custom_link]
With the payload above, the following link will be displayed in the post:
| 1 | <aclass=""onmouseover="alert(/XSS/)"href="#">Link Text</a> |
The first double quotation mark provided in the shortcode’s “class” attribute closes the “class” HTML attribute within the <a> tag. After that the “onmouseover” HTML attribute containing a malicious script is added to the <a> tag. This means that whenever a user mouses over the rendered shortcode, a prompt with “XSS” would appear on the screen.
The Solution
To make the shortcode secure, escape functions must be used. This prevents user-defined input from leaving the original “class” HTML attribute as any quotes used to leave the HTML attribute will be escaped.
Let’s make the example shortcode code secure:
| 123456789101112 | functioncustom_link_shortcode( $atts, $content) { $atts= shortcode_atts( array( 'class'=> 'custom-link', // default class value 'href'=> '#', // default href value ), $atts); $output= '<a class="'. esc_attr( $atts['class'] ) . '" href="'. esc_url( $atts['href'] ) . '">'. $content. '</a>'; return$output;}add_shortcode( 'custom_link', 'custom_link_shortcode'); |
The “class” data is an attribute, so it is recommended to use the esc_attr() function there.
The “href” data is a url, which is an attribute that has more specific requirements, so it is recommended to use the esc_url() function there.
The above two functions make the shortcode completely secure against Cross-Site Scripting.
If the attacker tries to add a malicious shortcode using the patched functionality, it will result in the following link, which no longer contains executable JavaScript:
| 1 | <aclass="" onmouseover="alert(/XSS/)"href="#">Link Text</a> |
Technical Analysis #2
Next, let’s look at an example where shortcode attributes are used as JS variable values.
The vulnerable shortcode function assigns shortcode attributes to JS variables:
| 1234567891011 | functioncustom_js_color_variable_shortcode( $atts) { $atts= shortcode_atts( array( 'color'=> 'red', // default color value ), $atts); $output= '<script>'. 'let color="'. $atts['color'] . '";'. '</script>'; return$output;}add_shortcode( 'custom_js_color_variable', 'custom_js_color_variable_shortcode'); |
Here’s an example where the following shortcode is used in the post content:[custom_js_color_variable color='blue']
As a result, the following script with a variable setting for “color” will be displayed in the post:
| 1 | <script>let color="blue";</script> |
The Exploit
Now, we’ll try to exploit the shortcode:[custom_js_color_variable color='"; alert(/XSS/); let more="']
As a result, the following script will be displayed in the post:
| 1 | <script>let color=""; alert(/XSS/); let more="";</script> |
The Solution
Let’s make the example shortcode code secure:
| 1234567891011 | functioncustom_js_color_variable_shortcode( $atts) { $atts= shortcode_atts( array( 'color'=> 'red', // default color value ), $atts); $output= '<script>'. 'let color="'. esc_js( $atts['color'] ) . '";'. '</script>'; return$output;}add_shortcode( 'custom_js_color_variable', 'custom_js_color_variable_shortcode'); |
The “color” data is a JS variable, so it is recommended to use the esc_js() function.
The following script will be displayed in the post if the attacker tries using the same malicious shortcode:
| 1 | <script>let color=""; alert(/XSS/); let more="";</script> |
Conclusion
In this blog post, we have detailed Stored Shortcode-Based XSS vulnerabilities within several WordPress repository plugins. This vulnerability allows authenticated threat actors with contributor-level permissions or higher to inject malicious web scripts into pages that execute when a user accesses an affected page. As with all XSS vulnerabilities, a malicious payload could be used to perform actions as an administrator, including adding new malicious administrator users to the site and embedding backdoors in plugin and theme files, as well as redirecting users to malicious sites.
We encourage WordPress users to verify that their sites are updated to the latest patched version of each impacted plugin. For unpatched plugins that have been closed by the WordPress.org security team, we recommend that WordPress users delete the affected plugin and look for an alternative solution.
All Wordfence users, including those running Wordfence Premium, Wordfence Care, and Wordfence Response, as well as sites still running the free version of Wordfence, are fully protected against this type of vulnerability.
If you know someone who uses any of these plugins on their site, we recommend sharing this advisory with them to ensure their site remains secure, as this type of vulnerability poses a significant risk.
For security researchers looking to disclose vulnerabilities responsibly and obtain a CVE ID, you can submit your findings to Wordfence Intelligence and potentially earn a spot on our leaderboard.
Did you know that Wordfence has a Bug Bounty Program? We’ve recently increased our bounties by 6.25x until December 20th, 2023, with our bounties for the most critical vulnerabilities reaching $10,000 USD! If you’re an aspiring or current vulnerability researcher, click here to sign up.
Did you enjoy this post? Share it!

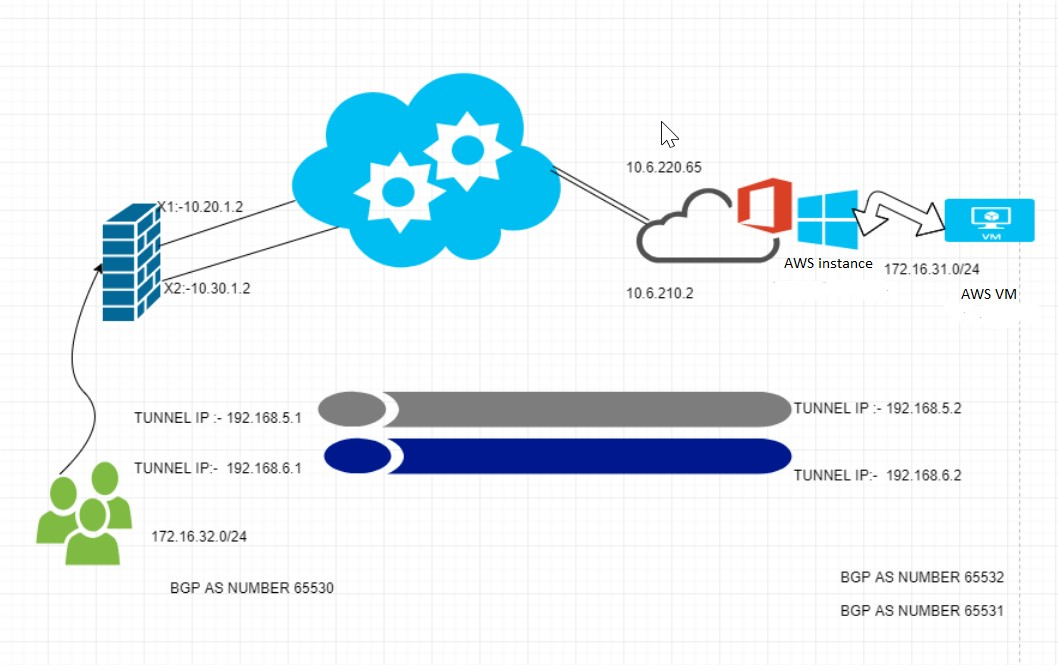
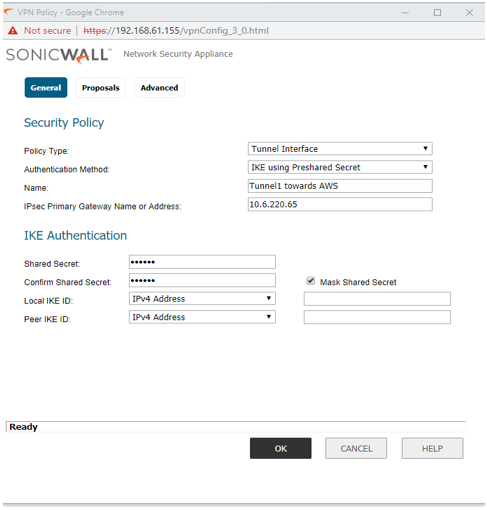
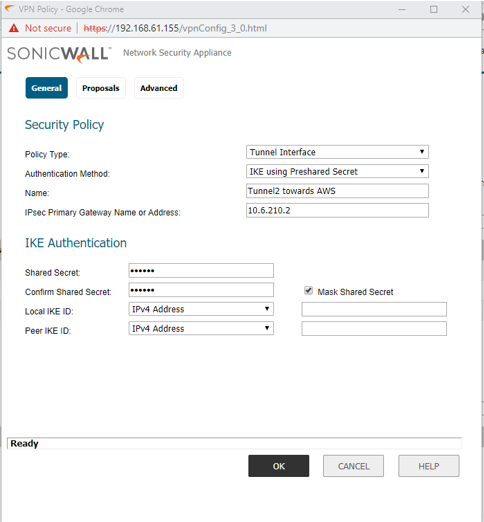
 NOTE: The Proposals tab must be identical on the Tunnel Interface VPNs for both appliances and should Bind with X1 and X2.
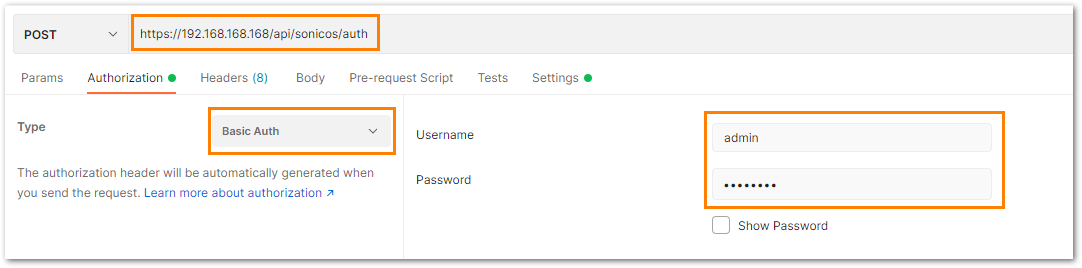
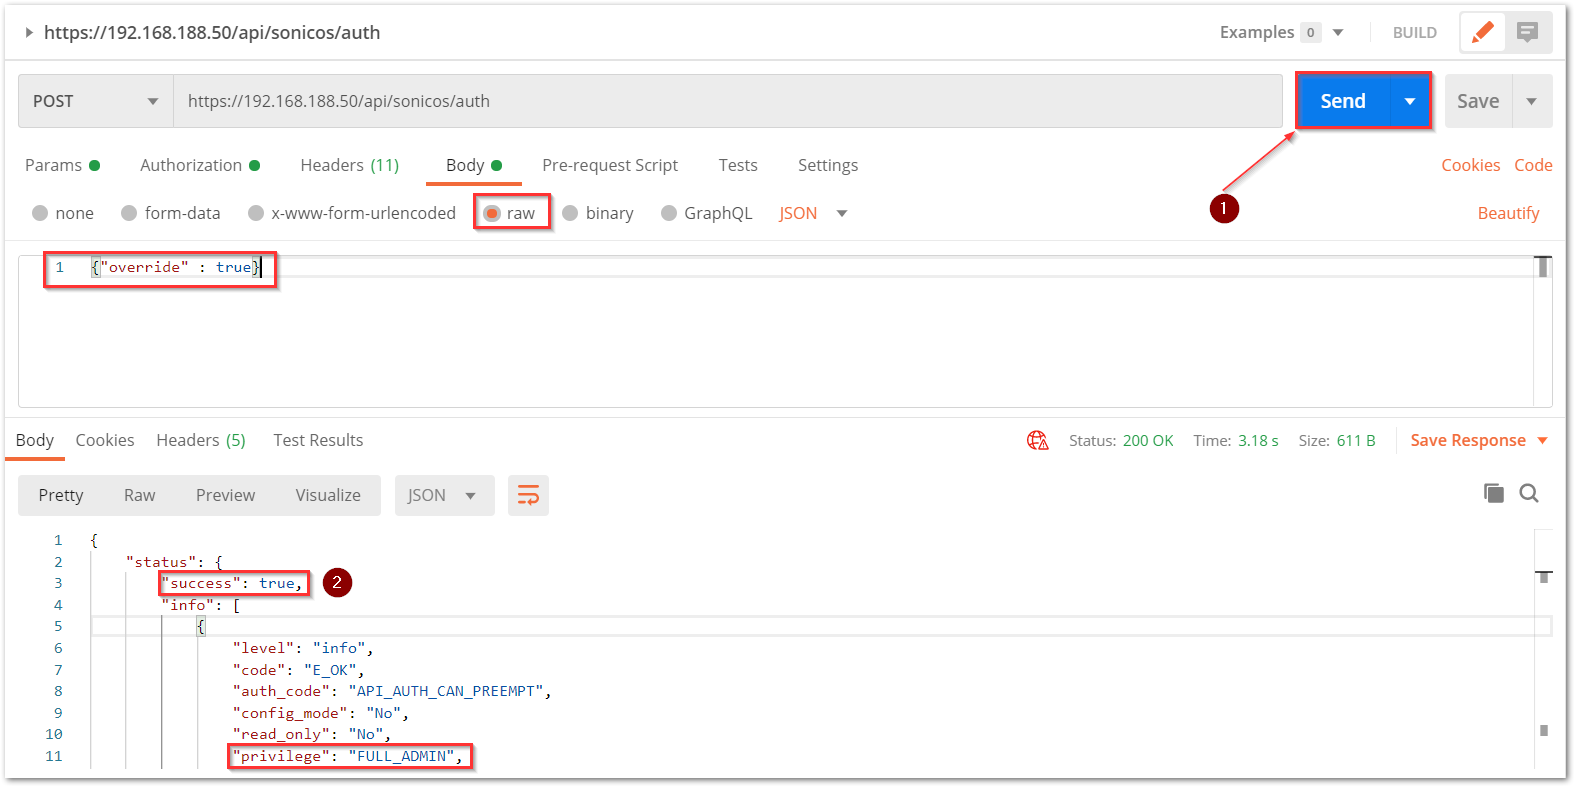
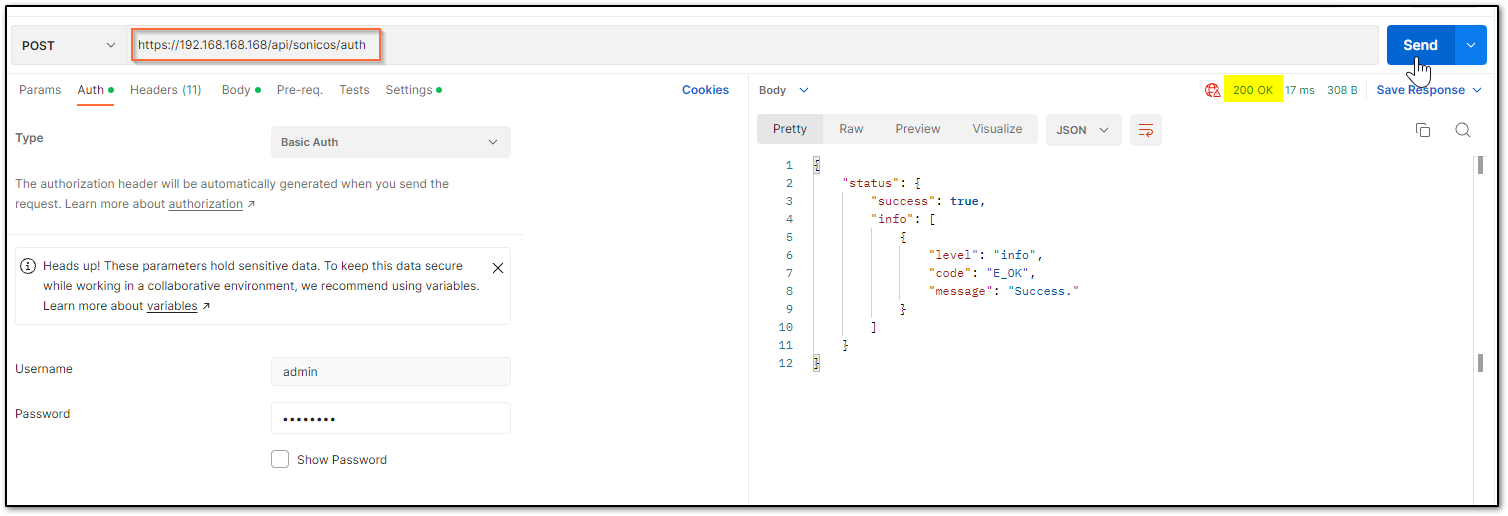
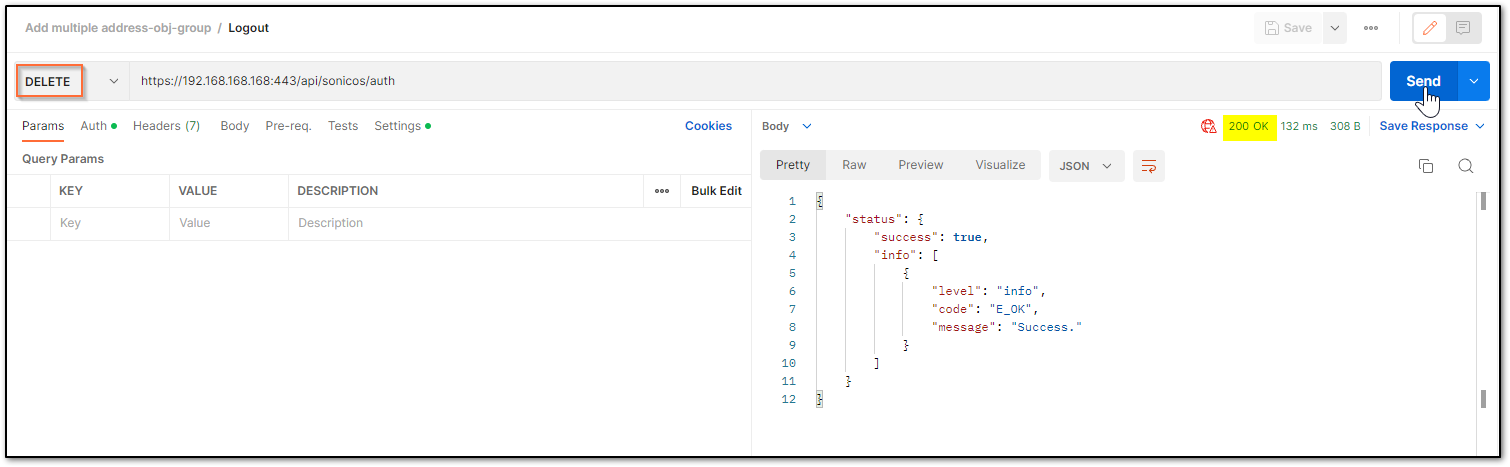
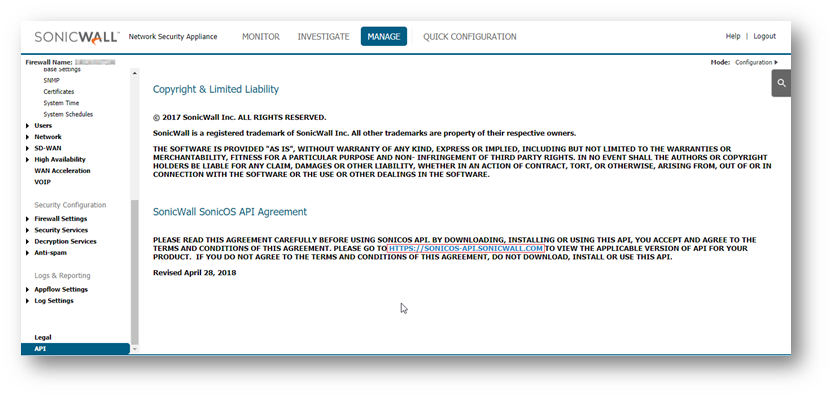
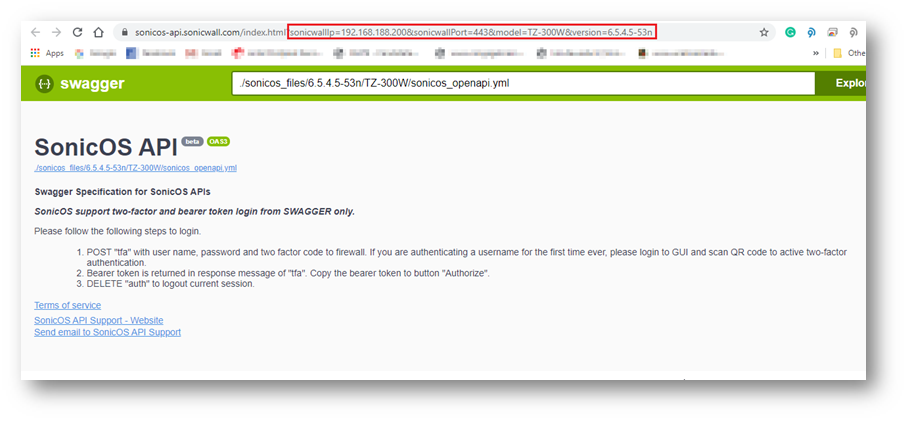
 TIP: You are free to choose Swagger, Postman, Git bash, or any application that allows API calls, if you are using a Linux based operating system you can execute cURL from the terminal. For this article I am using Git bash on Windows.