We break down the basic information of CVE-2023-23397, the zero-day, zero-touch vulnerability that was rated 9.8 on the Common Vulnerability Scoring System (CVSS) scale.
Update as of 03/22/3023 2:50PM PHT: Updated the prevention and mitigation section for an additional step.
CVE-2023-23397 is a critical privilege elevation/authentication bypass vulnerability in Outlook, released as part of the March Patch Tuesday set of fixes. The vulnerability, which affects all versions of Windows Outlook, was given a 9.8 CVSS rating and is one of two zero-day exploits disclosed on March 14. We summarize the points that security teams need to know about this vulnerability and how they can mitigate the risks of this gap.
What is it?
CVE-2023-23397 is an elevation of privilege (EoP) vulnerability in Microsoft Outlook. It is a zero-touch exploit, meaning the security gap requires low complexity to abuse and requires no user interaction.
Figure 1. General exploitation routine of CVE-2023-23397
How is CVE-2023-23397 exploited?
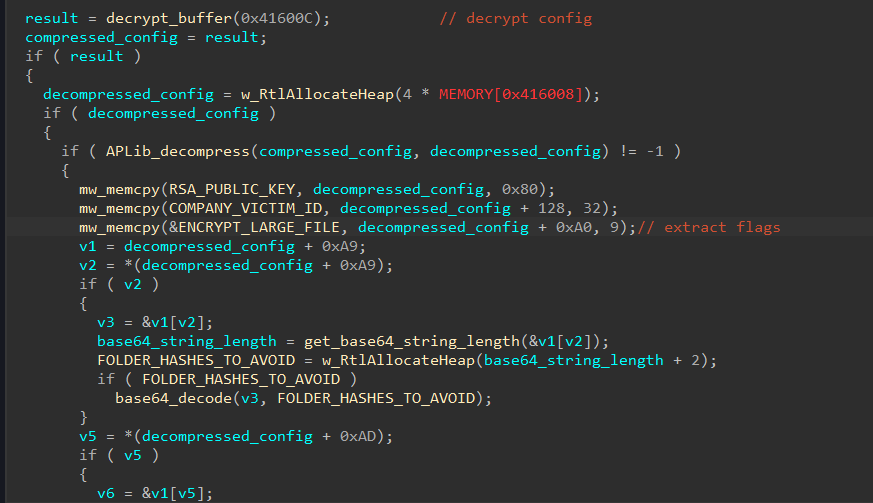
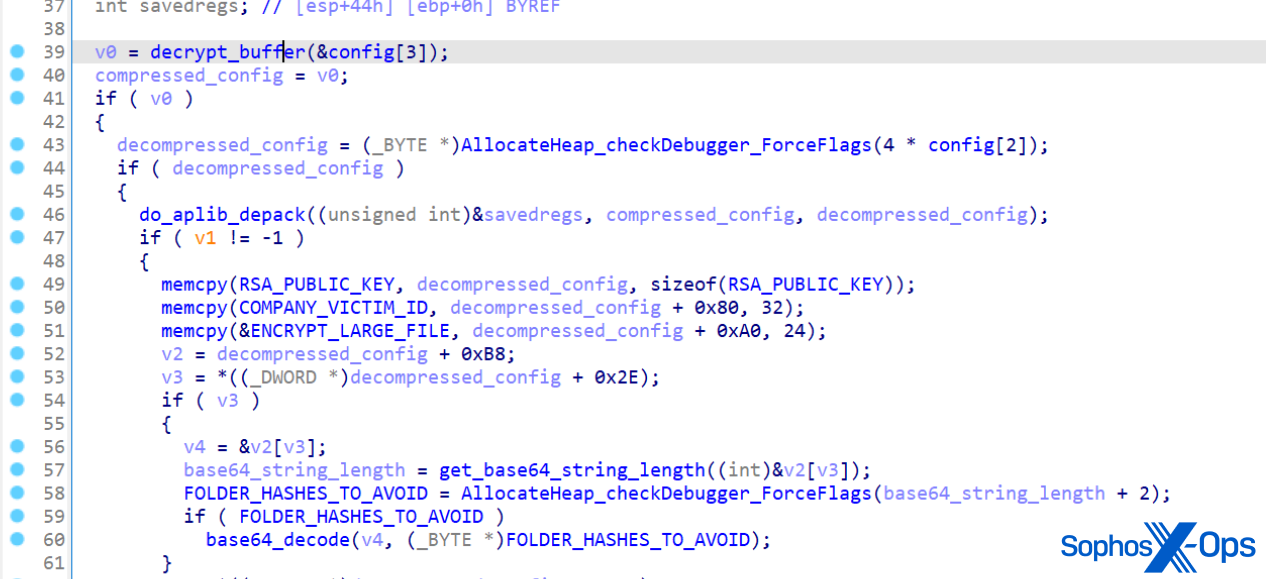
The attacker sends a message to the victim with an extended Message Application Program Interface (MAPI) property with a Universal Naming Convention (UNC) path to a remote attacker-controlled Server Message Block (SMB, via TCP 445). Share-hosted on a server controlled by the attacker, the vulnerability is exploited whether the recipient has seen the message or not. The attacker remotely sends a malicious calendar invite represented by .msg — the message format that supports reminders in Outlook — to trigger the vulnerable API endpoint PlayReminderSound using “PidLidReminderFileParameter” (the custom alert sound option for reminders).
When the victim connects to the attacker’s SMB server, the connection to the remote server sends the user’s New Technology LAN Manager (NTLM) negotiation message automatically, which the attacker can use for authentication against other systems that support NTLM authentication.
NTLMv2 hashes are the latest protocol Windows uses for authentication, and it is used for a number of services with each response containing a hashed representation of users’ information, such as the username and password. As such, threat actors can attempt a NTLM relay attack to gain access to other services, or a full compromise of domains if the compromised users are admins. While online services such as Microsoft 365 are not susceptible to this attack because they do not support NTLM authentication, the Microsoft 365 Windows Outlook app is still vulnerable.
How easy is it to exploit?
User interaction is not necessary to trigger (even before message preview) it, nor does it require high privileges. CVE-2023-23397 is a zero-touch vulnerability that is triggered when the victim client is prompted and notified (e.g., when an appointment or task prompts five minutes before the designated time). It is difficult to block outbound SMB traffic for remote users. The attacker could use the same credentials to gain access to other resources. We elaborate on this example in our webinar (at 04:23 of the video).
Is it in the wild? What versions and operating systems (OS) are affected?
There have been reports of limited attacks abusing this gap. Microsoft has been coordinating with the affected victims to remediate this concern. All supported versions of Microsoft Outlook for Windows are affected. Other versions of Microsoft Outlook, such as Android, iOS, Mac, as well as Outlook on the web and other M365 services, are not affected.
What are the possible attack scenarios?
Figure 2. Beyond the exploit use scenario 1: Data and information theft via NTLM relay attack
1. Lateral movement, malicious navigation using the relayed NTLM hashes
Relay attacks gained notoriety as a use case for Mimikatz using the NTLM credential dumping routine via the sekurlsa module. In addition, pass-the-hat (PtH) (or pass-the hash) attacks and variations of data and information theft can be done. Once attackers are in the system, they can use the network for lateral movement and navigate the organization’s lines over SMB.
Figure 3. Beyond the exploit use scenario 2: WebDAV directory traversal for remote code execution (RCE)
2. WebDAV directory traversal for payload attacker routines
It’s possible for an attacker to leverage WebDAV services in cases where no valid SMB service for Outlook exists (i.e., is not configured) in the client. This is an alternative to the Web/HTTP service that can also be read as a UNC path by .msg and/or Outlook Calendar items. Attackers can set up a malicious WebDAV server to respond to affected victim clients with malicious pages. These pages may contain code that can range from leveraging a directory traversal technique similar to the Microsoft vulnerability CVE-2022-34713 (dubbed as DogWalk) to push any form of payload for remote code execution such as webshells.
What can I do to prevent and mitigate the risk of exploitation of CVE-2023-23397?
Here are some steps that security administrators can perform to reduce the risk of exploitation of CVE-2023-23397:
Apply the vendor patches immediately. Microsoft has released a patch as part of their March 2023 Monthly Security Update.
Block TCP 445/SMB outbound from your network. This will prevent the sending of NTLM authentication messages to remote file shares. If this cannot be done, we recommend monitoring outbound traffic over port 445 for unknown external IP addresses, then identifying and blocking them.
Customers can disable the WebClient service. Note that this will block all WebDAV connections, including intranet.
Add users to the Protected Users Security Group. This prevents the use of NTLM as an authentication mechanism, but note that this could impact applications that rely on NTLM in your environment.
Enforce SMB signing on clients and servers to prevent a relay attack.
Microsoft has provided a PowerShell script as a solution to the issue. The script is designed to scan emails, calendar entries, and task items, and to verify if they have the “PidLidReminderFileParameter” property. By running the script, administrators can locate problematic items that have this property and subsequently remove them or delete them permanently. Download the script here: https://github.com/microsoft/CSS-Exchange/blob/a4c096e8b6e6eddeba2f42910f165681ed64adf7/docs/Security/CVE-2023-23397.md.
Which Trend Micro solutions can address this vulnerability?
Trend Micro Malware Detection Patterns (VSAPI, Predictive Learning, Behavioral Monitoring and Web Reputation Service) for Endpoint, Servers, Mail, and Gateway (e.g., Apex One, Worry-Free Business Security Services, Worry-Free Business Security Standard/Advanced, Deep Security with anti-malware, etc.):
Starting with Trend Micro Smart Scan Pattern version 21474.296.07, known exploits associated with this vulnerability are being detected as Trojan.Win32.CVE202323397.
Trend Micro Vision One: Use this solution as an investigation tool. In the “Search App,” select “Endpoint Activity Data” and enter the following query: – dpt: 445 AND eventSubId: 204 AND processCmd: *OUTLOOK*. This can be saved and added to a watchlist if desired.
Cloud One Workload Security and Deep Security: IPS Rule 1009058, which will need to be changed to Prevent.
TippingPoint Filters:
28471 SMB: SMBv1 Successful Protocol Negotiation
28472 SMB: SMBv2 Successful Protocol Negotiation
Please note: Enabling these filters in Block mode will interrupt legitimate SMB traffic. Customers are advised to add exceptions for their Private IP address space.
If NTLM v1 is configured by default, customers can use this rule to monitor attempts for outgoing NTLM handshakes. Please note this rule only detects and does not block, so it is best used as an investigative tool for follow-up.
Here are three of the worst breaches, attacker tactics and techniques of 2022, and the security controls that can provide effective, enterprise security protection for them.
Ransomware as a service is a type of attack in which the ransomware software and infrastructure are leased out to the attackers. These ransomware services can be purchased on the dark web from other threat actors and ransomware gangs. Common purchasing plans include buying the entire tool, using the existing infrastructure while paying per infection, or letting other attackers perform the service while sharing revenue with them.
In this attack, the threat actor consists of one of the most prevalent ransomware groups, specializing in access via third parties, while the targeted company is a medium-sized retailer with dozens of sites in the United States.
The threat actors used ransomware as a service to breach the victim’s network. They were able to exploit third-party credentials to gain initial access, progress laterally, and ransom the company, all within mere minutes.
The swiftness of this attack was unusual. In most RaaS cases, attackers usually stay in the networks for weeks and months before demanding ransom. What is particularly interesting about this attack is that the company was ransomed in minutes, with no need for discovery or weeks of lateral movement.
A log investigation revealed that the attackers targeted servers that did not exist in this system. As it turns out, the victim was initially breached and ransomed 13 months before this second ransomware attack. Subsequently, the first attacker group monetized the first attack not only through the ransom they obtained, but also by selling the company’s network information to the second ransomware group.
In the 13 months between the two attacks, the victim changed its network and removed servers, but the new attackers were not aware of these architectural modifications. The scripts they developed were designed for the previous network map. This also explains how they were able to attack so quickly – they had plenty of information about the network. The main lesson here is that ransomware attacks can be repeated by different groups, especially if the victim pays well.
“RaaS attacks such as this one are a good example of how full visibility allows for early alerting. A global, converged, cloud-native SASE platform that supports all edges, like Cato Networks provides complete network visibility into network events that are invisible to other providers or may go under the radar as benign events. And, being able to fully contextualize the events allows for early detection and remediation.
#2: The Critical Infrastructure Attack on Radiation Alert Networks#
Attacks on critical infrastructure are becoming more common and more dangerous. Breaches of water supply plants, sewage systems and other such infrastructures could put millions of residents at risk of a human crisis. These infrastructures are also becoming more vulnerable, and attack surface management tools for OSINT like Shodan and Censys allow security teams to find such vulnerabilities with ease.
In 2021, two hackers were suspected of targeting radiation alert networks. Their attack relied on two insiders that worked for a third party. These insiders disabled the radiation alert systems, significantly debilitating their ability to monitor radiation attacks. The attackers were then able to delete critical software and disable radiation gauges (which is part of the infrastructure itself).
“Unfortunately, scanning for vulnerable systems in critical infrastructure is easier than ever. While many such organizations have multiple layers of security, they are still using point solutions to try and defend their infrastructure rather than one system that can look holistically at the full attack lifecycle. Breaches are never just a phishing problem, or a credentials problem, or a vulnerable system problem – they are always a combination of multiple compromises performed by the threat actor,” said Etay Maor, Sr. Director of Security Strategy at Cato Networks.
#3: The Three-Step Ransomware Attack That Started with Phishing#
The third attack is also a ransomware attack. This time, it consisted of three steps:
1. Infiltration – The attacker was able to gain access to the network through a phishing attack. The victim clicked on a link that generated a connection to an external site, which resulted in the download of the payload.
2. Network activity – In the second phase, the attacker progressed laterally in the network for two weeks. During this time, it collected admin passwords and used in-memory fileless malware. Then on New Year’s Eve, it performed the encryption. This date was chosen since it was (rightfully) assumed the security team would be off on vacation.
3. Exfiltration – Finally, the attackers uploaded the data out of the network.
In addition to these three main steps, additional sub-techniques were employed during the attack and the victim’s point security solutions were not able to block this attack.
“A multiple choke point approach, one that looks horizontally (so to speak) at the attack rather than as a set of vertical, disjointed issues, is the way to enhance detection, mitigation and prevention of such threats. Opposed to popular belief, the attacker needs to be right many times and the defenders only need to be right just once. The underlying technologies to implement a multiple choke point approach are full network visibility via a cloud-native backbone, and a single pass security stack that’s based on ZTNA.” said Etay Maor, Sr. Director of Security Strategy at Cato Networks.
It is common for security professionals to succumb to the “single point of failure fallacy”. However, cyber-attacks are sophisticated events that rarely involve just one tactic or technique which is the cause of the breach. Therefore, an all-encompassing outlook is required to successfully mitigate cyber-attacks. Security point solutions are a solution for single points of failure. These tools can identify risks, but they will not connect the dots, which could and has led to a breach.
According to ongoing security research conducted by Cato Networks Security Team, they have identified two additional vulnerabilities and exploit attempts that they recommend including in your upcoming security plans:
While Log4j made its debut as early as December of 2021, the noise its making hasn’t died down. Log4j is still being used by attackers to exploit systems, as not all organizations have been able to patch their Log4j vulnerabilities or detect Log4j attacks, in what is known as “virtual patching”. They recommend prioritizing Log4j mitigation.
Security solutions like firewalls and VPNs have become access points for attackers. Patching them has become increasingly difficult, especially in the era of architecture cloudification and remote work. It is recommended to pay close attention to these components as they are increasingly vulnerable.
How to Minimize Your Attack Surface and Gain Visibility into the Network#
To reduce the attack surface, security professionals need visibility into their networks. Visibility relies on three pillars:
Actionable information – that can be used to mitigate attacks
Reliable information – that minimizes the number of false positives
Timely information – to ensure mitigation happens before the attack has an impact
Once an organization has complete visibility to the activity on their network they can contextualize the data, decide whether the activity witnessed should be allowed, denied, monitored, restricted (or any other action) and then have the ability to enforce this decision. All these elements must be applied to every entity, be it a user, device, cloud app etc. All the time everywhere. That is what SASE is all about.
Found this article interesting? Follow us on Twitter and LinkedIn to read more exclusive content we post.
Multiple vulnerabilities in VMware ESXi and vSphere Client (HTML5) were privately reported to VMware. Updates are available to remediate these vulnerabilities in affected VMware products.
3a. VMware vCenter Server updates address remote code execution vulnerability in the vSphere Client (CVE-2021-21972)
Description
The vSphere Client (HTML5) contains a remote code execution vulnerability in a vCenter Server plugin. VMware has evaluated the severity of this issue to be in the Critical severity range with a maximum CVSSv3 base score of 9.8.
Known Attack Vectors
A malicious actor with network access to port 443 may exploit this issue to execute commands with unrestricted privileges on the underlying operating system that hosts vCenter Server.
Resolution
To remediate CVE-2021-21972 apply the updates listed in the ‘Fixed Version’ column of the ‘Response Matrix’ below to affected deployments.
Workarounds
Workarounds for CVE-2021-21972 have been listed in the ‘Workarounds’ column of the ‘Response Matrix’ below.
Additional Documentation
None.
Notes
The affected vCenter Server plugin for vROPs is available in all default installations. vROPs does not need be present to have this endpoint available. Follow the workarounds KB to disable it.
Acknowledgements
VMware would like to thank Mikhail Klyuchnikov of Positive Technologies for reporting this issue to us.
OpenSLP as used in ESXi has a heap-overflow vulnerability. VMware has evaluated the severity of this issue to be in the Important severity range with a maximum CVSSv3 base score of 8.8.
Known Attack Vectors
A malicious actor residing within the same network segment as ESXi who has access to port 427 may be able to trigger the heap-overflow issue in OpenSLP service resulting in remote code execution.
Resolution
To remediate CVE-2021-21974 apply the updates listed in the ‘Fixed Version’ column of the ‘Response Matrix’ below to affected deployments.
Workarounds
Workarounds for CVE-2021-21974 have been listed in the ‘Workarounds’ column of the ‘Response Matrix’ below.
3c. VMware vCenter Server updates address SSRF vulnerability in the vSphere Client (CVE-2021-21973)
Description
The vSphere Client (HTML5) contains an SSRF (Server Side Request Forgery) vulnerability due to improper validation of URLs in a vCenter Server plugin. VMware has evaluated the severity of this issue to be in the Moderate severity range with a maximum CVSSv3 base score of 5.3.
Known Attack Vectors
A malicious actor with network access to port 443 may exploit this issue by sending a POST request to vCenter Server plugin leading to information disclosure.
Resolution
To remediate CVE-2021-21973 apply the updates listed in the ‘Fixed Version’ column of the ‘Response Matrix’ below to affected deployments.
Workarounds
Workarounds for CVE-2021-21973 have been listed in the ‘Workarounds’ column of the ‘Response Matrix’ below.
Additional Documentation
None.
Notes
The affected vCenter Server plugin for vROPs is available in all default installations. vROPs does not need be present to have this endpoint available. Follow the workarounds KB to disable it.
Acknowledgements
VMware would like to thank Mikhail Klyuchnikov of Positive Technologies for reporting this issue to us.
Any organization that handles sensitive data must be diligent in its security efforts, which include regular pen testing. Even a small data breach can result in significant damage to an organization’s reputation and bottom line.
There are two main reasons why regular pen testing is necessary for secure web application development:
Security: Web applications are constantly evolving, and new vulnerabilities are being discovered all the time. Pen testing helps identify vulnerabilities that could be exploited by hackers and allows you to fix them before they can do any damage.
Compliance: Depending on your industry and the type of data you handle, you may be required to comply with certain security standards (e.g., PCI DSS, NIST, HIPAA). Regular pen testing can help you verify that your web applications meet these standards and avoid penalties for non-compliance.
Many organizations, big and small, have once a year pen testing cycle. But what’s the best frequency for pen testing? Is once a year enough, or do you need to be more frequent?
The answer depends on several factors, including the type of development cycle you have, the criticality of your web applications, and the industry you’re in.
Agile development cycles are characterized by short release cycles and rapid iterations. This can make it difficult to keep track of changes made to the codebase and makes it more likely that security vulnerabilities will be introduced.
If you’re only testing once a year, there’s a good chance that vulnerabilities will go undetected for long periods of time. This could leave your organization open to attack.
To mitigate this risk, pen testing cycles should align with the organization’s development cycle. For static web applications, testing every 4-6 months should be sufficient. But for web applications that are updated frequently, you may need to test more often, such as monthly or even weekly.
Any system that is essential to your organization’s operations should be given extra attention when it comes to security. This is because a breach of these systems could have a devastating impact on your business. If your organization relies heavily on its web applications to do business, any downtime could result in significant financial losses.
For example, imagine that your organization’s e-commerce site went down for an hour due to a DDoS attack. Not only would you lose out on potential sales, but you would also have to deal with the cost of the attack and the negative publicity.
To avoid this scenario, it’s important to ensure that your web applications are always available and secure.
Non-critical web applications can usually get away with being tested once a year, but business-critical web applications should be tested more frequently to ensure they are not at risk of a major outage or data loss.
If all your web applications are internal, you may be able to get away with pen testing less frequently. However, if your web applications are accessible to the public, you must be extra diligent in your security efforts.
Web applications accessible to external traffic are more likely to be targeted by attackers. This is because there is a greater pool of attack vectors and more potential entry points for an attacker to exploit.
Customer-facing web applications also tend to have more users, which means that any security vulnerabilities will be exploited more quickly. For example, a cross-site scripting (XSS) vulnerability in an external web application with millions of users could be exploited within hours of being discovered.
To protect against these threats, it’s important to pen test customer-facing web applications more frequently than internal ones. Depending on the size and complexity of the application, you may need to pen test every month or even every week.
Certain industries are more likely to be targeted by hackers due to the sensitive nature of their data. Healthcare organizations, for example, are often targeted because of the protected health information (PHI) they hold.
If your organization is in a high-risk industry, you should consider conducting pen testing more frequently to ensure that your systems are secure and meet regulatory compliance. This will help protect your data and reduce the chances of a costly security incident.
You Don’t Have Internal Security Operations or a Pen testing Team#
This might sound counterintuitive, but if you don’t have an internal security team, you may need to conduct pen testing more frequently.
Organizations that don’t have dedicated security staff are more likely to be vulnerable to attacks.
Without an internal security team, you will need to rely on external pen testers to assess your organization’s security posture.
Depending on the size and complexity of your organization, you may need to pen test every month or even every week.
During a merger or acquisition, there is often a lot of confusion and chaos. This can make it difficult to keep track of all the systems and data that need to be secured. As a result, it’s important to conduct pen testing more frequently during these times to ensure that all systems are secure.
M&A also means that you are adding new web applications to your organization’s infrastructure. These new applications may have unknown security vulnerabilities that could put your entire organization at risk.
In 2016, Marriott acquired Starwood without being aware that hackers had exploited a flaw in Starwood’s reservation system two years earlier. Over 500 million customer records were compromised. This placed Marriott in hot water with the British watchdog ICO, resulting in 18.4 million pounds in fines in the UK. According to Bloomberg, there is more trouble ahead, as the hotel giant could “face up to $1 billion in regulatory fines and litigation costs.”
To protect against these threats, it’s important to conduct pen testing before and after an acquisition. This will help you identify potential security issues so they can be fixed before the transition is complete.
While periodic pen testing is important, it is no longer enough in today’s world. As businesses rely more on their web applications, continuous pen testing becomes increasingly important.
There are two main types of pen testing: time-boxed and continuous.
Traditional pen testing is done on a set schedule, such as once a year. This type of pen testing is no longer enough in today’s world, as businesses rely more on their web applications.
Continuous pen testing is the process of continuously scanning your systems for vulnerabilities. This allows you to identify and fix vulnerabilities before they can be exploited by attackers. Continuous pen testing allows you to find and fix security issues as they happen instead of waiting for a periodic assessment.
Continuous pen testing is especially important for organizations that have an agile development cycle. Since new code is deployed frequently, there is a greater chance for security vulnerabilities to be introduced.
Pen testing as a service models is where continuous pen testing shine. Outpost24’s PTaaS (Penetration-Testing-as-a-Service) platform enables businesses to conduct continuous pen testing with ease. The Outpost24 platform is always up-to-date with an organization’s latest security threats and vulnerabilities, so you can be confident that your web applications are secure.
Manual and automated pen testing: Outpost24’s PTaaS platform combines manual and automated pen testing to give you the best of both worlds. This means you can find and fix vulnerabilities faster while still getting the benefits of expert analysis.
Provides comprehensive coverage: Outpost24’s platform covers all OWASP Top 10 vulnerabilities and more. This means that you can be confident that your web applications are secure against the latest threats.
Is cost-effective: With Outpost24, you only pay for the services you need. This makes it more affordable to conduct continuous pen testing, even for small businesses.
Regular pen testing is essential for secure web application development. Depending on your organization’s size, industry, and development cycle, you may need to revise your pen testing schedule.
Once-a-year pen testing cycle may be enough for some organizations, but for most, it is not. For business-critical, customer-facing, or high-traffic web applications, you should consider continuous pen testing.
Outpost24’s PTaaS platform makes it easy and cost-effective to conduct continuous pen testing. Contact us today to learn more about our platform and how we can help you secure your web applications.
Found this article interesting? Follow us on Twitter and LinkedIn to read more exclusive content we post.
The latest version of SonicOS firmware provides support for a wide variety of USB and Hotspot devices and wireless service providers as listed below.
Resolution
Broadband Devices
USA & Canada
Gen7
5G/4G/LTE
SonicOS 7.0
CARD REGION
OPERATOR
NAME
GENERATION
TYPE
SONICOS VERSION
SONICWAVE
USA
AT&T
Nighthawk 5G Mobile Hotspot Pro MR 5100
5G
Hotspot
7.0.1
No
USA
AT&T
NightHawk LTE MR1100
4G/LTE
Hotspot
7.0.0
No
USA
AT&T
Global Modem USB800
4G/LTE
USB
7.0.1
Yes
USA
AT&T
iPhone 11 Pro
4G/LTE
Hotspot
7.0.0
No
USA
AT&T
iPhone 12 Pro
4G/LTE
Hotspot
7.0.1
No
USA
Verizon
M2100
5G
Hotspot
7.0.1
Yes
USA
Verizon
M1000
5G
Hotspot
7.0.0
Yes
USA
Verizon
Orbic Speed
4G/LTE
Hotspot
7.0.0
No
USA
Verizon
MiFi Global U620L
4G/LTE
USB
7.0.0
Yes
USA
Sprint
Netstick
4G/LTE
USB
7.0.0
No
USA
Sprint
Franklin U772
4G/LTE
USB
7.0.0
No
USA
T-Mobile
M2000
4G/LTE
Hotspot
7.0.1
No
USA
T-Mobile
Link Zone2
4G/LTE
Hotspot
7.0.0
Yes
Gen6/Gen6.5
4G/LTE
SonicOS 6.x
CARD REGION
OPERATOR
NAME
GENERATION
TYPE
SONICOS VERSION
SONICWAVE
USA
AT&T
Global Modem USB800
4G/LTE
USB
6.5.4.5
Yes
USA
AT&T
Velocity (ZTE MF861)
4G/LTE
USB
6.5.3.1
Yes
USA
AT&T
Beam (Netgear AC340U)²
4G/LTE
USB
5.9.0.1
Yes
USA
AT&T
Momentum (Sierra Wireless 313U)
4G/LTE
USB
5.9.0.0
Yes
USA
Verizon
MiFi Global U620L
4G/LTE
USB
6.5.0.0
Yes
USA
Verizon
Novatel 551L
4G/LTE
USB
6.2.4.2
Yes
USA
Verizon
Pantech UML290
4G/LTE
USB
5.9.0.0
No
USA
Sprint
Franklin U772
4G/LTE
USB
6.5.3.1
No
USA
Sprint
Netgear 341U
4G/LTE
USB
6.2.2.0
Yes
Canada
Rogers
AirCard (Sierra Wireless 330U)
4G/LTE
USB
5.9.0.0
No
Gen5
3G
SonicOS 5.x
USA
AT&T
Velocity (Option GI0461)
3G
USB
5.8.1.1
No
USA
AT&T
Mercury (Sierra Wireless C885)
3G
USB
5.3.0.1
No
USA
Verizon
Pantech UMW190
3G
USB
5.9.0.0
No
USA
Verizon
Novatel USB760
3G
USB
5.3.0.1
No
USA
Verizon
Novatel 727
3G
USB
5.3.0.1
No
USA
Sprint
Novatel U760
3G
USB
5.3.0.1
No
USA
Sprint
Novatel 727U
3G
USB
5.3.0.1
No
USA
Sprint
Sierra Wireless 598U
3G
USB
5.8.1.1
No
USA
T-Mobile
Rocket 3.0 (ZTE MF683)
3G
USB
5.9.0.0
Yes
Canada
Bell
Novatel 760
3G
USB
5.3.1.0
No
International
Gen7
5G/4G/LTE
SonicOS 7.0
CARD REGION
Manufacturer
NAME
GENERATION
TYPE
SONICOS VERSION
SONICWAVE
Worldwide
Huawei
E6878-870
5G
Hotspot
7.0.0
No
Worldwide
Huawei
E8372H**
4G/LTE
USB
7.0.0
No
Worldwide
Huawei
E8201
4G/LTE
USB
7.0.0
No
Worldwide
Huawei
E3372
4G/LTE
USB
7.0.0
No
Worldwide
ZTE
MF833U
4G/LTE
USB
7.0.0
Yes
Worldwide
ZTE
MF825C
4G/LTE
USB
7.0.0
Yes
Worldwide
ZTE
MF79S
4G/LTE
USB
7.0.0
Yes
Gen6/Gen6.5
4G/LTE
SonicOS 6.x
CARD REGION
Manufacturer
NAME
GENERATION
TYPE
SONICOS VERSION
SONICWAVE
Worldwide
Huawei
E8372 (Telstra 4GX)
4G/LTE
USB
6.5.3.1
Yes
Worldwide
Huawei
E3372
4G/LTE
USB
6.5.3.1
Yes
Worldwide
Huawei
E3372h (-608 variant) 6
4G/LTE
USB
6.5.3.1
Yes
Worldwide
Huawei
E3372s (-608 variant) 6
4G/LTE
USB
6.5.3.1
Yes
Worldwide
Huawei
E398 (Kyocera 5005)
4G/LTE
USB
5.9.0.2
Yes
Worldwide
Huawei
E3276s
4G/LTE
USB
No
Yes
Worldwide
D-Link
DWM-221
4G/LTE
USB
6.5.3.1
Yes
Worldwide
D-Link
DWM-222 A1
4G/LTE
USB
6.5.3.1
Yes
Worldwide
ZTE
MF825
4G/LTE
USB
6.5.3.1
Yes
Worldwide
ZTE
MF832G
4G/LTE
USB
No
Yes
Worldwide
ZTE
MF79S
4G/LTE
USB
No
Yes
Gen5
3G
SonicOS 5.x
Worldwide
Huawei
E353 7
3G
USB
5.9.0.2
Yes
Worldwide
Huawei
K4605
3G
USB
5.9.0.2
Yes
Worldwide
Huawei
EC169C
3G
USB
5.9.0.7
No
Worldwide
Huawei
E180
3G
USB
5.9.0.1
No
Worldwide
Huawei
E182
3G
USB
5.9.0.0
No
Worldwide
Huawei
K3715
3G
USB
5.9.0.0
No
Worldwide
Huawei
E1750
3G
USB
5.8.0.2
No
Worldwide
Huawei
E176G
3G
USB
5.3.0.1
No
Worldwide
Huawei
E220
3G
USB
5.3.0.1
No
Worldwide
Huawei
EC122
3G
USB
5.9.0.0
No
LTE Cellular Extender
SonicOS 6.x
Worldwide
Accelerated
6300-CX LTE router
4G/LTE
SIM
6.5.0.0
No
¹ Cellular network operators around the world are announcing their plans to discontinue 3G services starting as early as December 2020. Therefore LTE or 5G WWAN devices should be used for new deployments. Existing deployments with 3G should be upgraded soon to LTE or 5G in preparation for the imminent discontinuation of 3G services. ² Refer to AT&T 340U article for more info ³ Multiple variations of the Huawei card: E8371h-153, E8372h-155, & E8372h-510 ⁴ Huawei Modem 3372h and 3372s have been released by Huawei in multiple variants (i.e. -608, -153, -607, -517, -511) and with different protocols. At the moment, SonicOS does not support Huawei Proprietary protocol so all the variants using a non-standard or proprietary protocol are not supported or require the ISP to provide a PPP APN Type. ⁵ Huawei Modem E353 is not compatible with SOHO 250. Also note that it is not an LTE card 6 For customers outside of the 90-day warranty support period, an active SonicWall 8×5 or 24×7 Dynamic Support agreement allows you to keep your network security up-to-date by providing access to the latest firmware updates. You can manage all services including Dynamic Support and firmware downloads on any of your registered appliances at mysonicwall.com.
This article describes the steps involved in creating Polices using SonicOS APIs that will let you access internal devices or servers behind the SonicWall firewall.
Cause
SonicWall by default does not allow inbound traffic which not a part of a session that was initiated by an internal device on the network. This is done to protect the devices in the internal network from malicious access. If required certain parts of the network can be opened to external access, for example Webservers, Exchange servers and so on.
To open the network, we need to specify an access rule from the external network to the internal network and a NAT Policy so we direct traffic only to the intended device.
With APIs this can be achieved on scale for example you can create multiple Access Rules and NAT policies with one command and all the attributes can be specified into Json Objects.
Resolution
Manually opening Ports / enabling Port forwarding to allow traffic from the Internet to a Server behind the SonicWall using sonicos API involves the following steps:
Step1: Enabling the API Module.
Step2:Getting into Swagger.
Step3:Login to the SonicWall with API.
Step4:Create Address Objects and Service Objects with API.
Step5:Creating NAT Policy with API.
Step6: Creating Access Rules with API.
Step7:Committing all the configurational changes made with APIs.
Step8: Log out the SonicWall with API:
Scenario Overview
The following walk-through details allowing TCP 3389 From the Internet to a Terminal Server on the Local Network.Once the configuration is complete, Internet Users can RDP into the Terminal Server using the WAN IP address.Although the examples below show the LAN Zone and TCP 3389 they can apply to any Zone and any Port that is required.
Click on the Link https://sonicos-api.sonicwall.com
Swagger will prepopulate your SonicWalls’s IP, MGMT Port, Firmware so it can give you a list of applicable APIs.
NOTE: All the APIs required for configuring Port Forwarding will be listed in this Article.
Step3:Login to the SonicWall with API:
curl -k -i -u “admin:password” -X POST https://192.168.168.168:443/api/sonicos/auth
“admin:password” – Replace this with your SonicWalls username : password
https://192.168.168.168:443/– Replace this with your SonicWalls Public or private IP address
Command Output should contain a string: “success”: true
NOTE: You are free to choose Swagger, Postman, Git bash or any application that allows API calls, if you are using a Linux based operating system you can execute cURL from the terminal.For this article I am using Git bash on Windows.
Step4:Create Address Objects and Service Objects with API:
curl -k -i -X POST “https://192.168.168.168:443/api/sonicos/address-objects/ipv4” -H “accept: application/Json” -H “Content-Type: application/Json” -d “{\”address_object\”:{\”ipv4\”:{\”name\”:\”Term Server Private\”,\”zone\”:\”LAN\”,\”host\”:{\”ip\”:\”192.168.168.10\”}}}}” && curl -k -i -X POST “https://192.168.168.168:443/api/sonicos/address-objects/ipv4” -H “accept: application/Json” -H “Content-Type: application/Json” -d “{\”address_object\”:{\”ipv4\”:{\”name\”:\”Term Server Public\”,\”zone\”:\”WAN\”,\”host\”:{\”ip\”:\”1.1.1.1\”}}}}”
Output of the First command where we have parsed the address object data on the command instead of creating a separate File:
Output of the second Command where we have used a file called @add instead of specifying data on the command:
TIP: If you are creating only one Address Object then the First command should be sufficient, if you are creating multiple address objects then the second command should be used.
CAUTION: I have the add.Json file saved on to my desktop and hence I was able to call it into the command, if you have created the Json the file in a different location then make sure you are executing the command from that location.
https://192.168.168.168:443 – Replace that with the IP of the SonicWall
@serviceobj.Json is a file that contains the Attributes of the service object:
{
“service_object”: {
“name”: “Terminal Server 3389”,
“TCP”: {
“begin”: 3389,
“end”: 3389
}
}
}
Output of the command:
3. Committing the changes made to the SonicWall: We need to do this to be able to use the Address Objects and service objects that we just created to make a NAT Policy and an Access Rule.
curl -k -X POST “https://192.168.168.168:443/api/sonicos/config/pending” -H “accept: application/Json”
https://192.168.168.168:443 – Replace that with the IP of the SonicWall
https://192.168.168.168:443 – Replace that with the IP of the SonicWall
@accessrule.Json is a file that contains the Attributes of the access rule:
{
“access_rules”: [
{
“ipv4”: {
“name”: “Inbound 3389”,
“enable”: true,
“from”: “WAN”,
“to”: “LAN”,
“action”: “allow”,
“source”: {
“address”: {
“any”: true
},
“port”: {
“any”: true
}
},
“service”: {
“name”: “Terminal Server 3389”
},
“destination”: {
“address”: {
“name”: “Term Server Public”
}
}
}
}
]
}
Output of the command:
Step7: Committing all the configurational changes made with APIs:
1. We have already committed Address objects and Service Objects in Step 4, In this step we are committing the NAT Policy and the Access Rule to the SonicWalls configuration:
curl -k -X POST “https://192.168.168.168:443/api/sonicos/config/pending” -H “accept: application/Json”
https://192.168.168.168:443 – Replace that with the IP of the SonicWall
We have Only used the POST method in most of the API calls for this Article because we are only Adding things into the configuration, there are other methods Like GET,DELETE,PUT and etc. I recommend that you go through https://sonicos-api.sonicwall.com for more API commands.
Step8: Log out the SonicWall with API:
1. It is recommended to log out from the SonicWall via API once the desired configuration is committed.
https://192.168.168.168:443 – Replace that with the IP of the SonicWall
“admin:password” – is the actual username and password for the SonicWall.
Output of the command:
CAUTION: Caution: If you miss to perform the action in Step 7 and Execute the command in Step 8 you will lose all the configuration changes made in the current session.
Summary:We have successfully configured a Port Forwarding for a user in the Internet to access a Term Server that is behind a Firewall on port 3389 using sonicos API.
NOTE: It is always recommended to use Client VPN for RDP connections this article here is just an example.
FQDN: cloudgmsams.sonicwall.com Zero Touch FQDN: cloudttams.global.sonicwall.com IP: 213.244.188.168, 213.244.188.188
For AWS-FRA Colo
FQDN: cscmafra.sonicwall.com Zero Touch FQDN: cscmafratt.global.sonicwall.com, cscmafratta.global.sonicwall.com IP: 18.197.234.66, 18.197.234.59
SonicWall NSM:
For Oregon AWS Colo
FQDN: nsm-uswest.sonicwall.com (Use it in GMS settings under Administration Page) Zero Touch FQDN: nsm-uswest-zt.sonicwall.com (Use it in ZeroTouch Settings under Diag page) IP: 13.227.130.81, 13.227.130.63, 3.227.130.69, 13.227.130.12, 52.39.29.75, 44.233.105.101, 44.227.248.206
For AWS-FRA Colo
FQDN: nsm-eucentral.sonicwall.com (Use it in GMS settings under Administration Page) Zero Touch FQDN: nsm-eucentral-zt.sonicwall.com (Use it in ZeroTouch Settings under Diag page) IP: 13.227.130.70, 13.227.130.69, 13.227.130.15, 13.227.130.92, 18.156.16.24, 18.157.240.148, 3.127.176.56
The Border Gateway Protocol (BGP) is the glue that keeps the entire Internet together. However, despite its vital function, BGP wasn’t originally designed to protect against malicious actors or routing mishaps. It has since been updated to account for this shortcoming with the Resource Public Key Infrastructure (RPKI) framework, but can we declare it to be safe yet?
If the question needs asking, you might suspect we can’t. There is a shortage of reliable data on how much of the Internet is protected from preventable routing problems. Today, we’re releasing a new method to measure exactly that: what percentage of Internet users are protected by their Internet Service Provider from these issues. We find that there is a long way to go before the Internet is protected from routing problems, though it varies dramatically by country.
Why RPKI is necessary to secure Internet routing
The Internet is a network of independently-managed networks, called Autonomous Systems (ASes). To achieve global reachability, ASes interconnect with each other and determine the feasible paths to a given destination IP address by exchanging routing information using BGP. BGP enables routers with only local network visibility to construct end-to-end paths based on the arbitrary preferences of each administrative entity that operates that equipment. Typically, Internet traffic between a user and a destination traverses multiple AS networks using paths constructed by BGP routers.
BGP, however, lacks built-in security mechanisms to protect the integrity of the exchanged routing information and to provide authentication and authorization of the advertised IP address space. Because of this, AS operators must implicitly trust that the routing information exchanged through BGP is accurate. As a result, the Internet is vulnerable to the injection of bogus routing information, which cannot be mitigated by security measures at the client or server level of the network.
An adversary with access to a BGP router can inject fraudulent routes into the routing system, which can be used to execute an array of attacks, including:
Denial-of-Service (DoS) through traffic blackholing or redirection,
Impersonation attacks to eavesdrop on communications,
Machine-in-the-Middle exploits to modify the exchanged data, and subvert reputation-based filtering systems.
Additionally, local misconfigurations and fat-finger errors can be propagated well beyond the source of the error and cause major disruption across the Internet.
Such an incident happened on June 24, 2019. Millions of users were unable to access Cloudflare address space when a regional ISP in Pennsylvania accidentally advertised routes to Cloudflare through their capacity-limited network. This was effectively the Internet equivalent of routing an entire freeway through a neighborhood street.
The most prominent proposals to secure BGP routing, standardized by the IETF focus on validating the origin of the advertised routes using Resource Public Key Infrastructure (RPKI) and verifying the integrity of the paths with BGPsec. Specifically, RPKI (defined in RFC 7115) relies on a Public Key Infrastructure to validate that an AS advertising a route to a destination (an IP address space) is the legitimate owner of those IP addresses.
RPKI has been defined for a long time but lacks adoption. It requires network operators to cryptographically sign their prefixes, and routing networks to perform an RPKI Route Origin Validation (ROV) on their routers. This is a two-step operation that requires coordination and participation from many actors to be effective.
The two phases of RPKI adoption: signing origins and validating origins
RPKI has two phases of deployment: first, an AS that wants to protect its own IP prefixes can cryptographically sign Route Origin Authorization (ROA) records thereby attesting to be the legitimate origin of that signed IP space. Second, an AS can avoid selecting invalid routes by performing Route Origin Validation (ROV, defined in RFC 6483).
With ROV, a BGP route received by a neighbor is validated against the available RPKI records. A route that is valid or missing from RPKI is selected, while a route with RPKI records found to be invalid is typically rejected, thus preventing the use and propagation of hijacked and misconfigured routes.
One issue with RPKI is the fact that implementing ROA is meaningful only if other ASes implement ROV, and vice versa. Therefore, securing BGP routing requires a united effort and a lack of broader adoption disincentivizes ASes from commiting the resources to validate their own routes. Conversely, increasing RPKI adoption can lead to network effects and accelerate RPKI deployment. Projects like MANRS and Cloudflare’s isbgpsafeyet.com are promoting good Internet citizenship among network operators, and make the benefits of RPKI deployment known to the Internet. You can check whether your own ISP is being a good Internet citizen by testing it on isbgpsafeyet.com.
Measuring the extent to which both ROA (signing of addresses by the network that controls them) and ROV (filtering of invalid routes by ISPs) have been implemented is important to evaluating the impact of these initiatives, developing situational awareness, and predicting the impact of future misconfigurations or attacks.
Measuring ROAs is straightforward since ROA data is readily available from RPKI repositories. Querying RPKI repositories for publicly routed IP prefixes (e.g. prefixes visible in the RouteViews and RIPE RIS routing tables) allows us to estimate the percentage of addresses covered by ROA objects. Currently, there are 393,344 IPv4 and 86,306 IPv6 ROAs in the global RPKI system, covering about 40% of the globally routed prefix-AS origin pairs1.
Measuring ROV, however, is significantly more challenging given it is configured inside the BGP routers of each AS, not accessible by anyone other than each router’s administrator.
Measuring ROV deployment
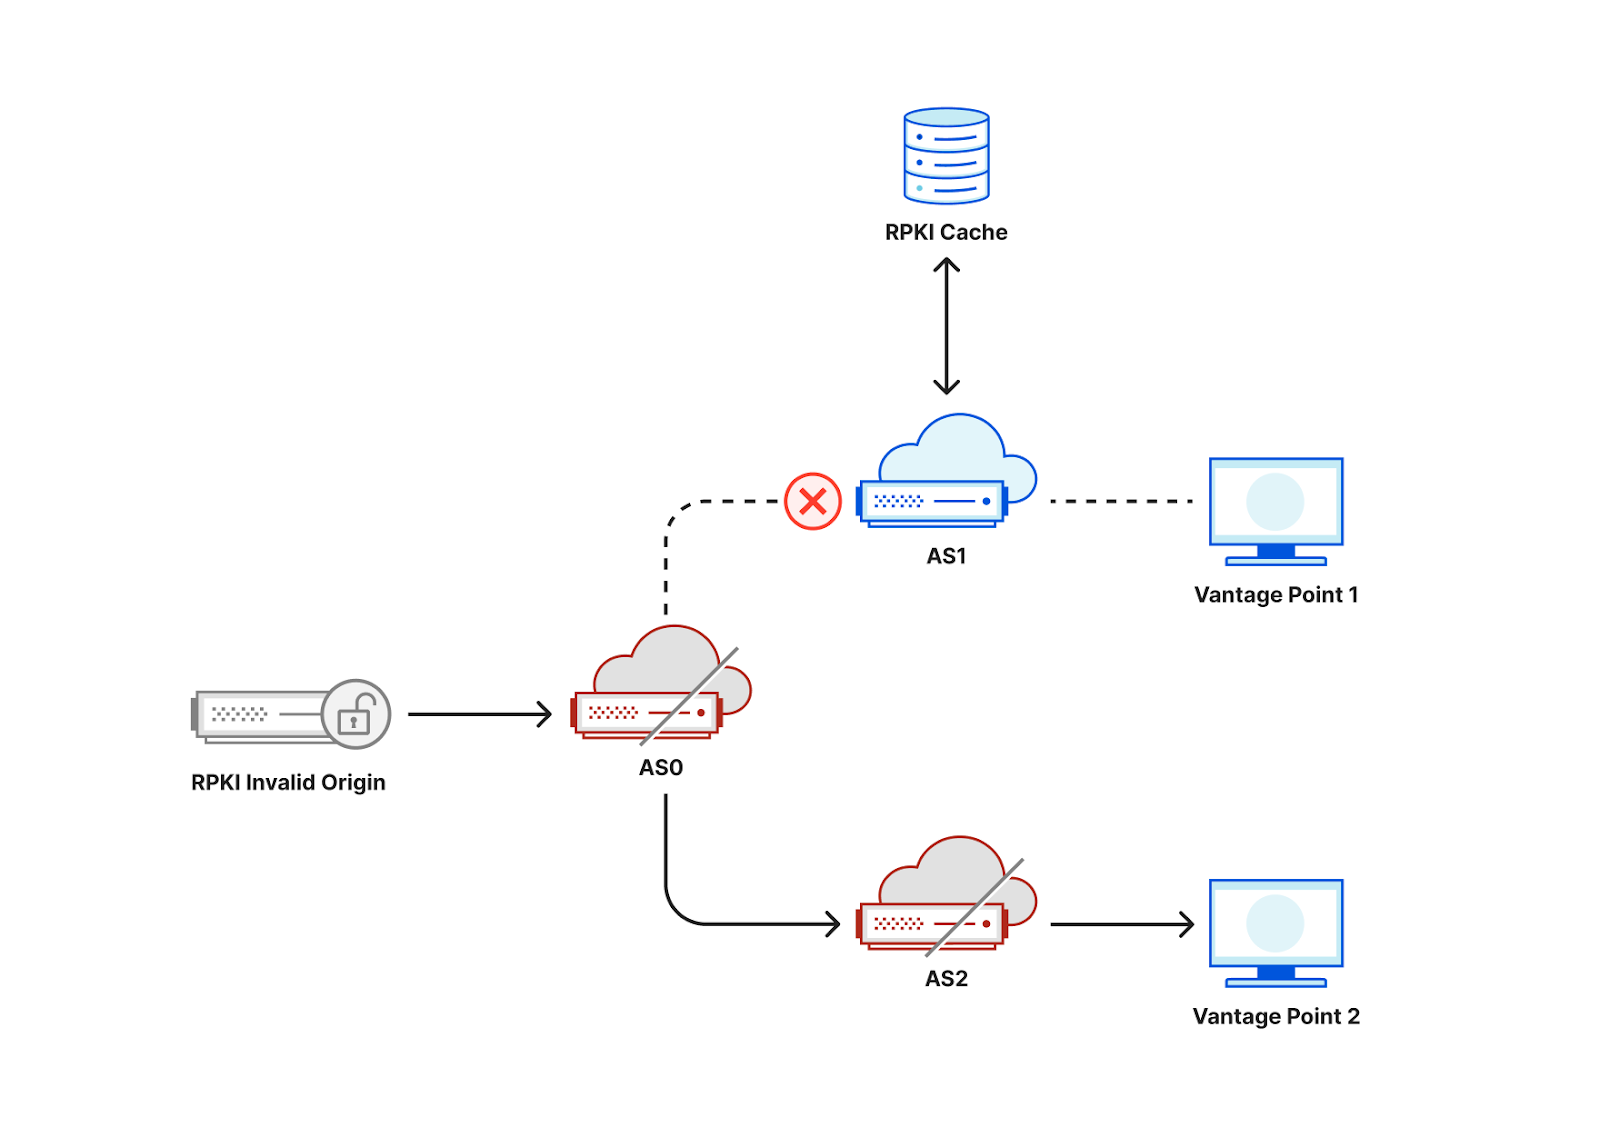
Although we do not have direct access to the configuration of everyone’s BGP routers, it is possible to infer the use of ROV by comparing the reachability of RPKI-valid and RPKI-invalid prefixes from measurement points within an AS2.
Consider the following toy topology as an example, where an RPKI-invalid origin is advertised through AS0 to AS1 and AS2. If AS1 filters and rejects RPKI-invalid routes, a user behind AS1 would not be able to connect to that origin. By contrast, if AS2 does not reject RPKI invalids, a user behind AS2 would be able to connect to that origin.
While occasionally a user may be unable to access an origin due to transient network issues, if multiple users act as vantage points for a measurement system, we would be able to collect a large number of data points to infer which ASes deploy ROV.
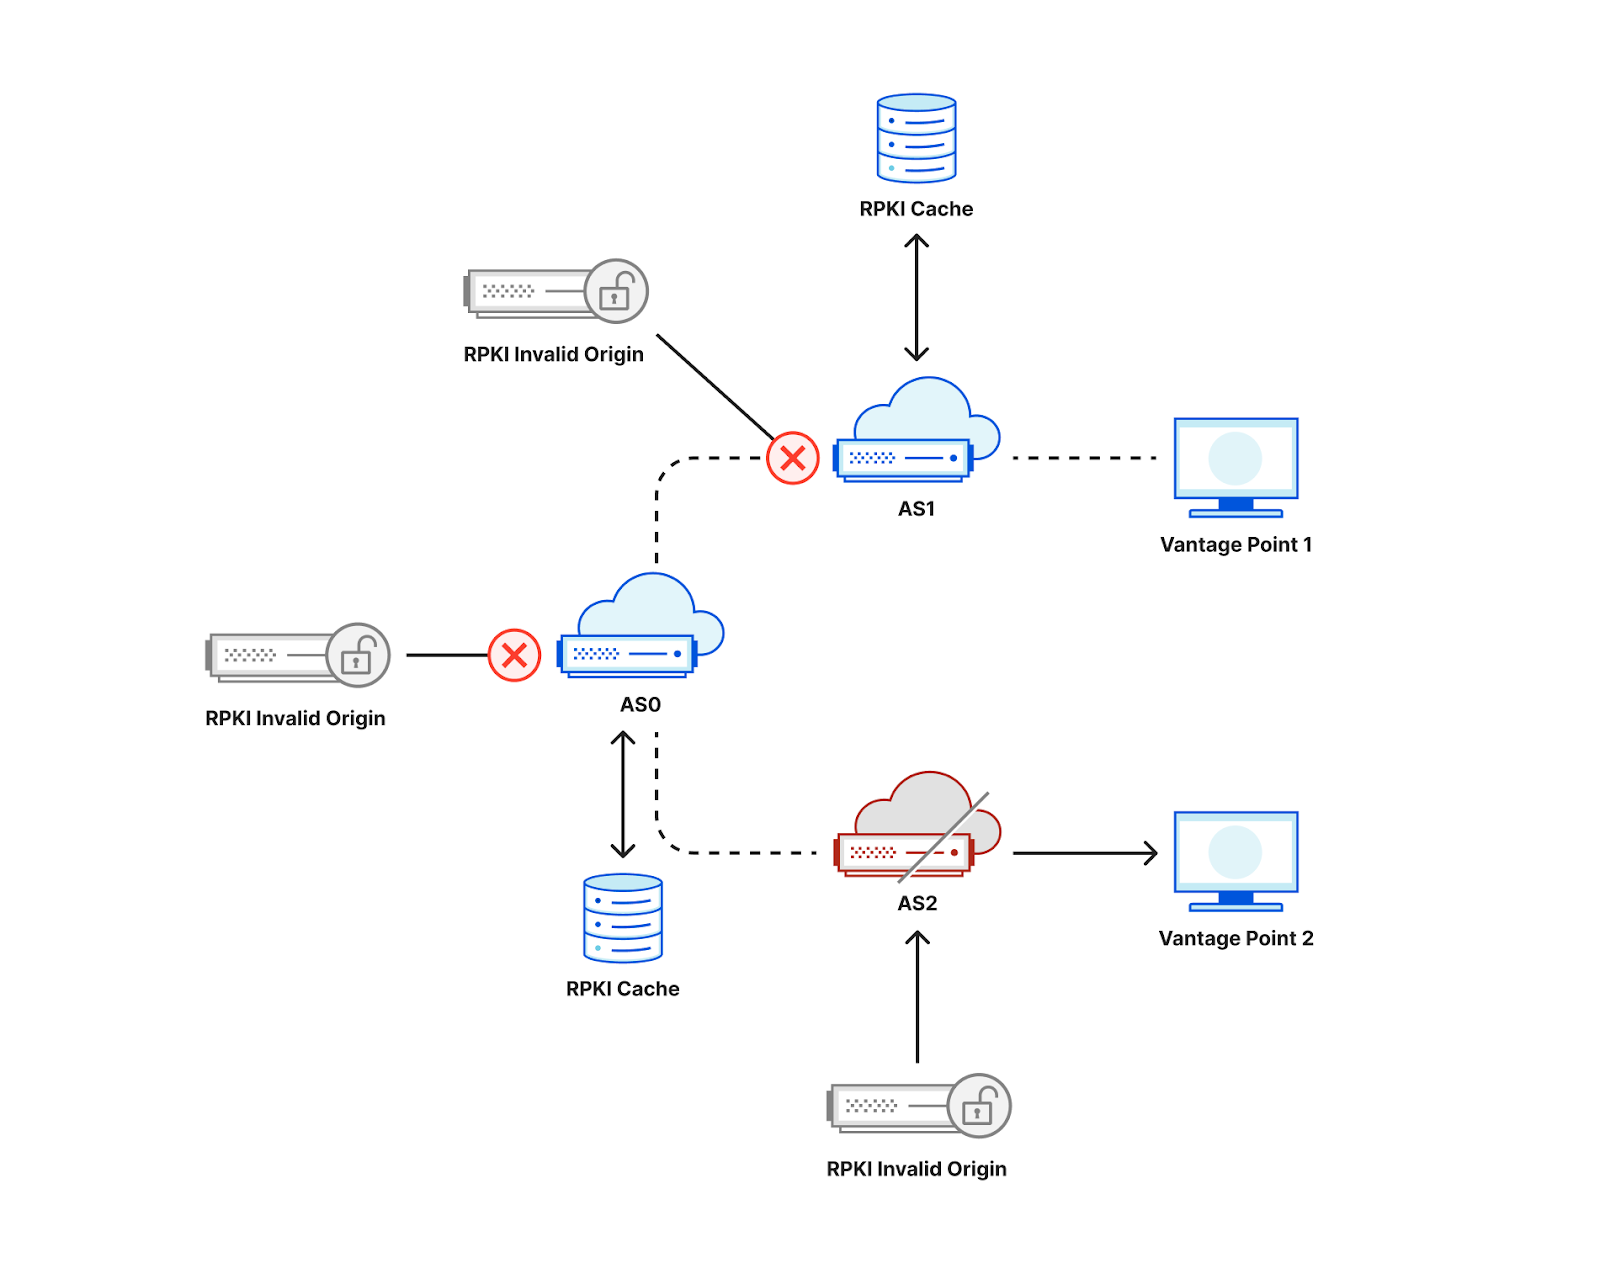
If, in the figure above, AS0 filters invalid RPKI routes, then vantage points in both AS1 and AS2 would be unable to connect to the RPKI-invalid origin, making it hard to distinguish if ROV is deployed at the ASes of our vantage points or in an AS along the path. One way to mitigate this limitation is to announce the RPKI-invalid origin from multiple locations from an anycast network taking advantage of its direct interconnections to the measurement vantage points as shown in the figure below. As a result, an AS that does not itself deploy ROV is less likely to observe the benefits of upstream ASes using ROV, and we would be able to accurately infer ROV deployment per AS3.
Note that it’s also important that the IP address of the RPKI-invalid origin should not be covered by a less specific prefix for which there is a valid or unknown RPKI route, otherwise even if an AS filters invalid RPKI routes its users would still be able to find a route to that IP.
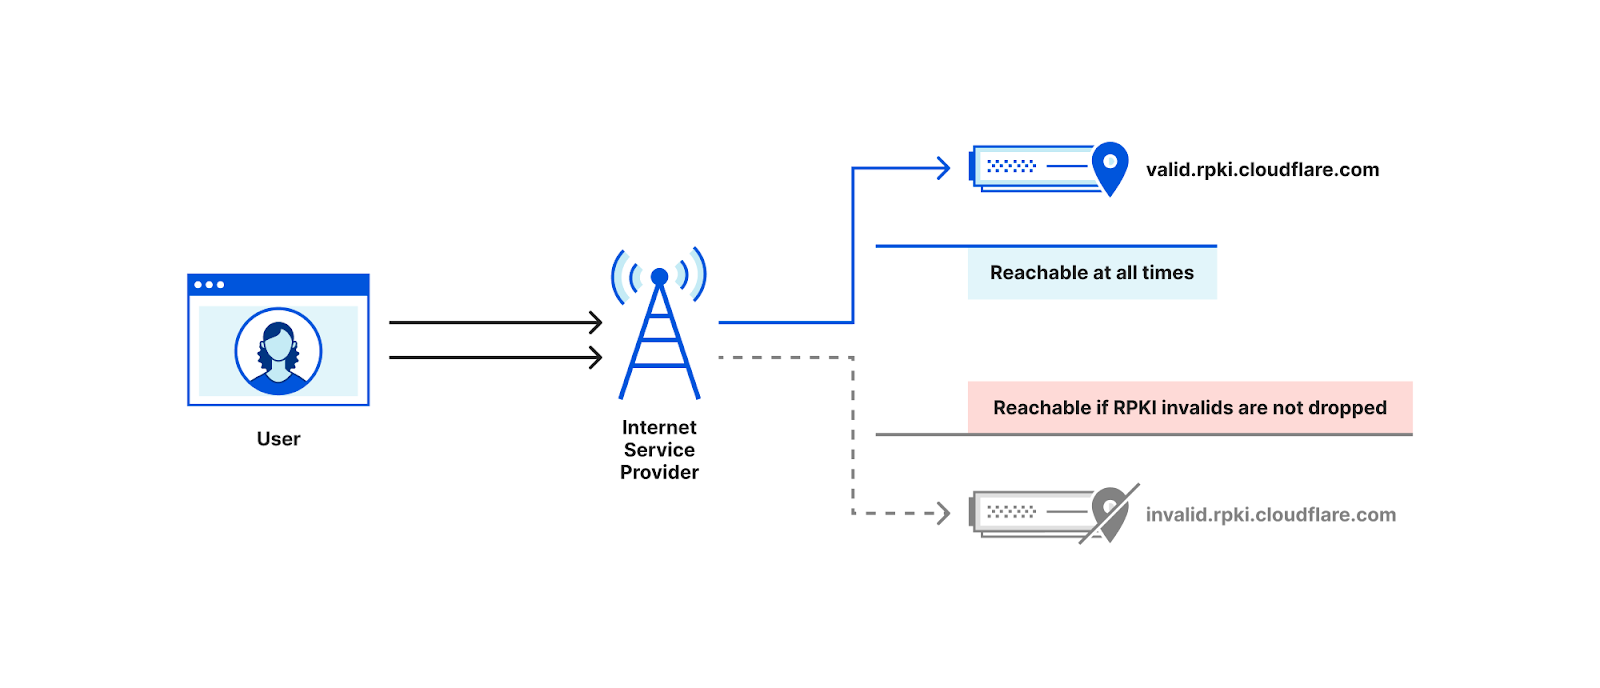
The measurement technique described here is the one implemented by Cloudflare’s isbgpsafeyet.com website, allowing end users to assess whether or not their ISPs have deployed BGP ROV.
The isbgpsafeyet.com website itself doesn’t submit any data back to Cloudflare, but recently we started measuring whether end users’ browsers can successfully connect to invalid RPKI origins when ROV is present. We use the same mechanism as is used for global performance data4. In particular, every measurement session (an individual end user at some point in time) attempts a request to both valid.rpki.cloudflare.com, which should always succeed as it’s RPKI-valid, and invalid.rpki.cloudflare.com, which is RPKI-invalid and should fail when the user’s ISP uses ROV.
This allows us to have continuous and up-to-date measurements from hundreds of thousands of browsers on a daily basis, and develop a greater understanding of the state of ROV deployment.
The state of global ROV deployment
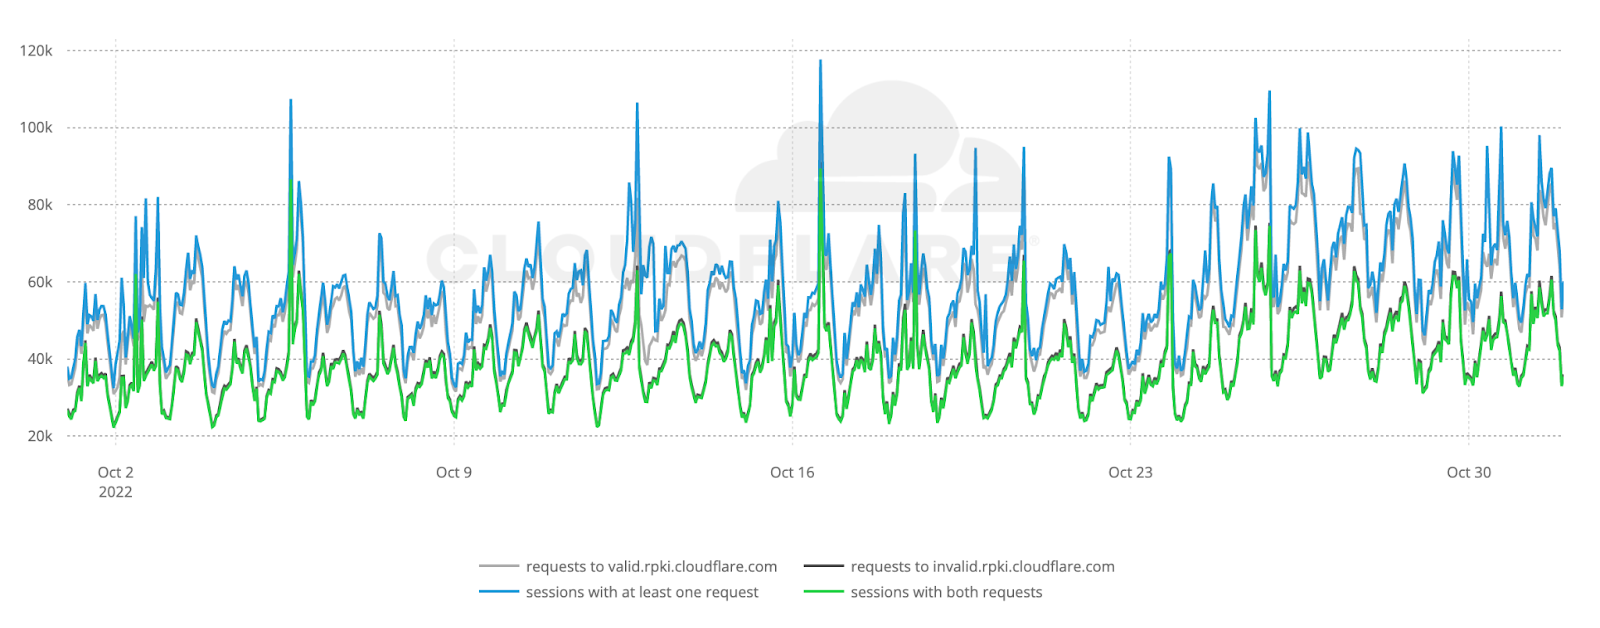
The figure below shows the raw number of ROV probe requests per hour during October 2022 to valid.rpki.cloudflare.com and invalid.rpki.cloudflare.com. In total, we observed 69.7 million successful probes from 41,531 ASNs.
Based on APNIC’s estimates on the number of end users per ASN, our weighted5 analysis covers 96.5% of the world’s Internet population. As expected, the number of requests follow a diurnal pattern which reflects established user behavior in daily and weekly Internet activity6.
We can also see that the number of successful requests to valid.rpki.cloudflare.com (gray line) closely follows the number of sessions that issued at least one request (blue line), which works as a smoke test for the correctness of our measurements.
As we don’t store the IP addresses that contribute measurements, we don’t have any way to count individual clients and large spikes in the data may introduce unwanted bias. We account for that by capturing those instants and excluding them.
Overall, we estimate thatout of the four billion Internet users, only 261 million (6.5%) are protected by BGP Route Origin Validation, but the true state of global ROV deployment is more subtle than this.
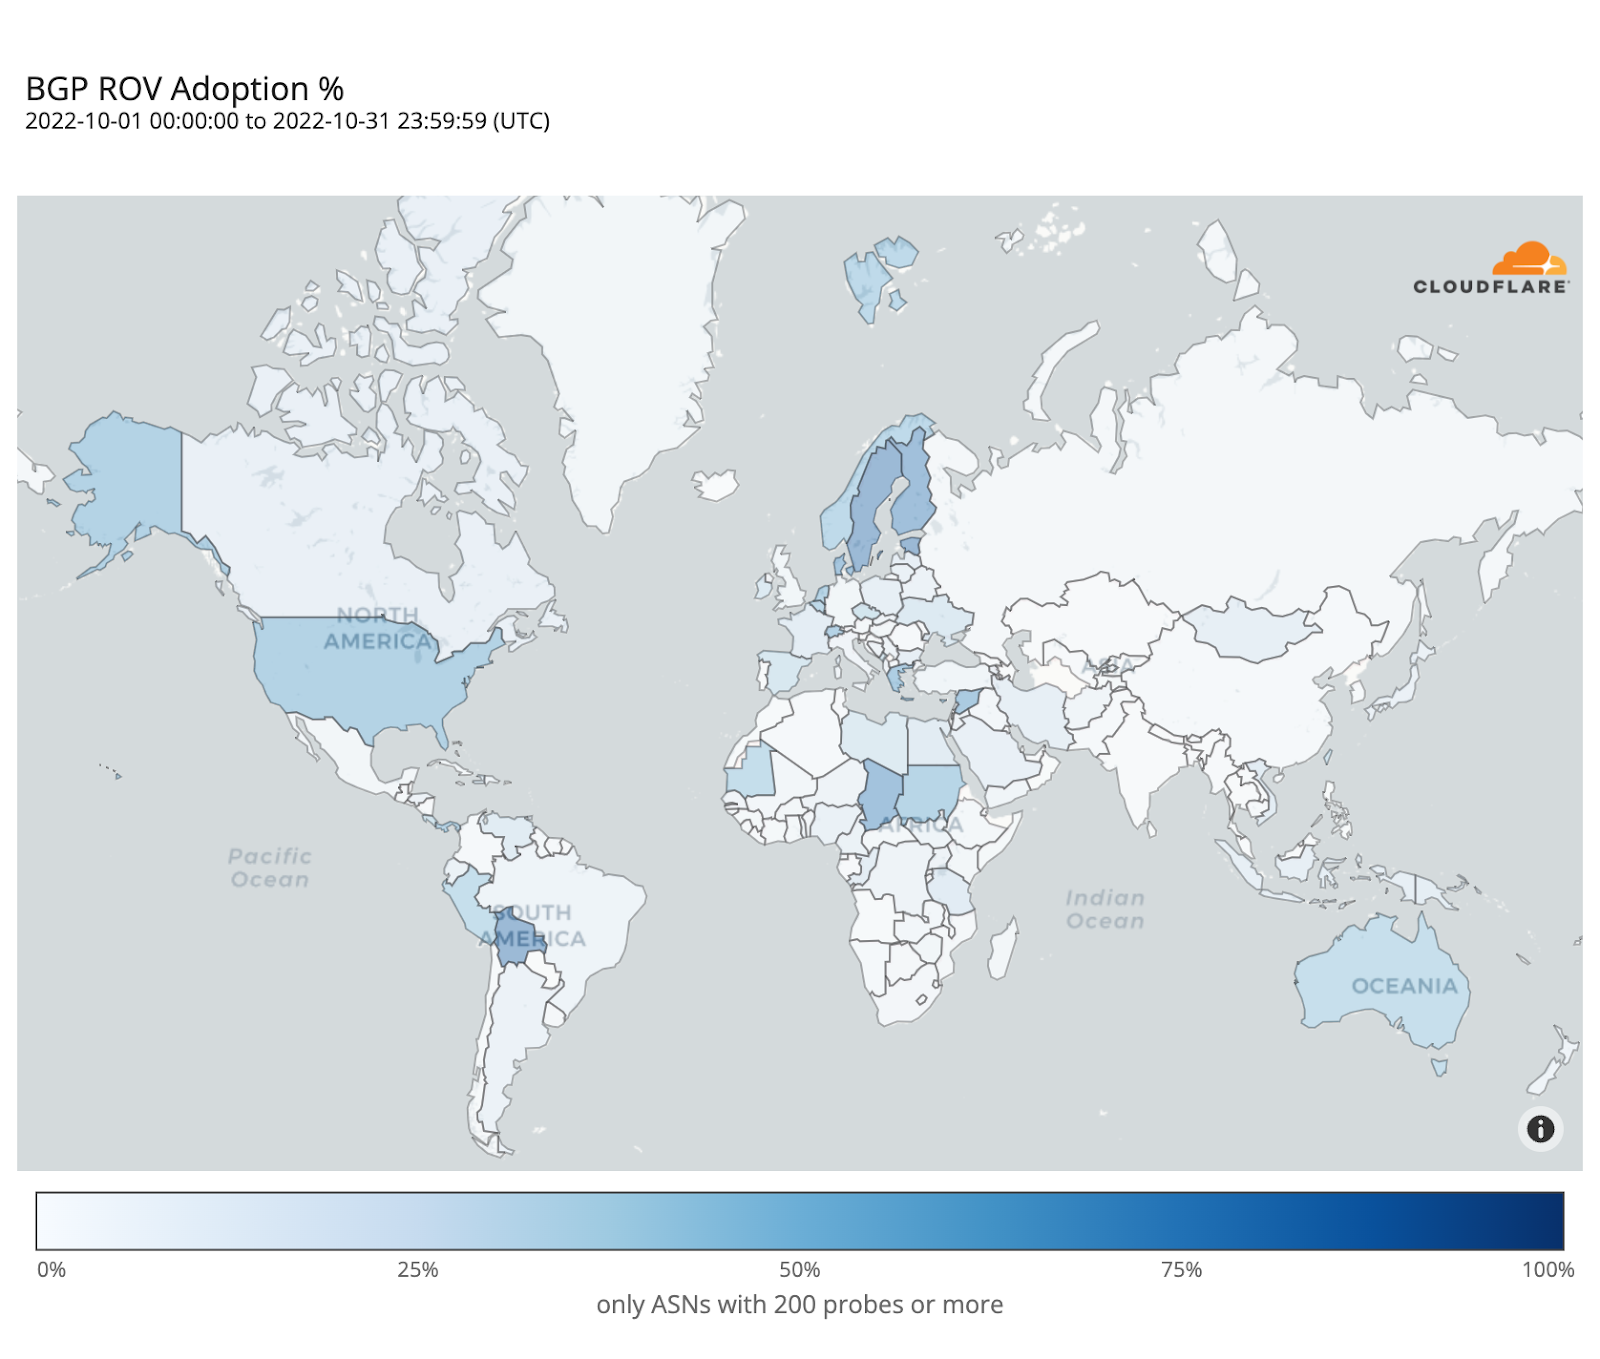
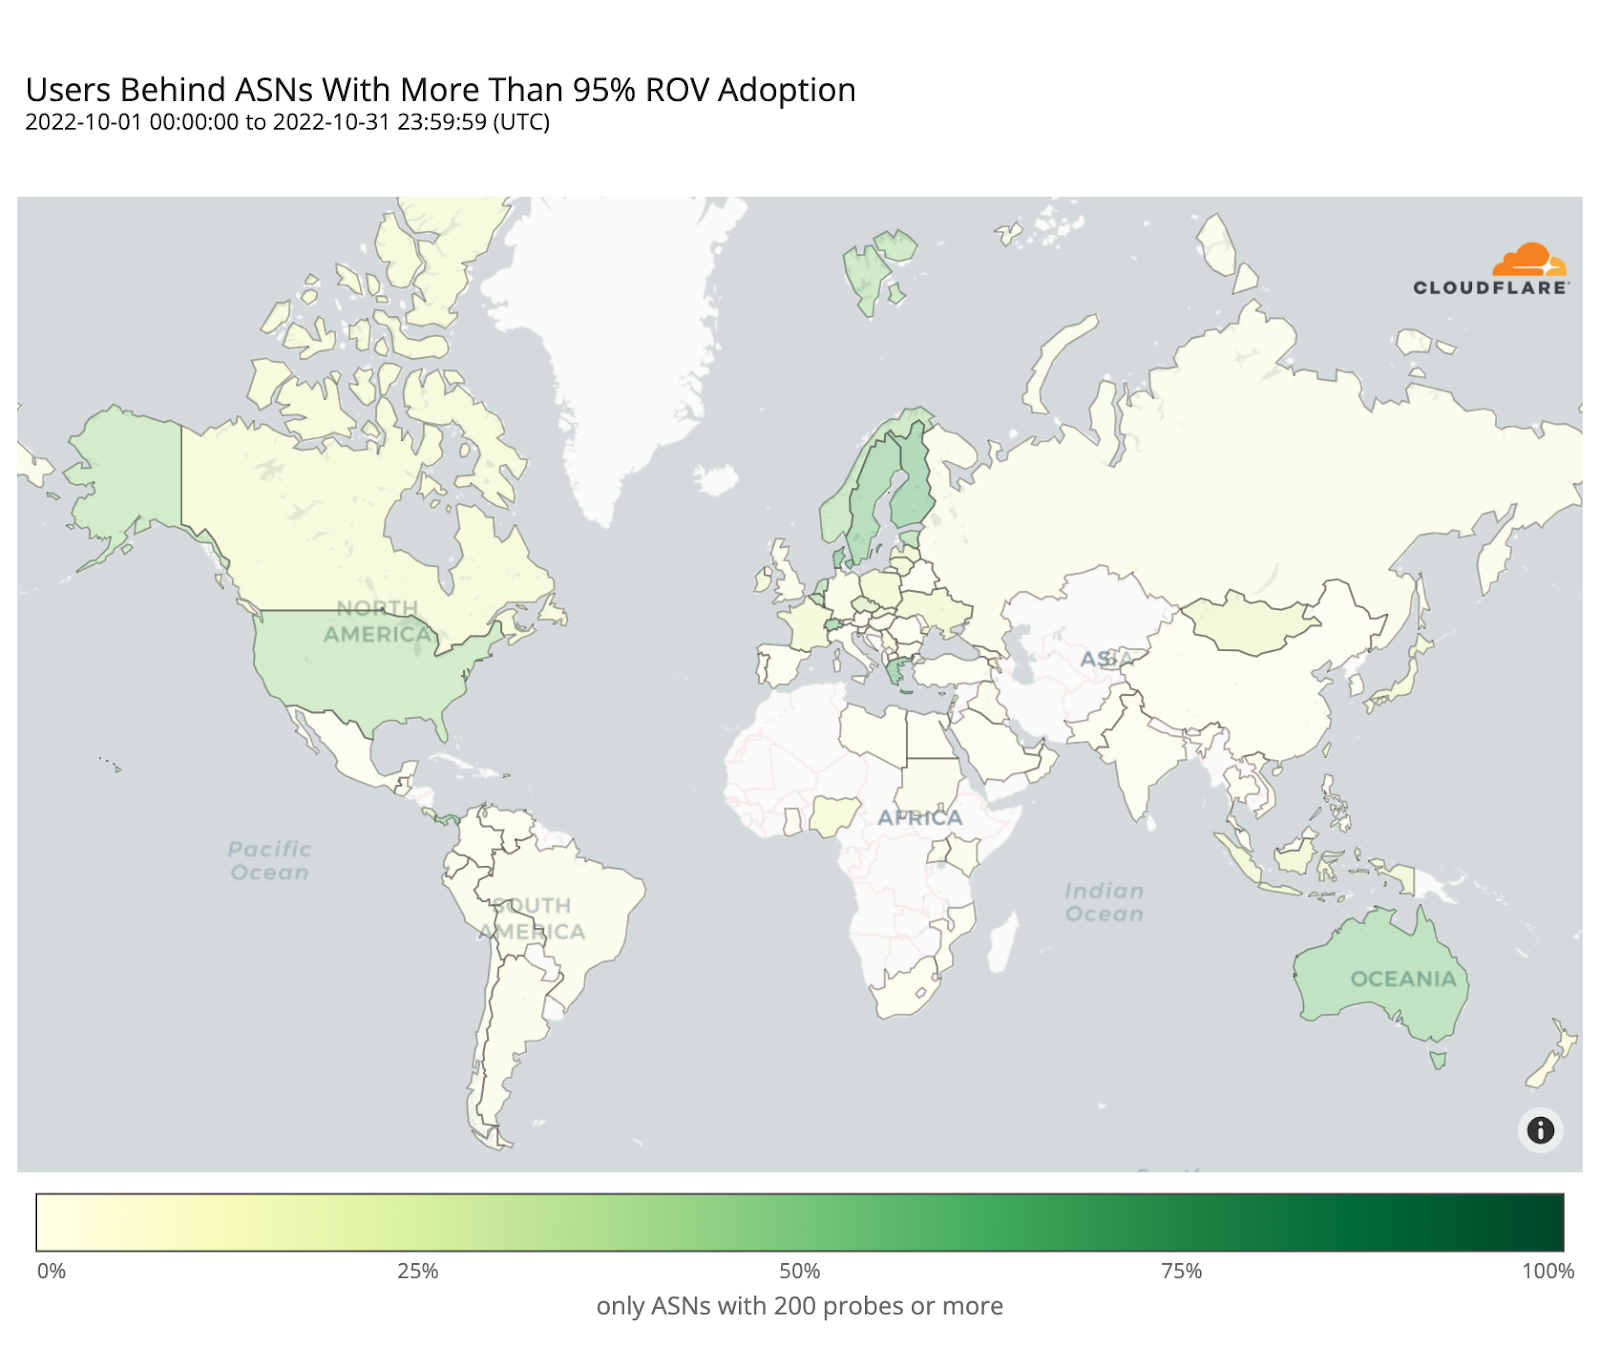
The following map shows the fraction of dropped RPKI-invalid requests from ASes with over 200 probes over the month of October. It depicts how far along each country is in adopting ROV but doesn’t necessarily represent the fraction of protected users in each country, as we will discover.
Sweden and Bolivia appear to be the countries with the highest level of adoption (over 80%), while only a few other countries have crossed the 50% mark (e.g. Finland, Denmark, Chad, Greece, the United States).
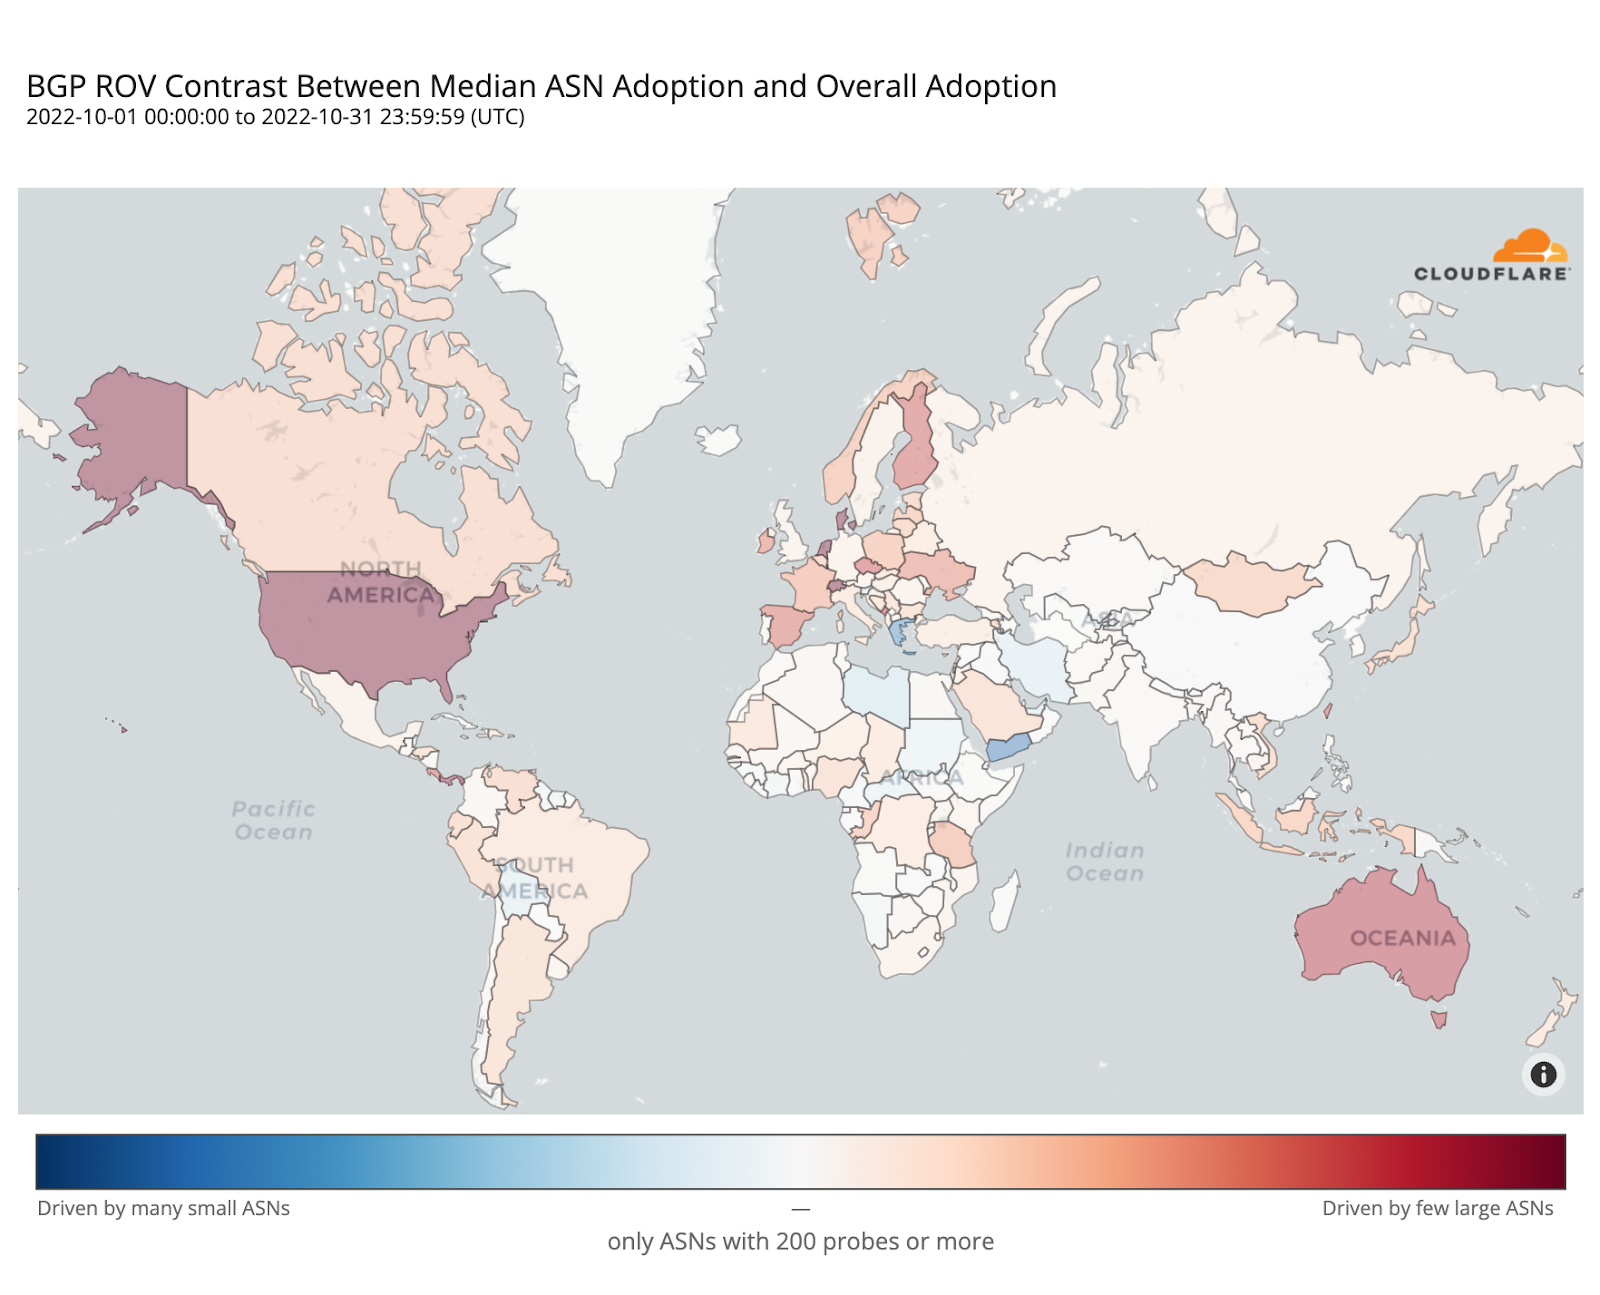
ROV adoption may be driven by a few ASes hosting large user populations, or by many ASes hosting small user populations. To understand such disparities, the map below plots the contrast between overall adoption in a country (as in the previous map) and median adoption over the individual ASes within that country. Countries with stronger reds have relatively few ASes deploying ROV with high impact, while countries with stronger blues have more ASes deploying ROV but with lower impact per AS.
In the Netherlands, Denmark, Switzerland, or the United States, adoption appears mostly driven by their larger ASes, while in Greece or Yemen it’s the smaller ones that are adopting ROV.
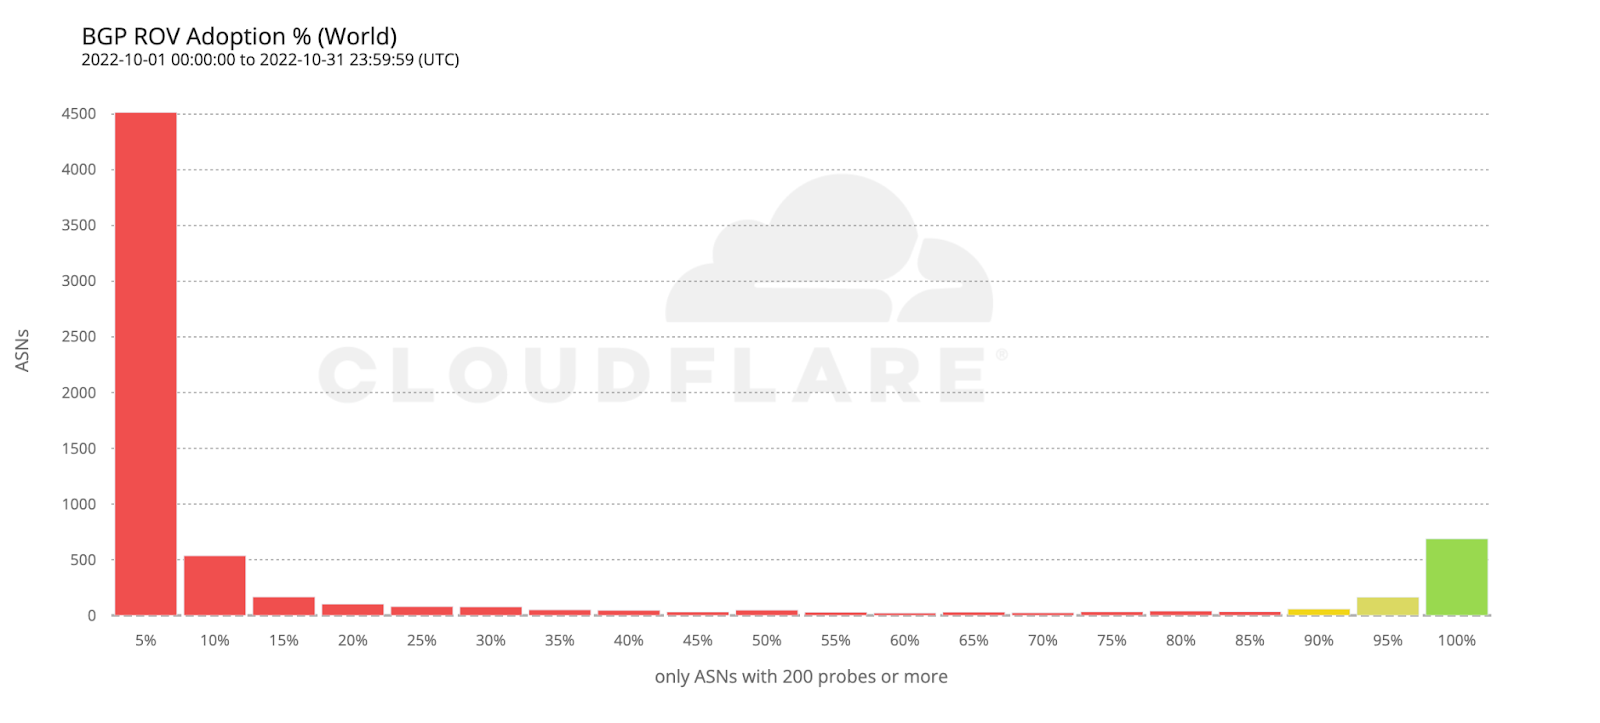
The following histogram summarizes the worldwide level of adoption for the 6,765 ASes covered by the previous two maps.
Most ASes either don’t validate at all, or have close to 100% adoption, which is what we’d intuitively expect. However, it’s interesting to observe that there are small numbers of ASes all across the scale. ASes that exhibit partial RPKI-invalid drop rate compared to total requests may either implement ROV partially (on some, but not all, of their BGP routers), or appear as dropping RPKI invalids due to ROV deployment by other ASes in their upstream path.
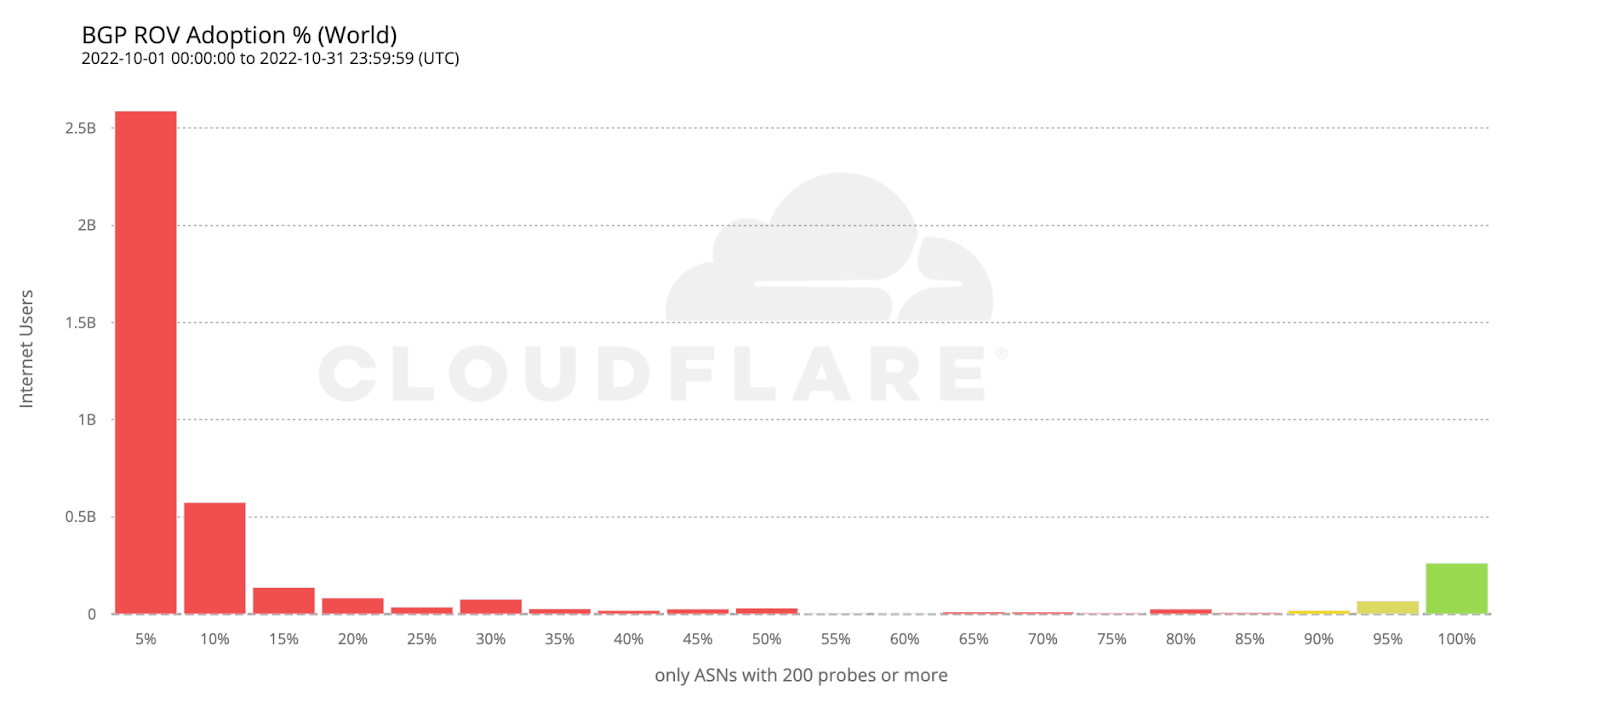
To estimate the number of users protected by ROV we only considered ASes with an observed adoption above 95%, as an AS with an incomplete deployment still leaves its users vulnerable to route leaks from its BGP peers.
If we take the previous histogram and summarize by the number of users behind each AS, the green bar on the right corresponds to the 261 million users currently protected by ROV according to the above criteria (686 ASes).
Looking back at the country adoption map one would perhaps expect the number of protected users to be larger. But worldwide ROV deployment is still mostly partial, lacking larger ASes, or both. This becomes even more clear when compared with the next map, plotting just the fraction of fully protected users.
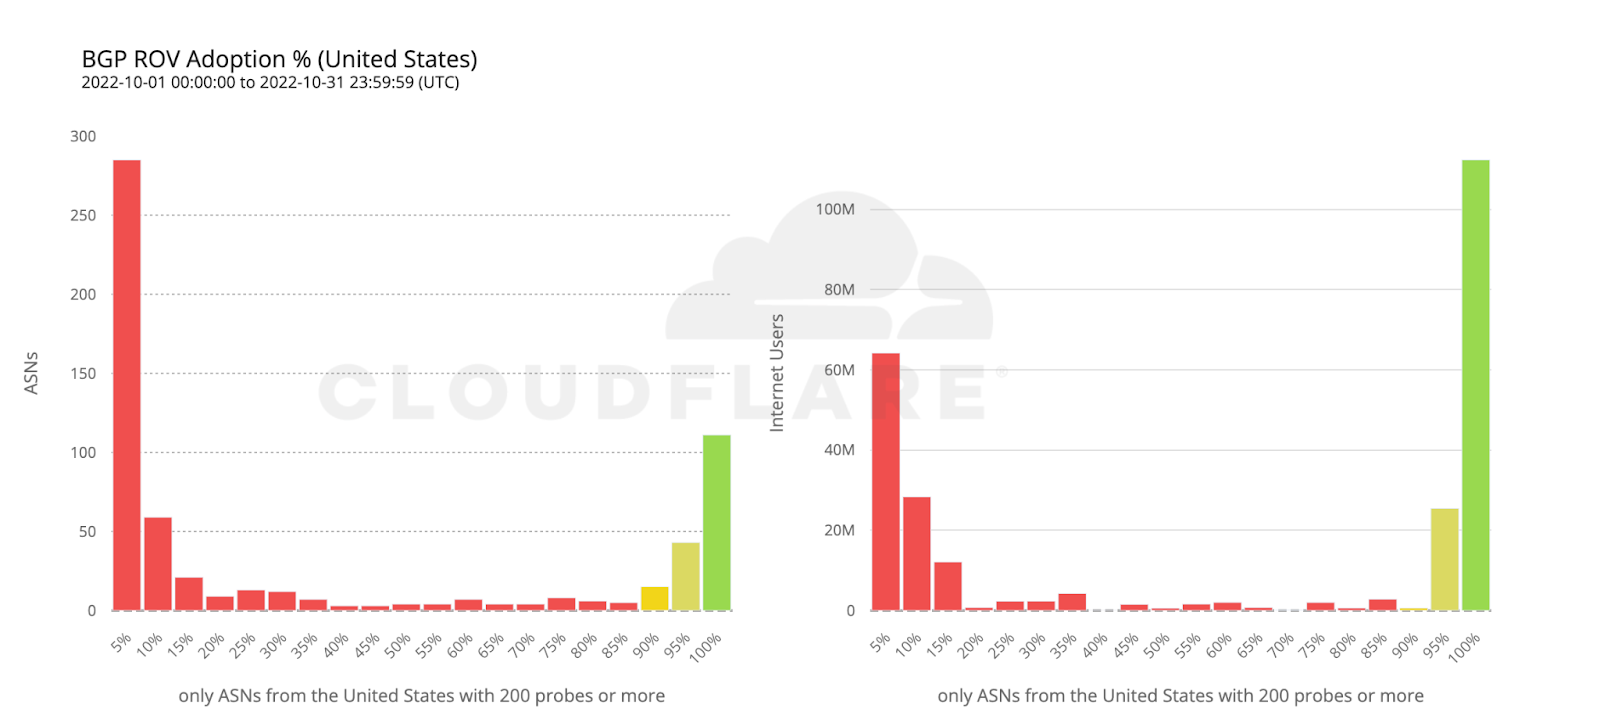
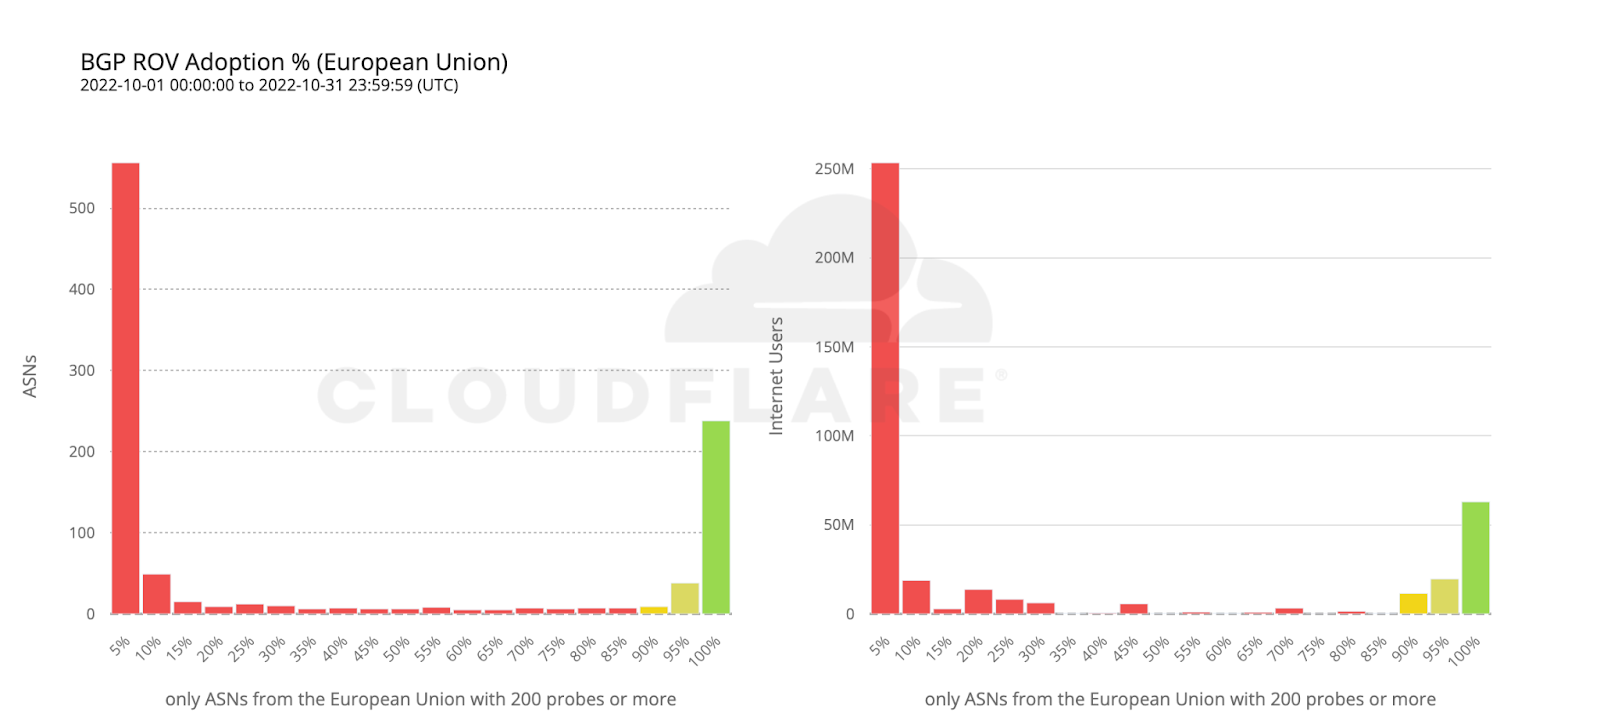
To wrap up our analysis, we look at two world economies chosen for their contrasting, almost symmetrical, stages of deployment: the United States and the European Union.
112 million Internet users are protected by 111 ASes from the United States with comprehensive ROV deployments. Conversely, more than twice as many ASes from countries making up the European Union have fully deployed ROV, but end up covering only half as many users. This can be reasonably explained by end user ASes being more likely to operate within a single country rather than span multiple countries.
Conclusion
Probe requests were performed from end user browsers and very few measurements were collected from transit providers (which have few end users, if any). Also, paths between end user ASes and Cloudflare are often very short (a nice outcome of our extensive peering) and don’t traverse upper-tier networks that they would otherwise use to reach the rest of the Internet.
In other words, the methodology used focuses on ROV adoption by end user networks (e.g. ISPs) and isn’t meant to reflect the eventual effect of indirect validation from (perhaps validating) upper-tier transit networks. While indirect validation may limit the “blast radius” of (malicious or accidental) route leaks, it still leaves non-validating ASes vulnerable to leaks coming from their peers.
As with indirect validation, an AS remains vulnerable until its ROV deployment reaches a sufficient level of completion. We chose to only consider AS deployments above 95% as truly comprehensive, and Cloudflare Radar will soon begin using this threshold to track ROV adoption worldwide, as part of our mission to help build a better Internet.
When considering only comprehensive ROV deployments, some countries such as Denmark, Greece, Switzerland, Sweden, or Australia, already show an effective coverage above 50% of their respective Internet populations, with others like the Netherlands or the United States slightly above 40%, mostly driven by few large ASes rather than many smaller ones.
Worldwide we observe a very low effective coverage of just 6.5% over the measured ASes, corresponding to 261 million end users currently safe from (malicious and accidental) route leaks, which means there’s still a long way to go before we can declare BGP to be safe.
…… 1https://rpki.cloudflare.com/ 2Gilad, Yossi, Avichai Cohen, Amir Herzberg, Michael Schapira, and Haya Shulman. “Are we there yet? On RPKI’s deployment and security.” Cryptology ePrint Archive (2016). 3Geoff Huston. “Measuring ROAs and ROV”. https://blog.apnic.net/2021/03/24/measuring-roas-and-rov/ 4Measurements are issued stochastically when users encounter 1xxx error pages from default (non-customer) configurations. 5Probe requests are weighted by AS size as calculated from Cloudflare’s worldwide HTTP traffic. 6Quan, Lin, John Heidemann, and Yuri Pradkin. “When the Internet sleeps: Correlating diurnal networks with external factors.” In Proceedings of the 2014 Conference on Internet Measurement Conference, pp. 87-100. 2014.
Visit 1.1.1.1 from any device to get started with our free app that makes your Internet faster and safer.
To learn more about our mission to help build a better Internet, start here. If you’re looking for a new career direction, check out our open positions.
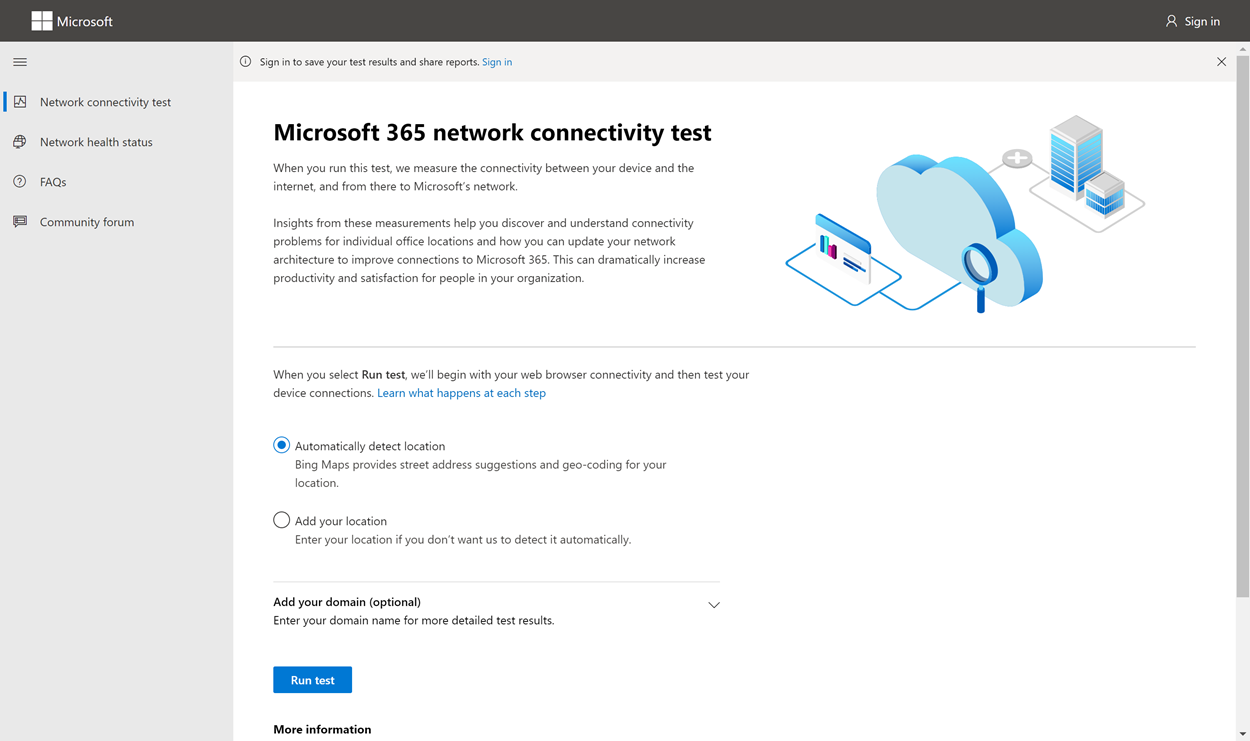
The Microsoft 365 network connectivity test tool is located at https://connectivity.office.com. It’s an adjunct tool to the network assessment and network insights available in the Microsoft 365 admin center under the Health | Connectivity menu.
Important
It’s important to sign in to your Microsoft 365 tenant as all test reports are shared with your administrator and uploaded to the tenant while you are signed in.
Note
The network connectivity test tool supports tenants in WW Commercial but not GCC Moderate, GCC High, DoD or China.
Network insights in the Microsoft 365 Admin Center are based on regular in-product measurements for your Microsoft 365 tenant, aggregated each day. In comparison, network insights from the Microsoft 365 network connectivity test are run locally in the tool.
In-product testing is limited, and running tests local to the user collects more data resulting in deeper insights. Network insights in the Microsoft 365 Admin Center will show that there’s a networking problem at a specific office location. The Microsoft 365 connectivity test can help to identify the root cause of that problem and provide a targeted performance improvement action.
We recommend that these insights be used together where networking quality status can be assessed for each office location in the Microsoft 365 Admin Center and more specifics can be found after deployment of testing based on the Microsoft 365 connectivity test.
What happens at each test step
Office location identification
When you click the Run test button, we show the running test page and identify the office location. You can type in your location by city, state, and country or choose to have it detected for you. If you detect the office location, the tool requests the latitude and longitude from the web browser and limits the accuracy to 300 meters by 300 meters before use. It’s not necessary to identify the location more accurately than the building to measure network performance.
JavaScript tests
After office location identification, we run a TCP latency test in JavaScript and we request data from the service about in-use and recommended Microsoft 365 service front door servers. When these tests are completed, we show them on the map and in the details tab where they can be viewed before the next step.
Download the advanced tests client application
Next, we start the download of the advanced tests client application. We rely on the user to launch the client application and they must also have .NET 6.0 Runtime installed.
There are two parts to the Microsoft 365 network connectivity test: the web site https://connectivity.office.com and a downloadable Windows client application that runs advanced network connectivity tests. Most of the tests require the application to be run. It will populate results back into the web page as it runs.
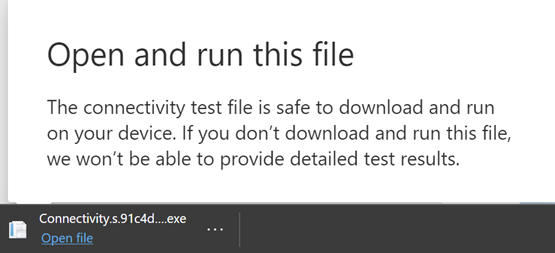
You’ll be prompted to download the advanced client test application from the web site after the web browser tests have completed. Open and run the file when prompted.
Start the advanced tests client application
Once the client application starts, the web page will update to show this result. Test data will start to be received to the web page. The page updates each time new-data is received and you can review the data as it arrives.
Advanced tests completed and test report upload
When the tests are completed, the web page and the advanced tests client will both show that. If the user is signed in, the test report will be uploaded to the customer’s tenant.
Sharing your test report
The test report requires authentication to your Microsoft 365 account. Your administrator selects how you can share your test report. The default settings allow for sharing of your reports with other user within your organization and the ReportID link is not available. Reports will expire by default after 90 days.
Sharing your report with your administrator
If you’re signed in when a test report occurs, the report is shared with your administrator.
Sharing with your Microsoft account team, support or other personnel
Test reports (excluding any personal identification) are shared with Microsoft employees. This sharing is enabled by default and can be disabled by your administrator in the Health | Network Connectivity page in the Microsoft 365 Admin Center.
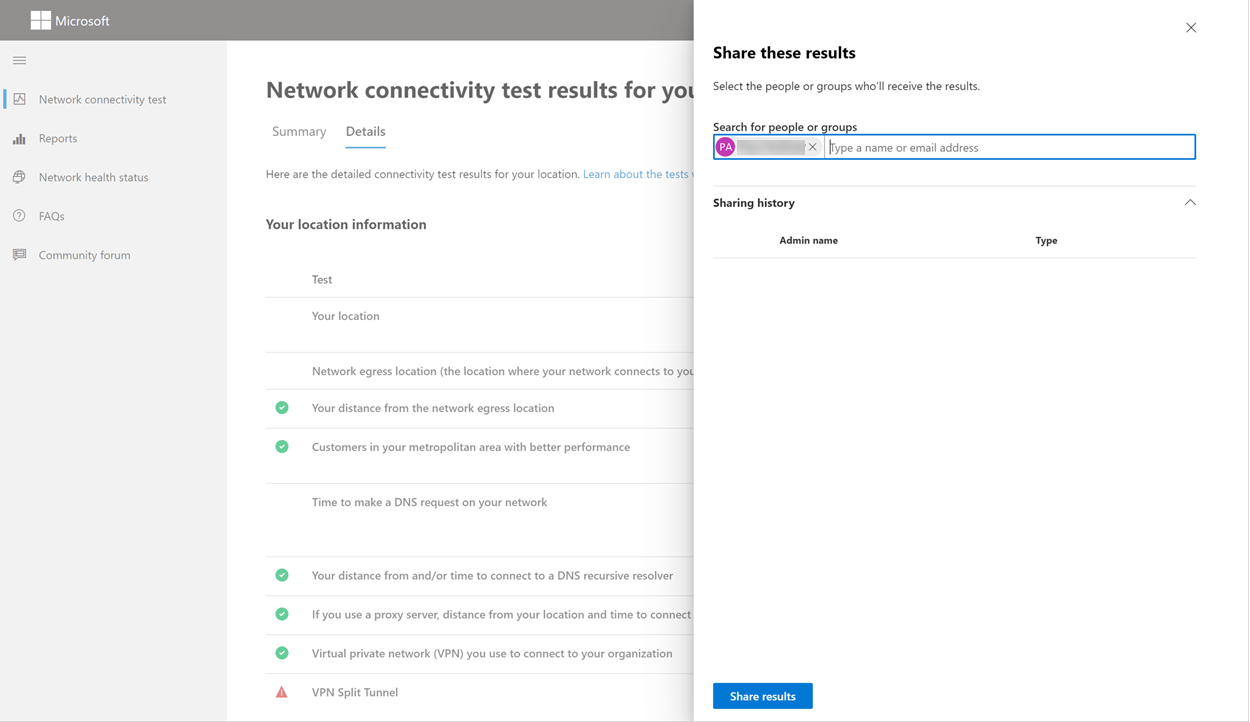
Sharing with other users who sign in to the same Microsoft 365 tenant
You can choose users to share your report with. Being able to choose is enabled by default, but it can be disabled by your administrator.
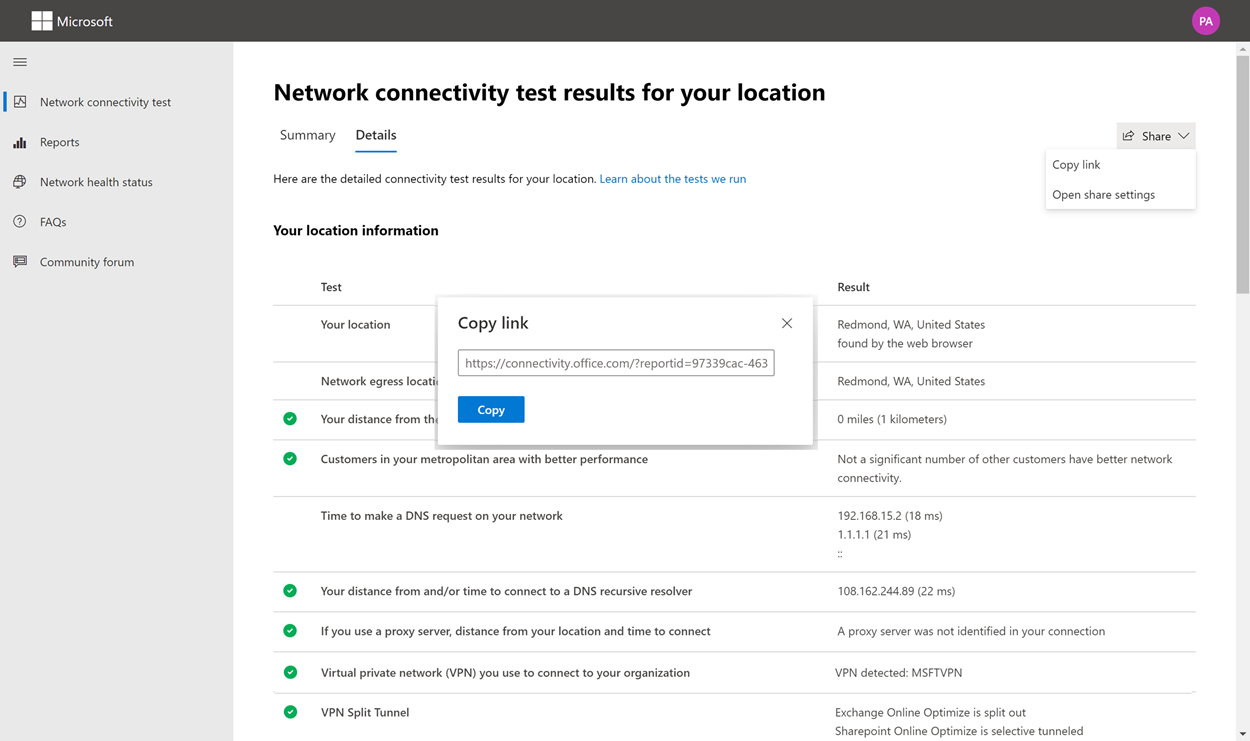
Sharing with anyone using a ReportID link
You can share your test report with anyone by providing access to a ReportID link. This link generates a URL that you can send to someone so that they can bring up the test report without signing in. This sharing is disabled by default and must be enabled by your administrator.
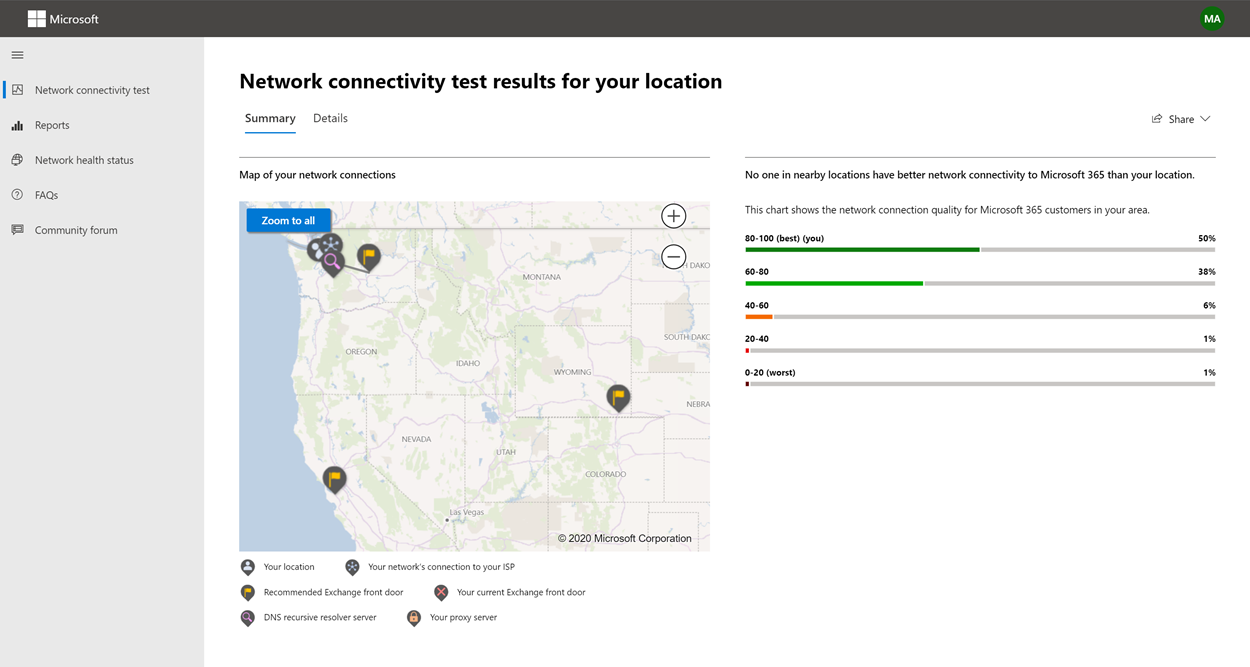
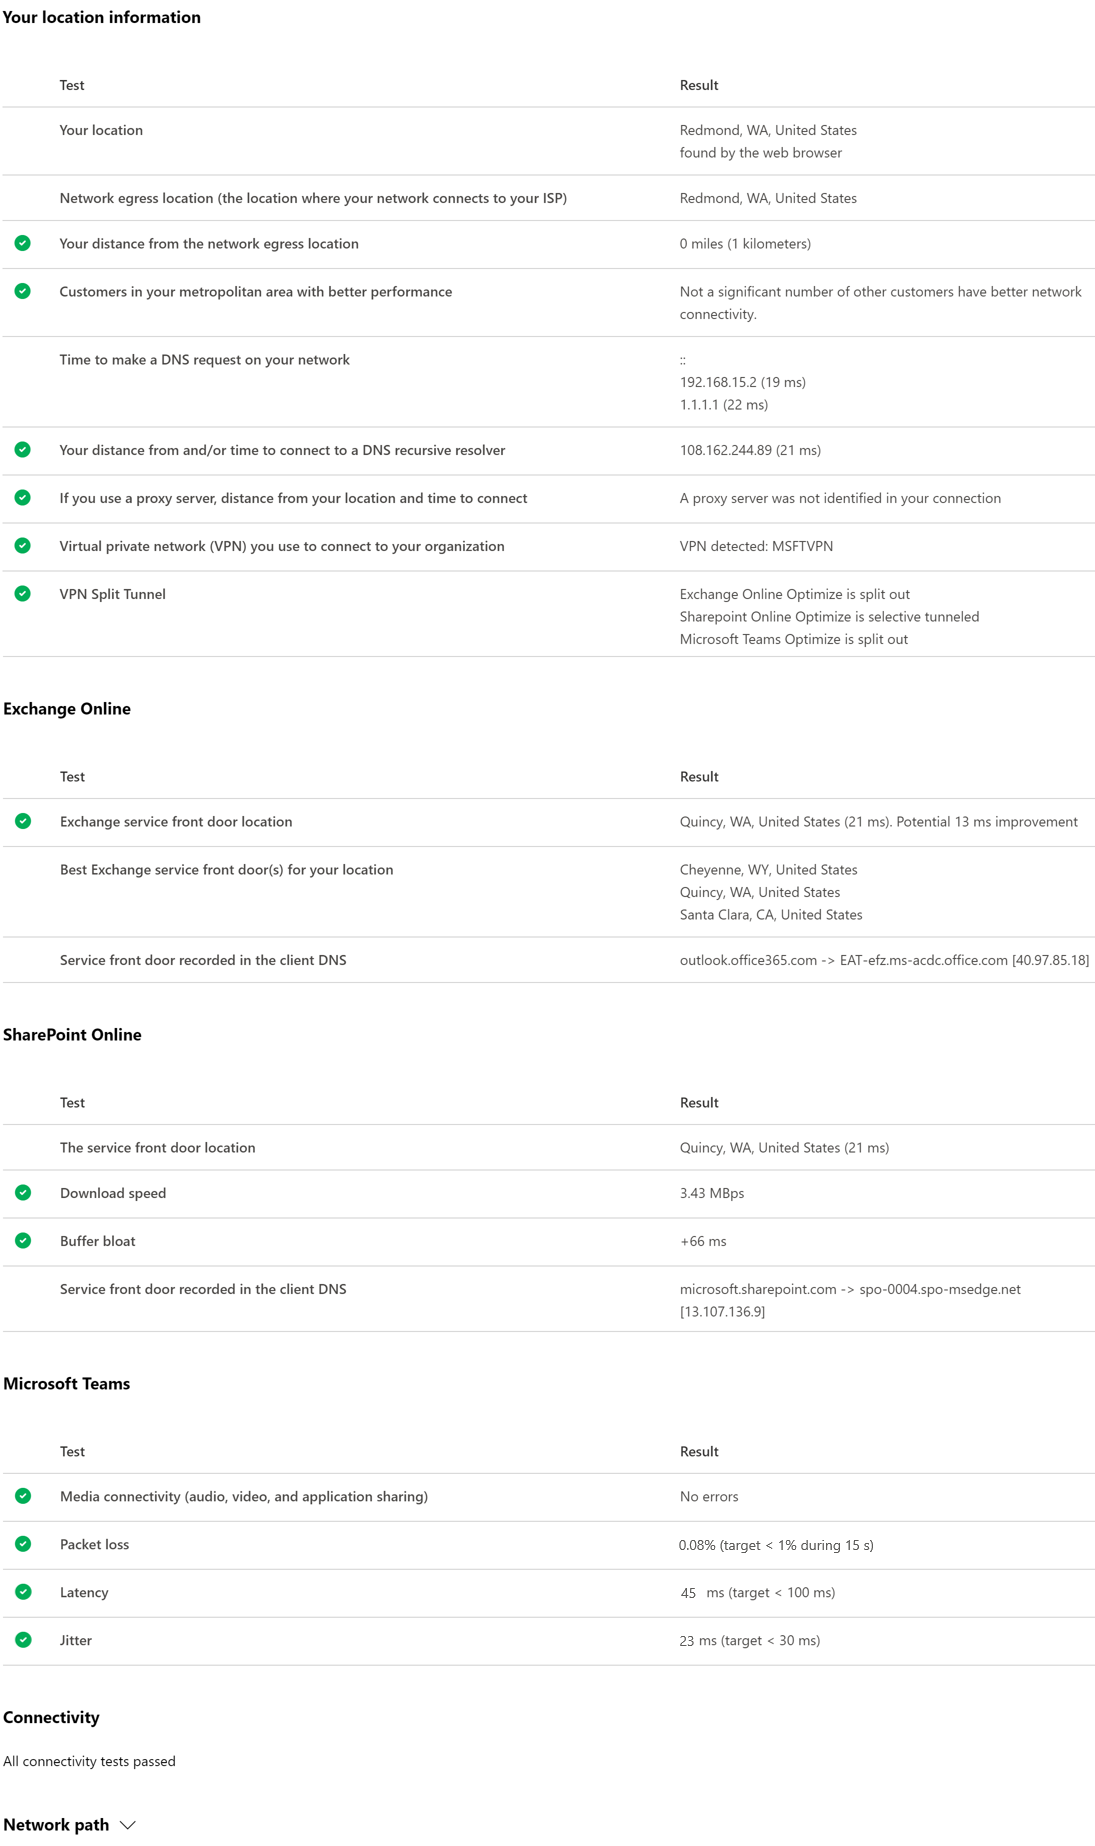
Network Connectivity Test Results
The results are shown in the Summary and Details tabs. The summary tab shows a map of the detected network perimeter and a comparison of the network assessment to other Microsoft 365 customers nearby. It also allows for sharing of the test report. Here’s what the summary results view looks like:
Here’s an example of the details tab output. On the details tab we show a green circle check mark if the result was compared favorably. We show a red triangle exclamation point if the result exceeded a threshold indicating a network insight. The following sections describe each of the details tab results rows and explain the thresholds used for network insights.
Your location information
This section shows test results related to your location.
Your location
The user location is detected from the users web browser. It can also be typed in at the user’s choice. It’s used to identify network distances to specific parts of the enterprise network perimeter. Only the city from this location detection and the distance to other network points are saved in the report.
The user office location is shown on the map view.
Network egress location (the location where your network connects to your ISP)
We identify the network egress IP address on the server side. Location databases are used to look up the approximate location for the network egress. These databases typically have an accuracy of about 90% of IP addresses. If the location looked up from the network egress IP address isn’t accurate, this would lead to a false result. To validate if this error is occurring for a specific IP address, you can use publicly accessible network IP address location web sites to compare against your actual location.
Your distance from the network egress location
We determine the distance from that location to the office location. This is shown as a network insight if the distance is greater than 500 miles (800 kilometers) since that is likely to increase the TCP latency by more than 25 ms and may affect user experience.
The map shows the network egress location in relation to the user office location indicating the network backhaul inside of the enterprise WAN.
Implement local and direct network egress from user office locations to the Internet for optimal Microsoft 365 network connectivity. Improvements to local and direct egress are the best way to address this network insight.
Proxy server information
We identify whether proxy server(s) are configured on the local machine to pass Microsoft 365 network traffic in the Optimize category. We identify the distance from the user office location to the proxy servers.
The distance is tested first by ICMP ping. If that fails, we test with TCP ping and finally we look up the proxy server IP address in an IP address location database. We show a network insight if the proxy server is further than 500 miles (800 kilometers) away from the user office location.
Virtual private network (VPN) you use to connect to your organization
This test detects if you’re using a VPN to connect to Microsoft 365. A passing result will show if you have no VPN, or if you have a VPN with recommended split tunnel configuration for Microsoft 365.
VPN Split Tunnel
Each Optimize category route for Exchange Online, SharePoint Online, and Microsoft Teams is tested to see if It’s tunneled on the VPN. A split out workload avoids the VPN entirely. A tunneled workload is sent over the VPN. A selective tunneled workload has some routes sent over the VPN and some split out. A passing result will show if all workloads are split out or selective tunneled.
Customers in your metropolitan area with better performance
Network latency between the user office location and the Exchange Online service is compared to other Microsoft 365 customers in the same metro area. A network insight is shown if 10% or more of customers in the same metro area have better performance. This means their users will have better performance in the Microsoft 365 user interface.
This network insight is generated on the basis that all users in a city have access to the same telecommunications infrastructure and the same proximity to Internet circuits and Microsoft’s network.
Time to make a DNS request on your network
This shows the DNS server configured on the client machine that ran the tests. It might be a DNS Recursive Resolver server however this is uncommon. It’s more likely to be a DNS forwarder server, which caches DNS results and forwards any uncached DNS requests to another DNS server.
This is provided for information only and does not contribute to any network insight.
Your distance from and/or time to connect to a DNS recursive resolver
The in-use DNS Recursive Resolver is identified by making a specific DNS request and then asking the DNS Name Server for the IP Address that it received the same request from. This IP Address is the DNS Recursive Resolver and it will be looked up in IP Address location databases to find the location. The distance from the user office location to the DNS Recursive Resolver server location is then calculated. This is shown as a network insight if the distance is greater than 500 miles (800 kilometers).
The location looked up from the network egress IP Address may not be accurate and this would lead to a false result from this test. To validate if this error is occurring for a specific IP Address, you can use publicly accessible network IP Address location web sites.
This network insight will specifically impact the selection of the Exchange Online service front door. To address this insight local and direct network egress should be a pre-requisite and then DNS Recursive Resolver should be located close to that network egress.
Exchange Online
This section shows test results related to Exchange Online.
Exchange service front door location
The in-use Exchange service front door is identified in the same way that Outlook does this and we measure the network TCP latency from the user location to it. The TCP latency is shown and the in-use Exchange service front door is compared to the list of best service front doors for the current location. This is shown as a network insight if one of the best Exchange service front door(s) isn’t in use.
Not using one of the best Exchange service front door(s) could be caused by network backhaul before the corporate network egress in which case we recommend local and direct network egress. It could also be caused by use of a remote DNS recursive resolver server in which case we recommend aligning the DNS recursive resolver server with the network egress.
We calculate a potential improvement in TCP latency (ms) to the Exchange service front door. This is done by looking at the tested user office location network latency and subtracting the network latency from the current location to the closets Exchange service front door. The difference represents the potential opportunity for improvement.
Best Exchange service front door(s) for your location
This lists the best Exchange service front door locations by city for your location.
Service front door recorded in the client DNS
This shows the DNS name and IP Address of the Exchange service front door server that you were directed to. It’s provided for information only and there’s no associated network insight.
SharePoint Online
This section shows test results related to SharePoint Online and OneDrive.
The service front door location
The in-use SharePoint service front door is identified in the same way that the OneDrive client does and we measure the network TCP latency from the user office location to it.
Download speed
We measure the download speed for a 15 Mb file from the SharePoint service front door. The result is shown in megabytes per second to indicate what size file in megabytes can be downloaded from SharePoint or OneDrive in one second. The number should be similar to one tenth of the minimum circuit bandwidth in megabits per second. For example if you have a 100mbps internet connection, you may expect 10 megabytes per second (10 MBps).
Buffer bloat
During the 15Mb download we measure the TCP latency to the SharePoint service front door. This is the latency under load and it’s compared to the latency when not under load. The increase in latency when under load is often attributable to consumer network device buffers being loaded (or bloated). A network insight is shown for any bloat of 100ms or more.
Service front door recorded in the client DNS
This shows the DNS name and IP Address of the SharePoint service front door server that you were directed to. It’s provided for information only and there’s no associated network insight.
Microsoft Teams
This section shows test results related to Microsoft Teams.
Media connectivity (audio, video, and application sharing)
This tests for UDP connectivity to the Microsoft Teams service front door. If this is blocked, then Microsoft Teams may still work using TCP, but audio and video will be impaired. Read more about these UDP network measurements, which also apply to Microsoft Teams at Media Quality and Network Connectivity Performance in Skype for Business Online.
Packet loss
Shows the UDP packet loss measured in a 10-second test audio call from the client to the Microsoft Teams service front door. This should be lower than 1.00% for a pass.
Latency
Shows the measured UDP latency, which should be lower than 100ms.
Jitter
Shows the measured UDP jitter, which should be lower than 30ms.
Connectivity
We test for HTTP connectivity from the user office location to all of the required Microsoft 365 network endpoints. These are published at https://aka.ms/o365ip. A network insight is shown for any required network endpoints, which cannot be connected to.
Connectivity may be blocked by a proxy server, a firewall, or another network security device on the enterprise network perimeter. Connectivity to TCP port 80 is tested with an HTTP request and connectivity to TCP port 443 is tested with an HTTPS request. If there’s no response the FQDN is marked as a failure. If there’s an HTTP response code 407 the FQDN is marked as a failure. If there’s an HTTP response code 403 then we check the Server attribute of the response and if it appears to be a proxy server we mark this as a failure. You can simulate the tests we perform with the Windows command-line tool curl.exe.
We test the SSL certificate at each required Microsoft 365 network endpoint that is in the optimize or allow category as defined at https://aka.ms/o365ip. If any tests do not find a Microsoft SSL certificate, then the encrypted network connected must have been intercepted by an intermediary network device. A network insight is shown on any intercepted encrypted network endpoints.
Where an SSL certificate is found that isn’t provided by Microsoft, we show the FQDN for the test and the in-use SSL certificate owner. This SSL certificate owner may be a proxy server vendor, or it may be an enterprise self-signed certificate.
Network path
This section shows the results of an ICMP traceroute to the Exchange Online service front door, the SharePoint Online service front door, and the Microsoft Teams service front door. It’s provided for information only and there’s no associated network insight. There are three traceroutes provided. A traceroute to outlook.office365.com, a traceroute to the customers SharePoint front end or to microsoft.sharepoint.com if one was not provided, and a traceroute to world.tr.teams.microsoft.com.
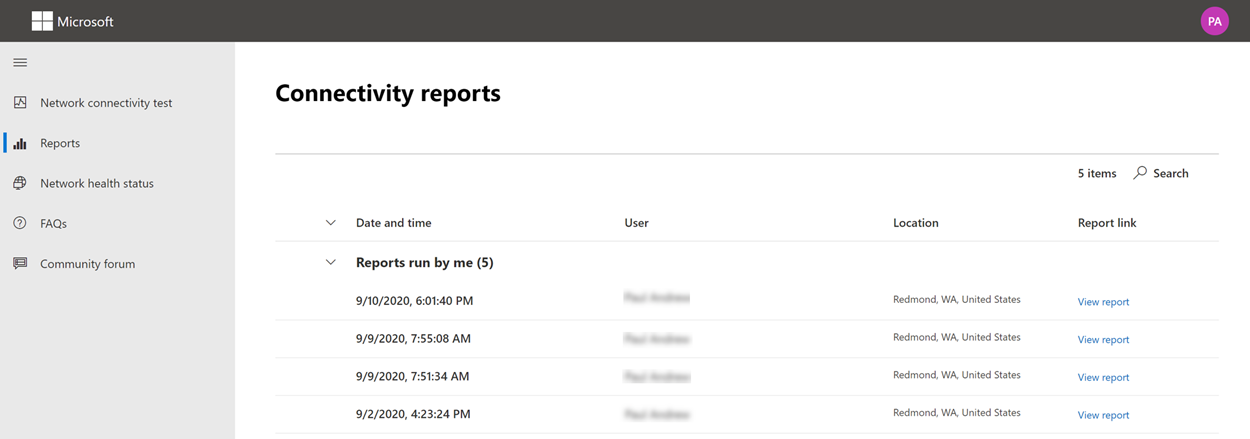
Connectivity reports
When you are signed in you can review previous reports that you have run. You can also share them or delete them from the list.
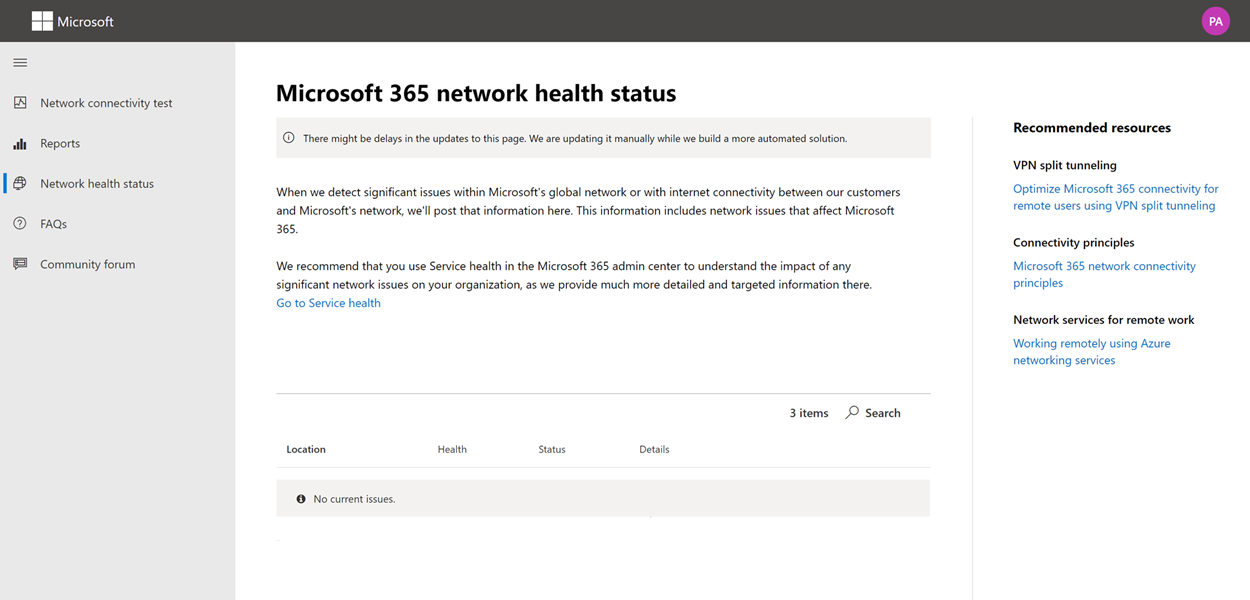
Network health status
This shows any significant health issues with Microsoft’s global network, which might impact Microsoft 365 customers.
Testing from the Command Line
We provide a command line executable that can be used by your remote deployment and execution tools and run the same tests as are available in the Microsoft 365 network connectivity test tool web site.
The command line test tool can be downloaded here: Command Line Tool
You can run it by double clicking the executable in Windows File Explorer, or you can start it from a command prompt, or you can schedule it with task scheduler.
The first time you launch the executable you will be prompted to accept the end user license agreement (EULA) before testing is performed. If you have already read and accepted the EULA you can create an empty file called Microsoft-365-Network-Connectivity-Test-EULA-accepted.txt in the current working directory for the executable process when it is launched. To accept the EULA you can type ‘y’ and press enter in the command line window when prompted.
The executable accepts the following command line parameters:
-h to show a link to this help documentation
-testlist <test> Specifies tests to run. By default only basic tests are run. Valid test names include: all, dnsConnectivityPerf, dnsResolverIdentification, bufferBloat, traceroute, proxy, vpn, skype, connectivity, networkInterface
-filepath <filedir> Directory path of test result files. Allowed value is absolute or relative path of an accessible directory
-city <city> For the city, state, and country fields the specified value will be used if provided. If not provided then Windows Location Services (WLS) will be queried. If WLS fails the location will be detected fromthe machines network egress
-state <state>
-country <country>
-proxy <account> <password> Proxy account name and password can be provided if you require a proxy to access the Internet
Results
Output of results are written to a JSON file in a folder called TestResults which is created in the current working directory of the process unless it already exists. The filename format for the output is connectivity_test_result_YYYY-MM-DD-HH-MM-SS.json. The results are in JSON nodes that match the output shown on the web page for the Microsoft 365 network connectivity test tool web site. A new result file is created each time you run it and the standalone executable does not upload results to your Microsoft tenant for viewing in the Admin Center Network Connectivity pages. Front door codes, longitudes, and latitudes are not included in the result file.
Launching from Windows File Explorer
You can simply double click on the executable to start the testing and a command prompt window will appear.
Launching from the Command Prompt
On a CMD.EXE command prompt window you can type the path and name of the executable to run it. The filename is Microsoft.Connectivity.Test.exe
Launching from Windows Task Scheduler
In Windows Task Scheduler you can add a task to launch the standalone test executable. You should specify the current working directory of the task to be where you have created the EULA accepted file since the executable will block until the EULA is accepted. You cannot interactively accept the EULA if the process is started in the background with no console.
More details on the standalone executable
The commandline tool uses Windows Location Services to find the users City State Country information for determining some distances. If Windows Location Services is disabled in the control panel then user location based assessments will be blank. In Windows Settings “Location services” must be on and “Let desktop apps access your location” must also be on.
The commandline tool will attempt to install the .NET Framework if it is not already installed. It will also download the main testing executable from the Microsoft 365 network connectivity test tool and launch that.
Test using the Microsoft Support and Recovery Assistant
Microsoft Support and Recovery Assistant (Assistant) automates all the steps required to execute the command-line version of the Microsoft 365 network connectivity test tool on a user’s machine and creates a report similar to the one created by the web version of the connectivity test tool. Note, the Assistant runs the command line version of Microsoft 365 network connectivity test tool to produce the same JSON result file, but the JSON file is converted into .CSV file format.
The reports will be available on the below screen once the Assistant has finished scanning the user’s machine. To access these reports, simply click on the “View log” option to view them.
Connectivity test results and Telemetry data are collected and uploaded to the uploadlogs folder. To access this folder, use one of the following methods:
Open Run (Windows logo key + R), and run the %localappdata%/saralogs/uploadlogs command as follows:
In File Explorer, type C:\Users<UserName>\AppData\Local\saralogs\uploadlogs and press Enter as follows:
Note: <UserName> is the user’s Windows profile name. To view the information about the test results and telemetry, double-click and open the files.
Types of result files
Microsoft Support and Recovery Assistant creates 2 files:
Network Connectivity Report (CSV) This report runs the raw JSON file against a rule engine to make sure defined thresholds are being met and if they are not met a “warning” or “error” is displayed in the output column of the CSV file. You can view the NetworkConnectivityReport.csv file to be informed about any detected issues or defects. Please see What happens at each test step for details on each test and the thresholds for warnings.
Network Connectivity Scan Report (JSON) This file provides the raw output test results from the command-line version of the Microsoft 365 network connectivity test tool (MicrosoftConnectivityTest.exe).
FAQ
Here are answers to some of our frequently asked questions.
What is required to run the advanced test client?
The advanced test client requires .NET 6.0 Runtime. If you run the advanced test client without that installed you will be directed to the .NET 6.0 installer page. Be sure to install from the Run desktop apps column for Windows. Administrator permissions on the machine are required to install .NET 6.0 Runtime.
The advanced test client uses SignalR to communicate to the web page. For this you must ensure that TCP port 443 connectivity to connectivity.service.signalr.net is open. This URL isn’t published in the https://aka.ms/o365ip because that connectivity isn’t required for a Microsoft 365 client application user.
What is Microsoft 365 service front door?
The Microsoft 365 service front door is an entry point on Microsoft’s global network where Office clients and services terminate their network connection. For an optimal network connection to Microsoft 365, It’s recommended that your network connection is terminated into the closest Microsoft 365 front door in your city or metro.
Note
Microsoft 365 service front door has no direct relationship to the Azure Front Door Service product available in the Azure marketplace.
What is the best Microsoft 365 service front door?
A best Microsoft 365 service front door (formerly known as an optimal service front door) is one that is closest to your network egress, generally in your city or metro area. Use the Microsoft 365 network performance tool to determine location of your in-use Microsoft 365 service front door and the best service front door(s). If the tool determines your in-use front door is one of the best ones, then you should expect great connectivity into Microsoft’s global network.
What is an internet egress location?
The internet egress Location is the location where your network traffic exits your enterprise network and connects to the Internet. This is also identified as the location where you have a Network Address Translation (NAT) device and usually where you connect with an Internet Service Provider (ISP). If you see a long distance between your location and your internet egress location, then this may identify a significant WAN backhaul.
Reverse-engineering reveals close similarities to BlackMatter ransomware, with some improvements
A postmortem analysis of multiple incidents in which attackers eventually launched the latest version of LockBit ransomware (known variously as LockBit 3.0 or ‘LockBit Black’), revealed the tooling used by at least one affiliate. Sophos’ Managed Detection and Response (MDR) team has observed both ransomware affiliates and legitimate penetration testers use the same collection of tooling over the past 3 months.
Leaked data about LockBit that showed the backend controls for the ransomware also seems to indicate that the creators have begun experimenting with the use of scripting that would allow the malware to “self-spread” using Windows Group Policy Objects (GPO) or the tool PSExec, potentially making it easier for the malware to laterally move and infect computers without the need for affiliates to know how to take advantage of these features for themselves, potentially speeding up the time it takes them to deploy the ransomware and encrypt targets.
A reverse-engineering analysis of the LockBit functionality shows that the ransomware has carried over most of its functionality from LockBit 2.0 and adopted new behaviors that make it more difficult to analyze by researchers. For instance, in some cases it now requires the affiliate to use a 32-character ‘password’ in the command line of the ransomware binary when launched, or else it won’t run, though not all the samples we looked at required the password.
We also observed that the ransomware runs with LocalServiceNetworkRestricted permissions, so it does not need full Administrator-level access to do its damage (supporting observations of the malware made by other researchers).
Most notably, we’ve observed (along with other researchers) that many LockBit 3.0 features and subroutines appear to have been lifted directly from BlackMatter ransomware.
Is LockBit 3.0 just ‘improved’ BlackMatter?
Other researchers previously noted that LockBit 3.0 appears to have adopted (or heavily borrowed) several concepts and techniques from the BlackMatter ransomware family.
We dug into this ourselves, and found a number of similarities which strongly suggest that LockBit 3.0 reuses code from BlackMatter.
Anti-debugging trick
Blackmatter and Lockbit 3.0 use a specific trick to conceal their internal functions calls from researchers. In both cases, the ransomware loads/resolves a Windows DLL from its hash tables, which are based on ROT13.
It will try to get pointers from the functions it needs by searching the PEB (Process Environment Block) of the module. It will then look for a specific binary data marker in the code (0xABABABAB) at the end of the heap; if it finds this marker, it means someone is debugging the code, and it doesn’t save the pointer, so the ransomware quits.
After these checks, it will create a special stub for each API it requires. There are five different types of stubs that can be created (randomly). Each stub is a small piece of shellcode that performs API hash resolution on the fly and jumps to the API address in memory. This adds some difficulties while reversing using a debugger.
The first stub, as an example (decoded with CyberChef)
Obfuscation of strings
Many strings in both LockBit 3.0 and BlackMatter are obfuscated, resolved during runtime by pushing the obfuscated strings on to the stack and decrypting with an XOR function. In both LockBit and BlackMatter, the code to achieve this is very similar.
Georgia Tech student Chuong Dong analyzed BlackMatter and showed this feature on his blog, with the screenshot above.
LockBit’s string obfuscation, in comparison
By comparison, LockBit 3.0 has adopted a string obfuscation method that looks and works in a very similar fashion to BlackMatter’s function.
API resolution
LockBit uses exactly the same implementation as BlackMatter to resolve API calls, with one exception: LockBit adds an extra step in an attempt to conceal the function from debuggers.
BlackMatter’s dynamic API resolution (image credit: Chuong Dong)
The array of calls performs precisely the same function in LockBit 3.0.
LockBit’s dynamic API resolution
Hiding threads
Both LockBit and BlackMatter hide threads using the NtSetInformationThread function, with the parameter ThreadHideFromDebugger. As you probably can guess, this means that the debugger doesn’t receive events related to this thread.
LockBit employs the same ThreadHideFromDebugger feature as an evasion technique
Printing
LockBit, like BlackMatter, sends ransom notes to available printers.
LockBit can send its ransom notes directly to printers, as BlackMatter can do
Deletion of shadow copies
Both ransomware will sabotage the infected computer’s ability to recover from file encryption by deleting the Volume Shadow Copy files.
LockBit calls the IWbemLocator::ConnectServer method to connect with the local ROOT\CIMV2 namespace and obtain the pointer to an IWbemServices object that eventually calls IWbemServices::ExecQuery to execute the WQL query.
BlackMatter code for deleting shadow copies (image credit: Chuong Dong)
LockBit’s method of doing this is identical to BlackMatter’s implementation, except that it adds a bit of string obfuscation to the subroutine.
LockBit’s deletion of shadow copies
Enumerating DNS hostnames
Both LockBit and BlackMatter enumerate hostnames on the network by calling NetShareEnum.
BlackMatter calls NetShareEnum() to enumerate hostnames… (image credit: Chuong Dong)
In the source code for LockBit, the function looks like it has been copied, verbatim, from BlackMatter.
…as does LockBit
Determining the operating system version
Both ransomware strains use identical code to check the OS version – even using the same return codes (although this is a natural choice, since the return codes are hexadecimal representations of the version number).
BlackMatter’s code for checking the OS version (image credit: Chuong Dong)LockBit’s OS enumeration routine
Configuration
Both ransomware contain embedded configuration data inside their binary executables. We noted that LockBit decodes its config in a similar way to BlackMatter, albeit with some small differences.
For instance, BlackMatter saves its configuration in the .rsrc section, whereas LockBit stores it in .pdata.
And LockBit uses a different linear congruential generator (LCG) algorithm for decoding.
LockBit’s config decryption routine
Some researchers have speculated that the close relationship between the LockBit and BlackMatter code indicates that one or more of BlackMatter’s coders were recruited by LockBit; that LockBit bought the BlackMatter codebase; or a collaboration between developers. As we noted in our white paper on multiple attackers earlier this year, it’s not uncommon for ransomware groups to interact, either inadvertently or deliberately.
Either way, these findings are further evidence that the ransomware ecosystem is complex, and fluid. Groups reuse, borrow, or steal each other’s ideas, code, and tactics as it suits them. And, as the LockBit 3.0 leak site (containing, among other things, a bug bounty and a reward for “brilliant ideas”) suggests, that gang in particular is not averse to paying for innovation.
LockBit tooling mimics what legitimate pentesters would use
Another aspect of the way LockBit 3.0’s affiliates are deploying the ransomware shows that they’re becoming very difficult to distinguish from the work of a legitimate penetration tester – aside from the fact that legitimate penetration testers, of course, have been contracted by the targeted company beforehand, and are legally allowed to perform the pentest.
The tooling we observed the attackers using included a package from GitHub called Backstab. The primary function of Backstab is, as the name implies, to sabotage the tooling that analysts in security operations centers use to monitor for suspicious activity in real time. The utility uses Microsoft’s own Process Explorer driver (signed by Microsoft) to terminate protected anti-malware processes and disable EDR utilities. Both Sophos and other researchers have observed LockBit attackers using Cobalt Strike, which has become a nearly ubiquitous attack tool among ransomware threat actors, and directly manipulating Windows Defender to evade detection.
Further complicating the parentage of LockBit 3.0 is the fact that we also encountered attackers using a password-locked variant of the ransomware, called lbb_pass.exe , which has also been used by attackers that deploy REvil ransomware. This may suggest that there are threat actors affiliated with both groups, or that threat actors not affiliated with LockBit have taken advantage of the leaked LockBit 3.0 builder. At least one group, BlooDy, has reportedly used the builder, and if history is anything to go by, more may follow suit.
LockBit 3.0 attackers also used a number of publicly-available tools and utilities that are now commonplace among ransomware threat actors, including the anti-hooking utility GMER, a tool called AV Remover published by antimalware company ESET, and a number of PowerShell scripts designed to remove Sophos products from computers where Tamper Protection has either never been enabled, or has been disabled by the attackers after they obtained the credentials to the organization’s management console.
We also saw evidence the attackers used a tool called Netscan to probe the target’s network, and of course, the ubiquitous password-sniffer Mimikatz.
Incident response makes no distinction
Because these utilities are in widespread use, MDR and Rapid Response treats them all equally – as though an attack is underway – and immediately alerts the targets when they’re detected.
We found the attackers took advantage of less-than-ideal security measures in place on the targeted networks. As we mentioned in our Active Adversaries Report on multiple ransomware attackers, the lack of multifactor authentication (MFA) on critical internal logins (such as management consoles) permits an intruder to use tooling that can sniff or keystroke-capture administrators’ passwords and then gain access to that management console.
It’s safe to assume that experienced threat actors are at least as familiar with Sophos Central and other console tools as the legitimate users of those consoles, and they know exactly where to go to weaken or disable the endpoint protection software. In fact, in at least one incident involving a LockBit threat actor, we observed them downloading files which, from their names, appeared to be intended to remove Sophos protection: sophoscentralremoval-master.zip and sophos-removal-tool-master.zip. So protecting those admin logins is among the most critically important steps admins can take to defend their networks.
For a list of IOCs associated with LockBit 3.0, please see our GitHub.
Acknowledgments
Sophos X-Ops acknowledges the collaboration of Colin Cowie, Gabor Szappanos, Alex Vermaning, and Steeve Gaudreault in producing this report.
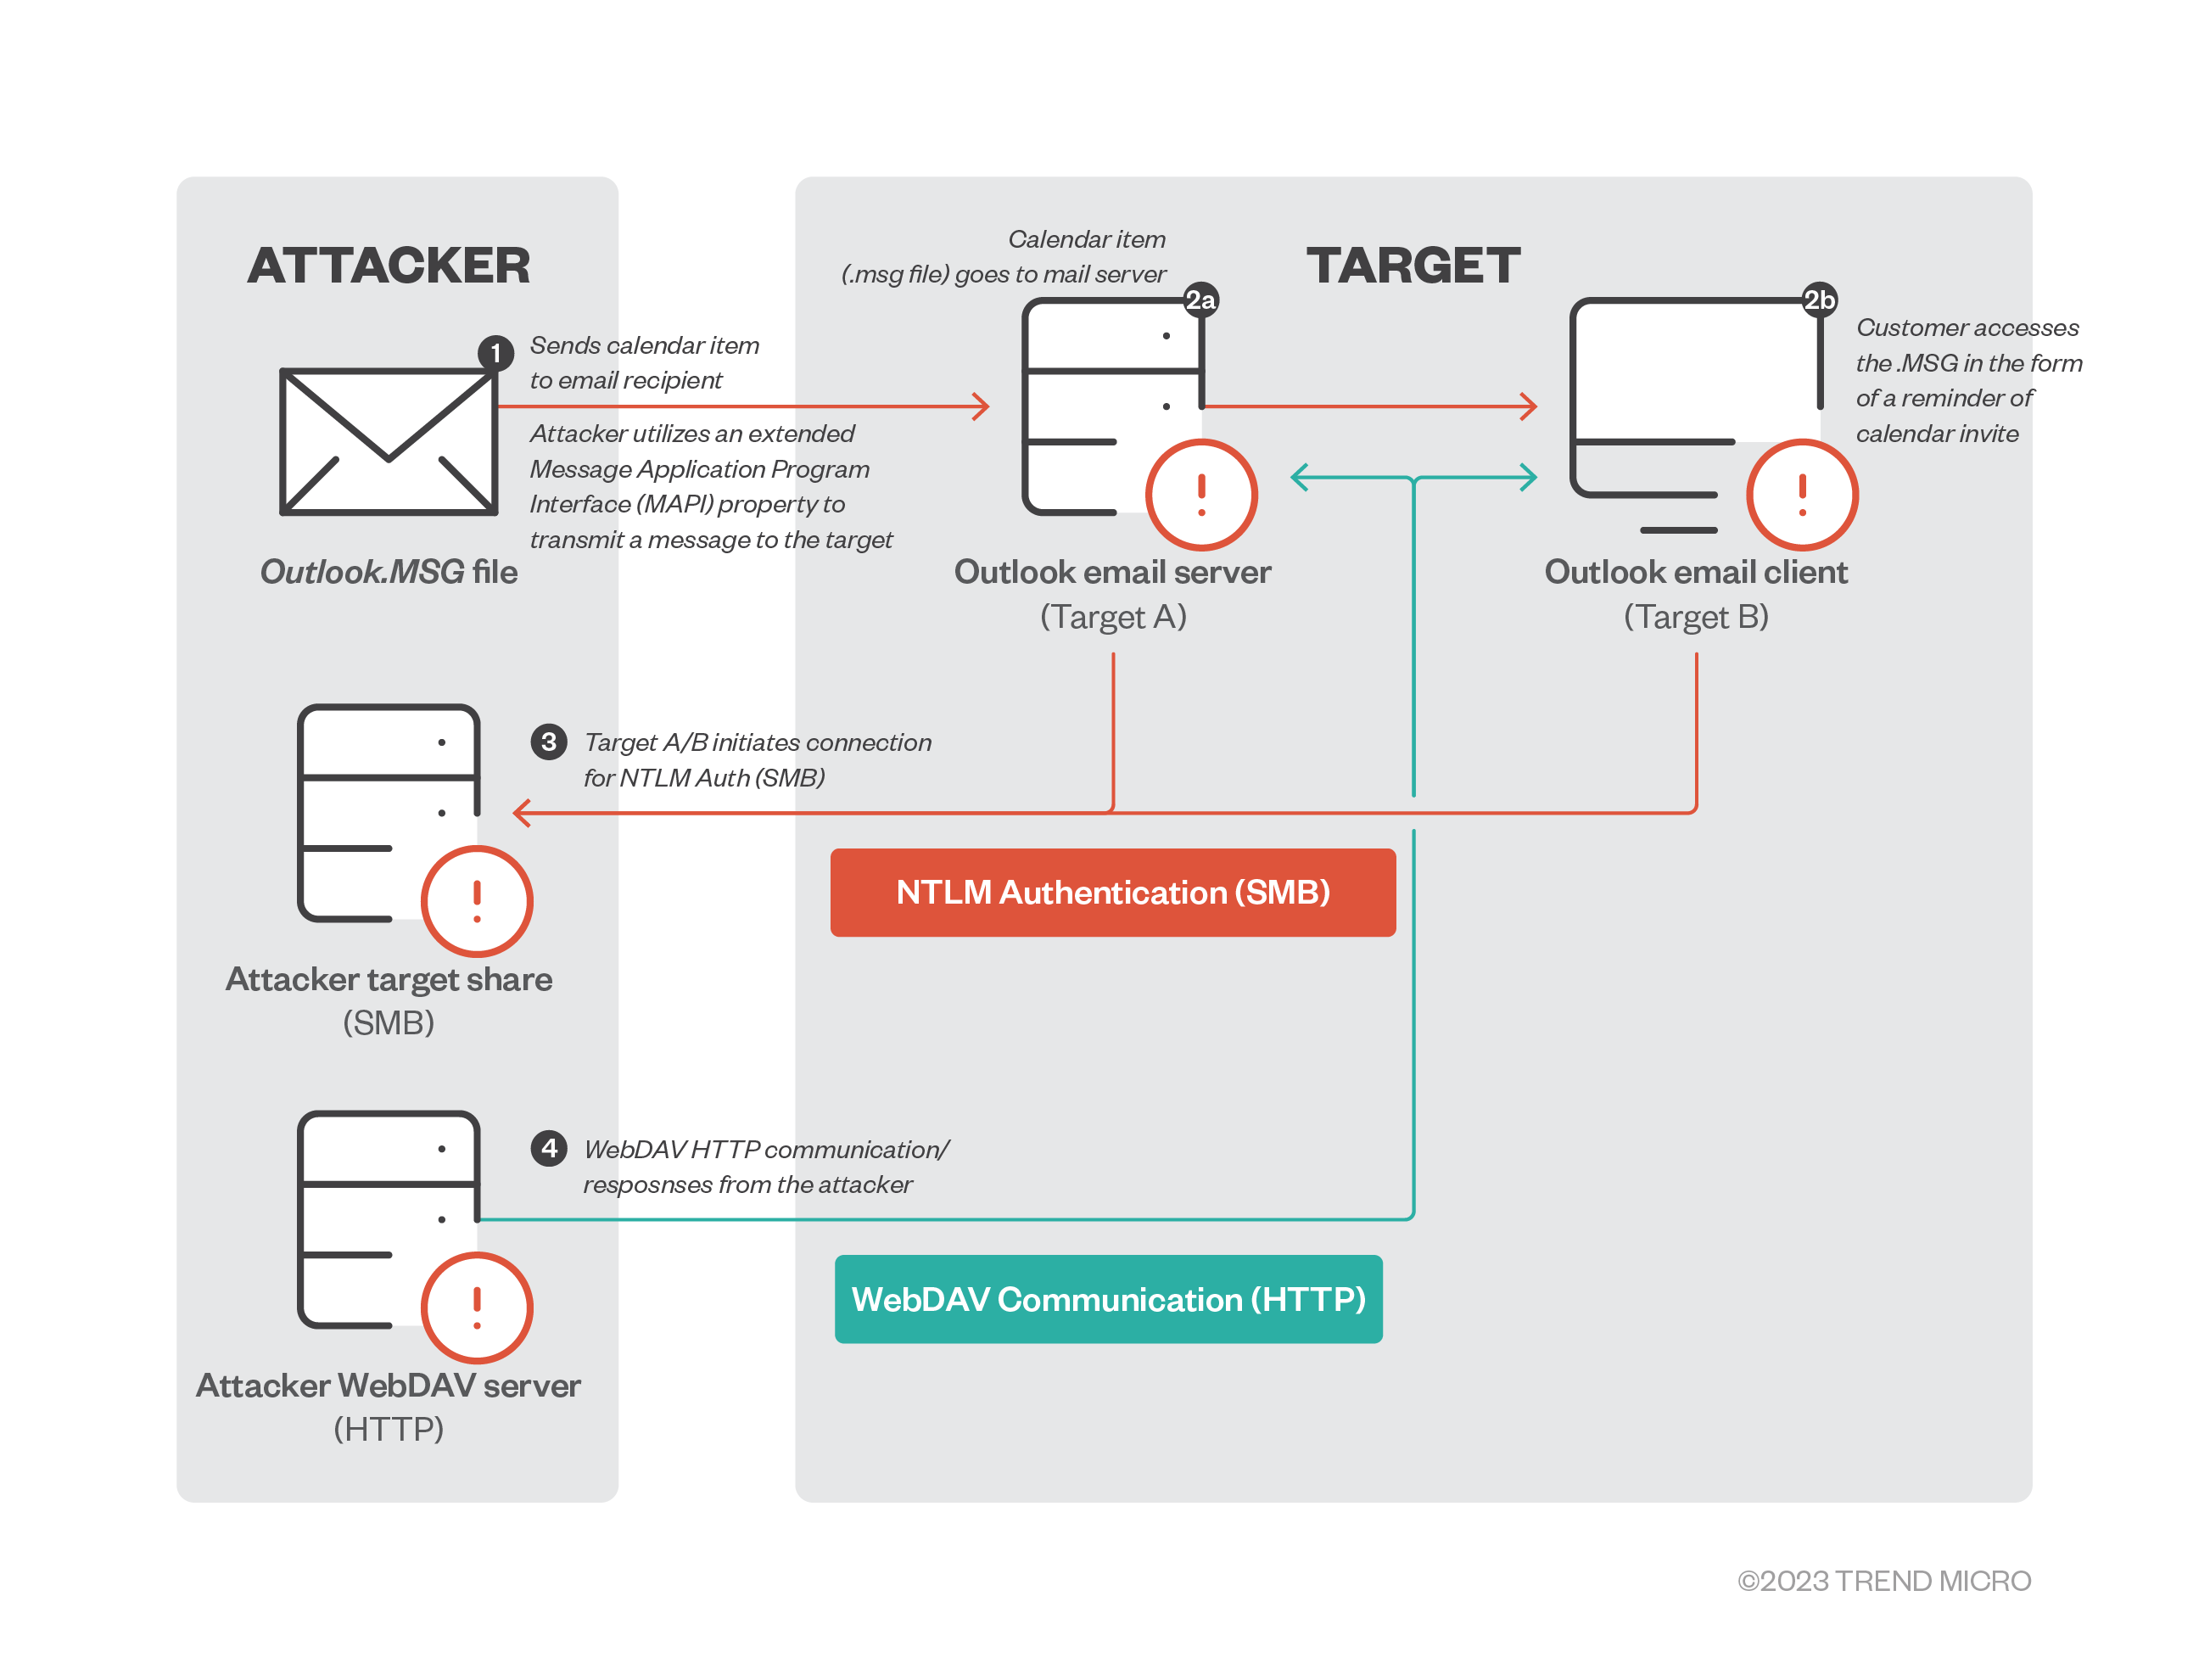
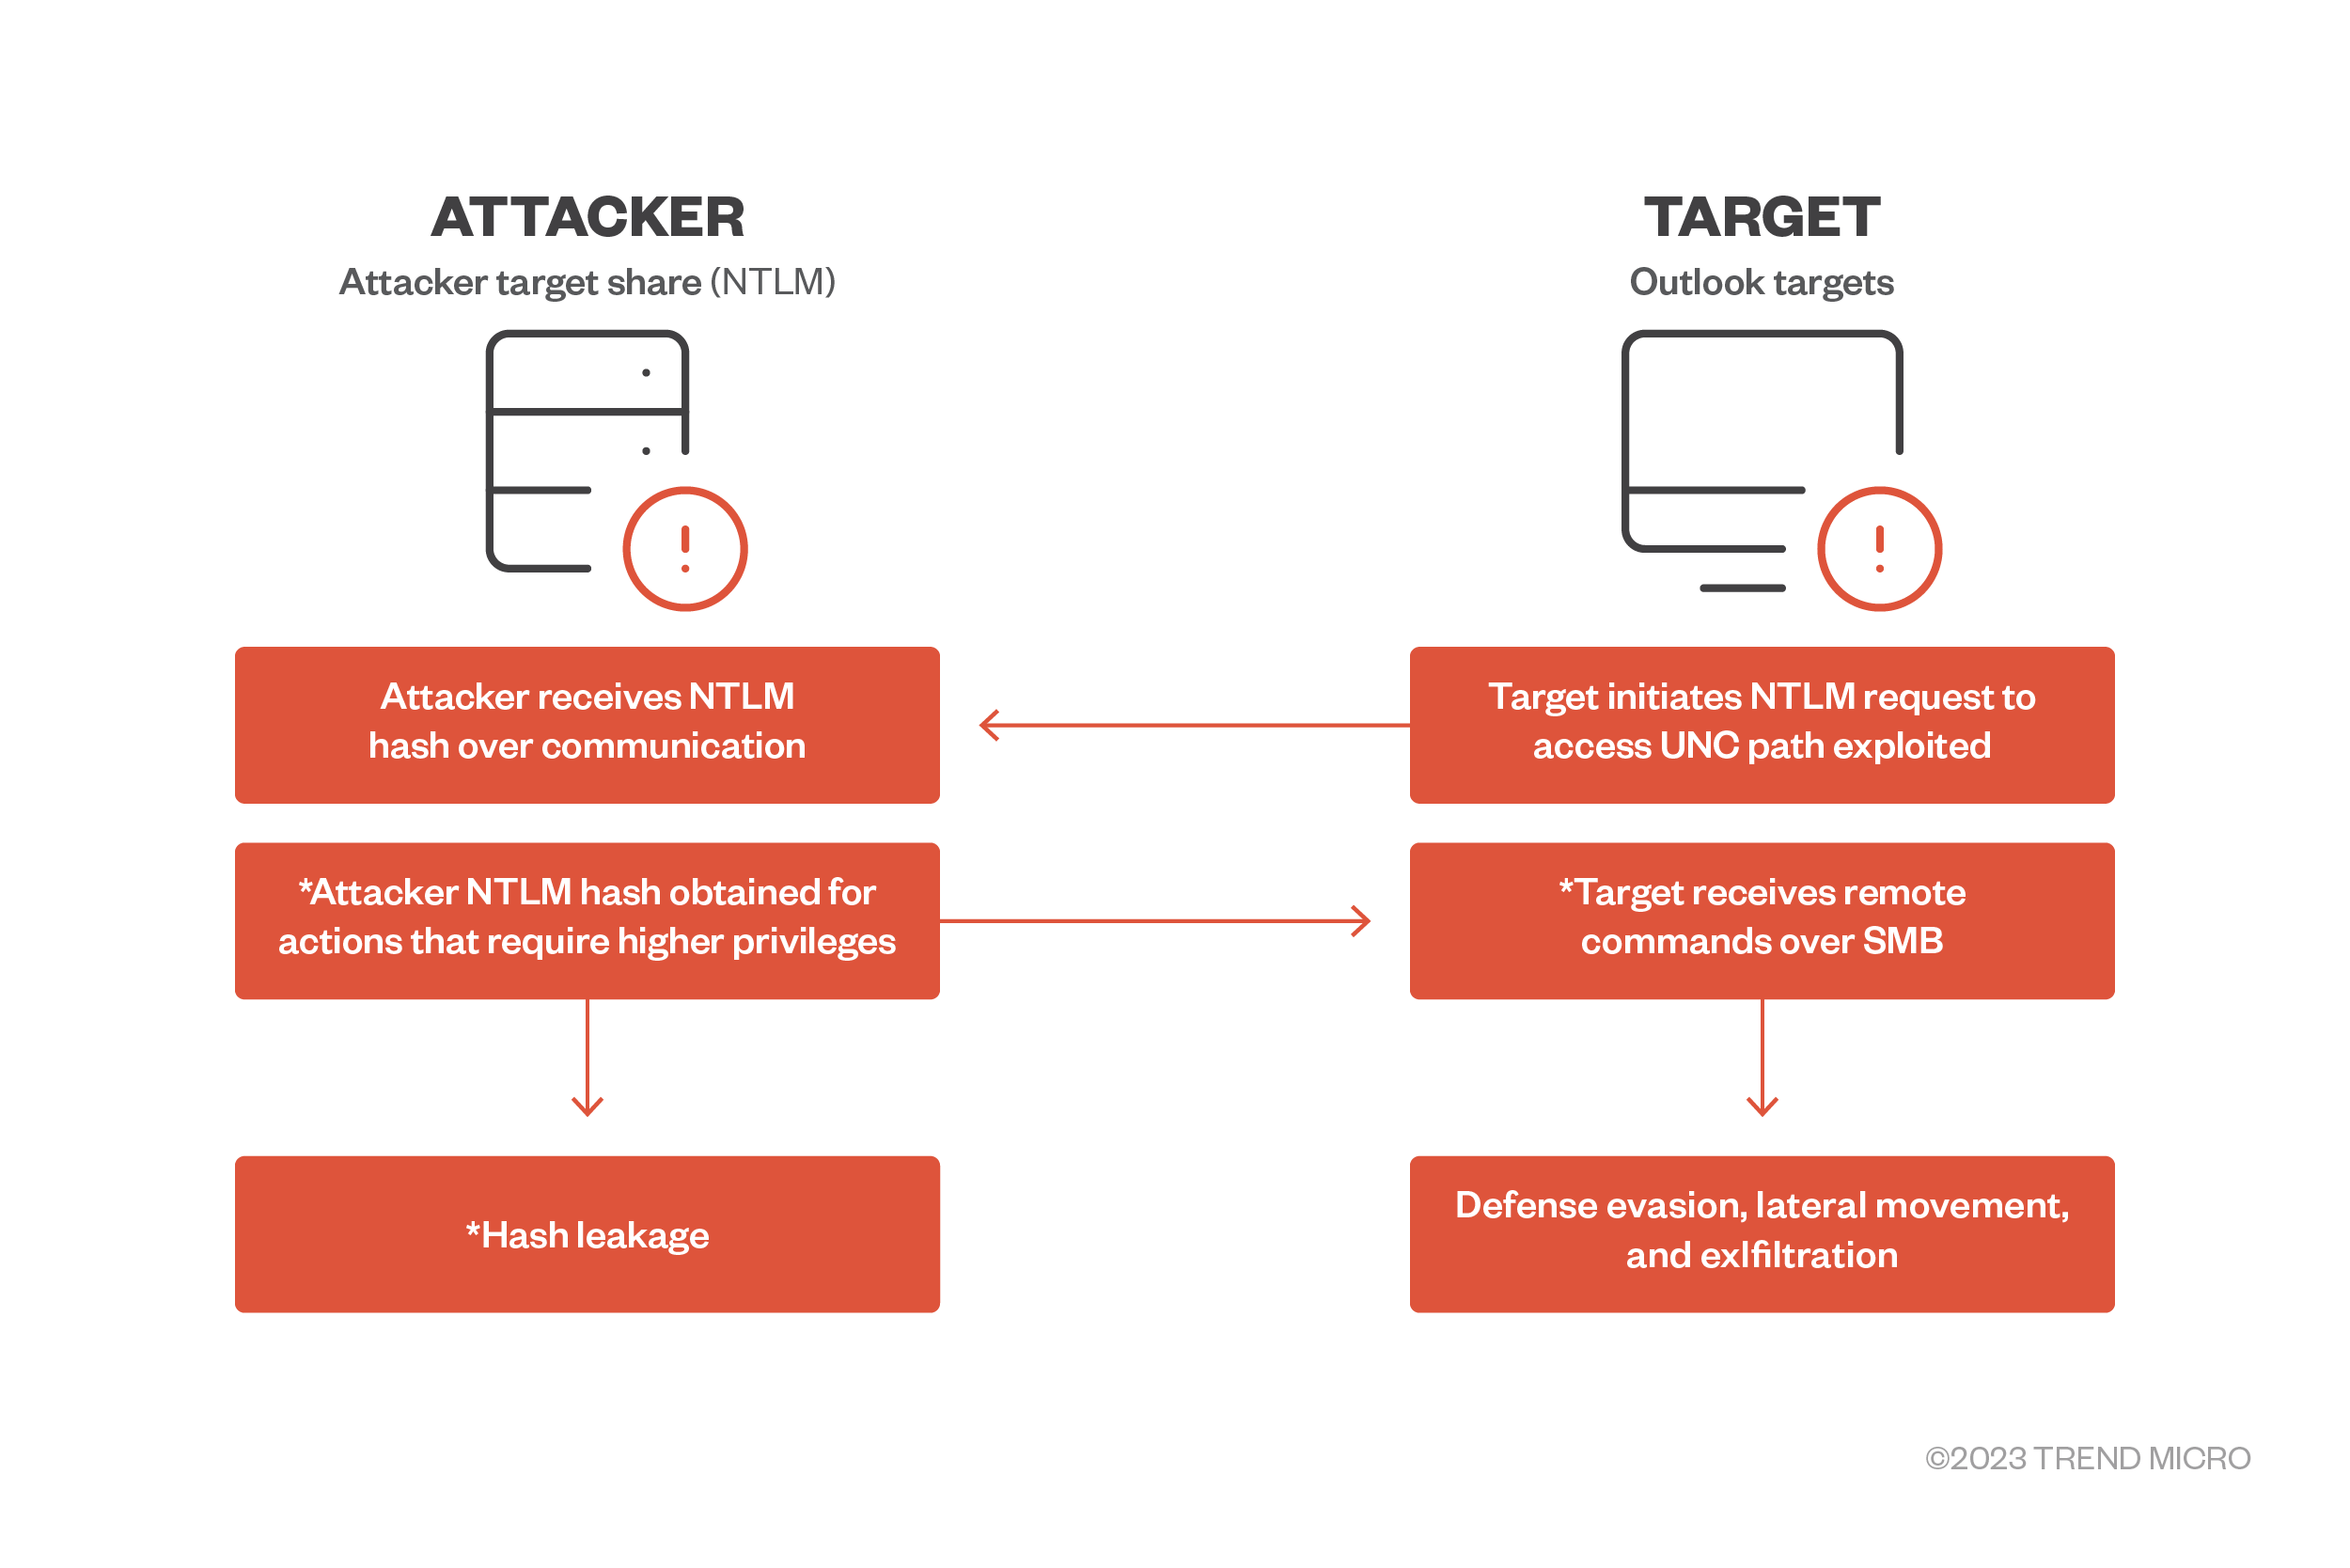
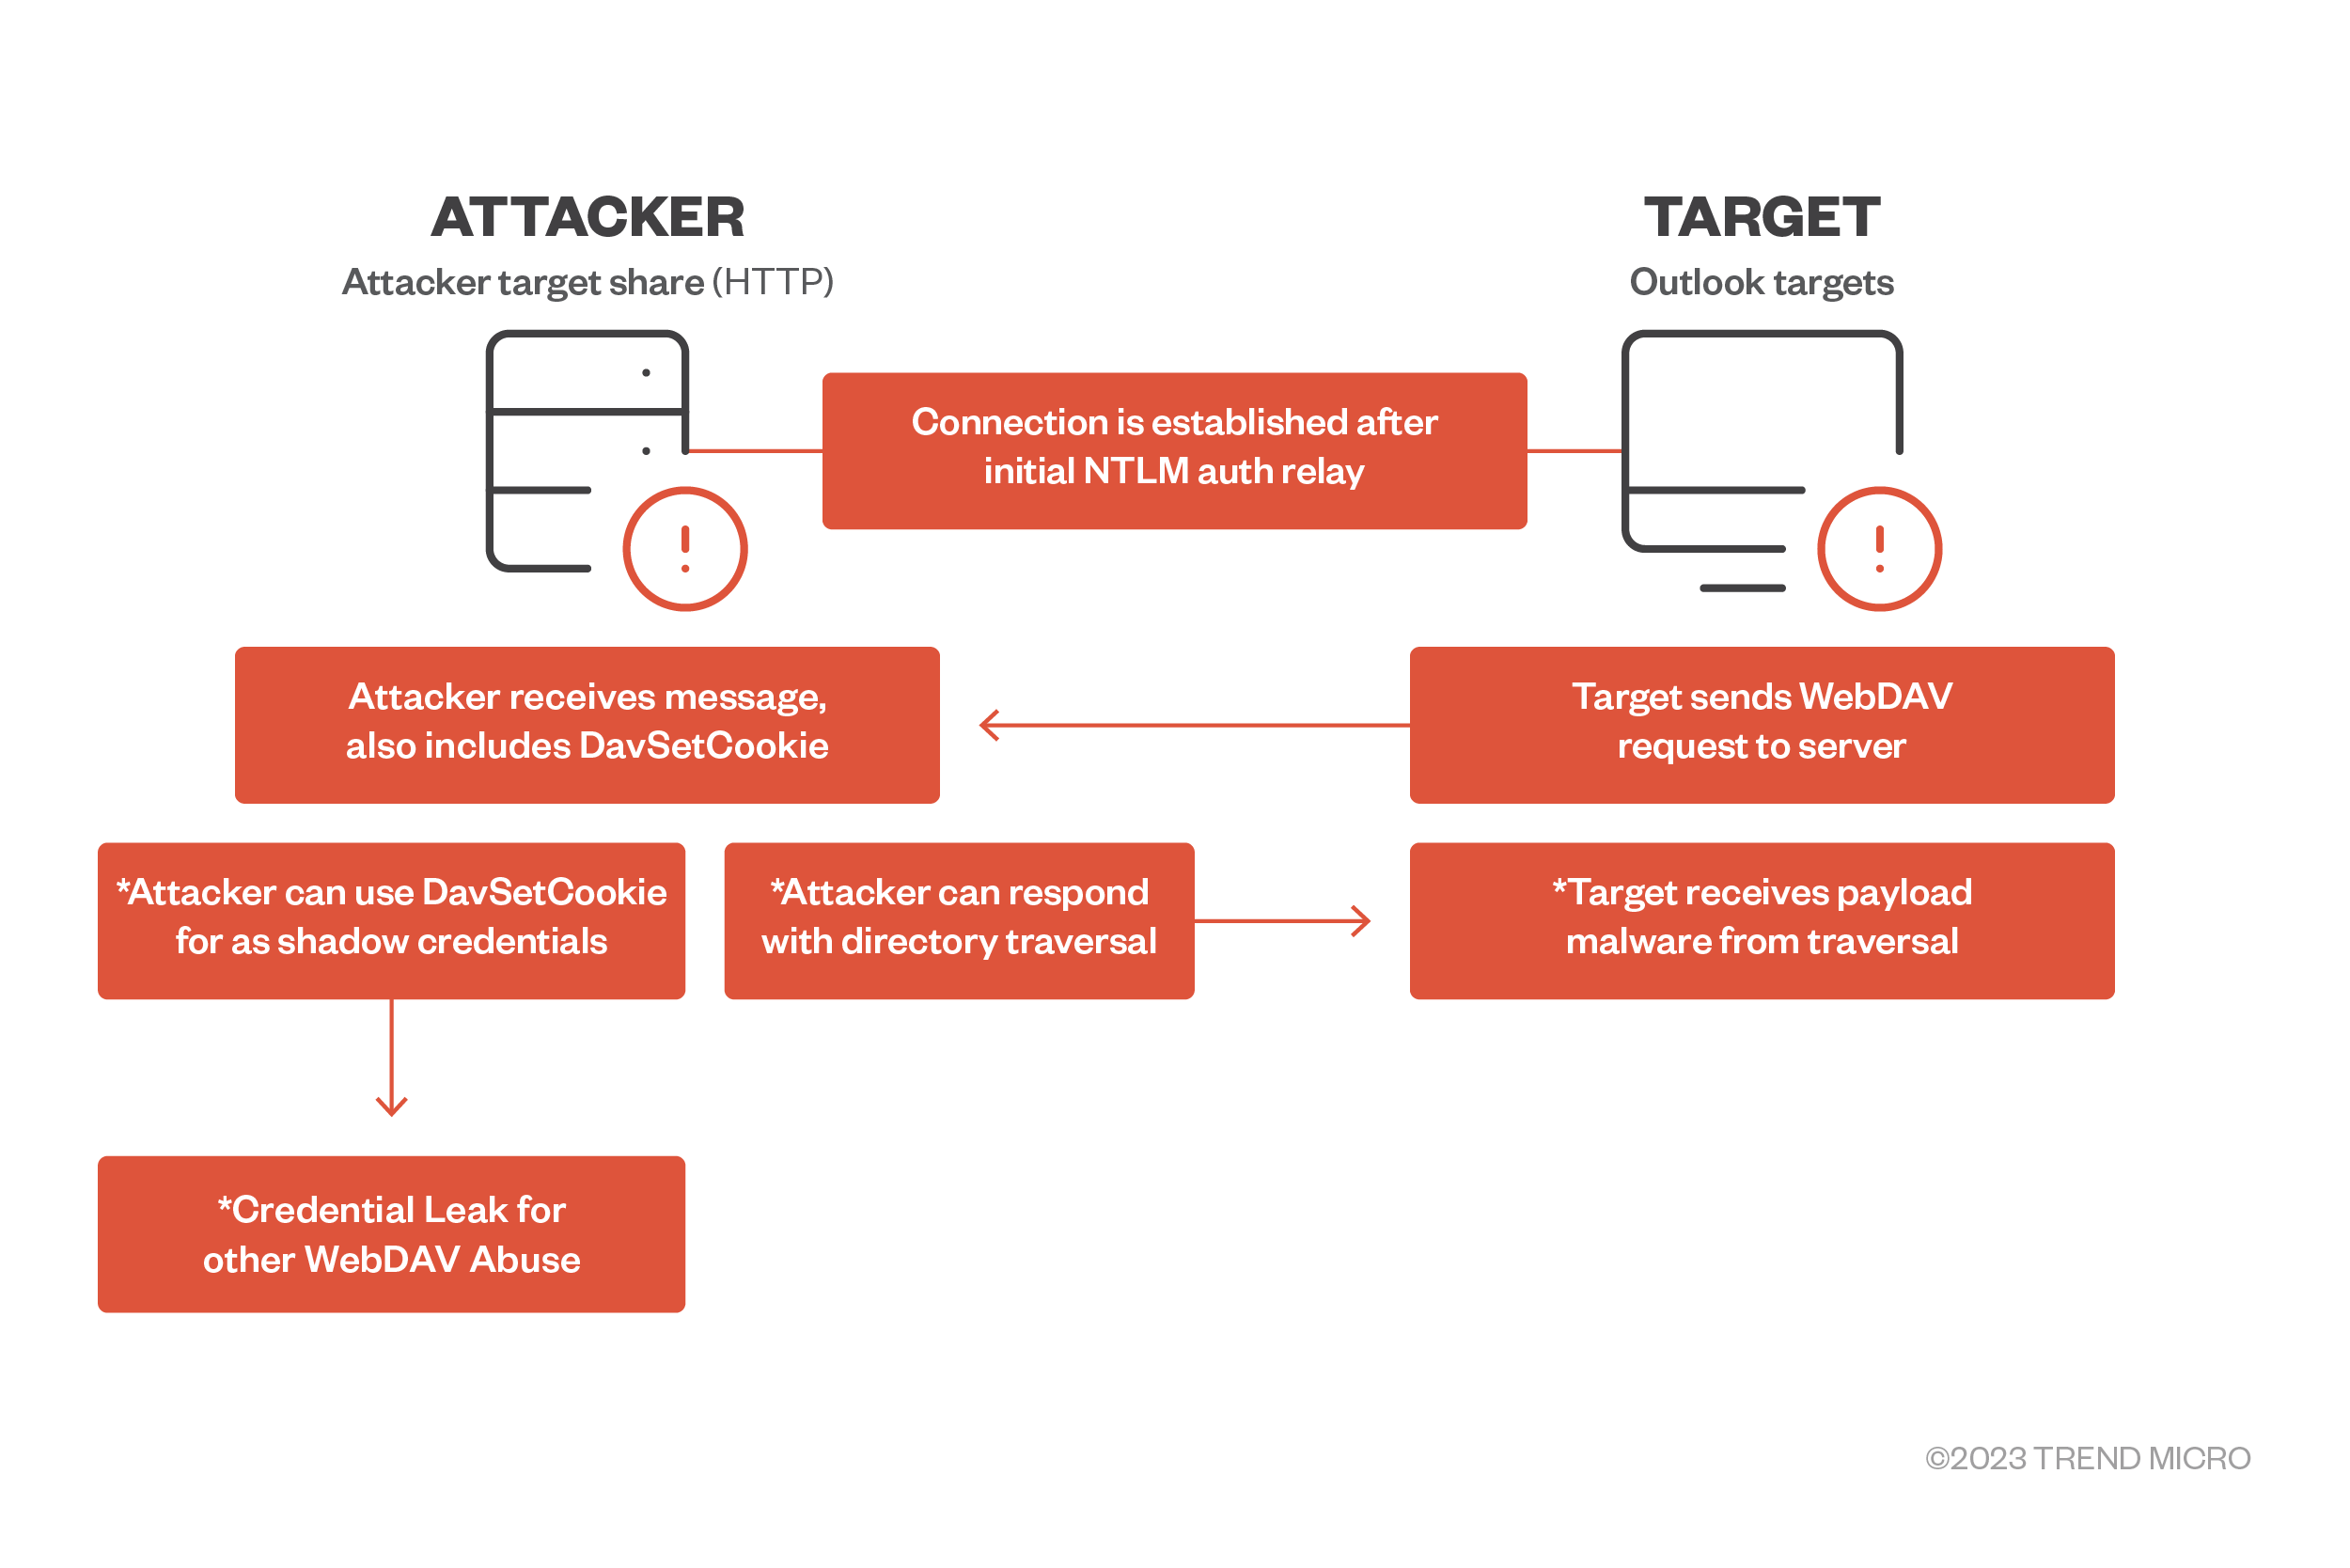


 NOTE: All the APIs required for configuring Port Forwarding will be listed in this Article.


 TIP: If you are creating only one Address Object then the First command should be sufficient, if you are creating multiple address objects then the second command should be used.
 CAUTION: I have the add.Json file saved on to my desktop and hence I was able to call it into the command, if you have created the Json the file in a different location then make sure you are executing the command from that location.