In this post, I will explore the TCP and UDP ports used by Active Directory from client to server.
I will use WireShark and a series of tests to determine what ports are used.
Tests I’ll be running:
- Ports Used When a User Logs into a Computer
- Ports used when running gpupdate
- Ports used when joining a computer to the domain
- Ports Used When Rebooting
Test Environment:
- Server 2022 with IP 192.168.100.10 (Active Directory Server)
- Windows 10 Pro with IP 192.168.100.20
- Wireshark is installed on the Active Directory server
- The Active Directory server is a default install
Ports Used by Active Directory Between Client and Server
This section is a summary of the ports used in all the tests.
- TCP 135 Microsoft RPC
- TCP/UDP 49152 – 65535 RPC Dynamic Ports
- TCP 88 Kerberos
- TCP 389 LDAP
- UDP 53 DNS
- TCP 445 SMB
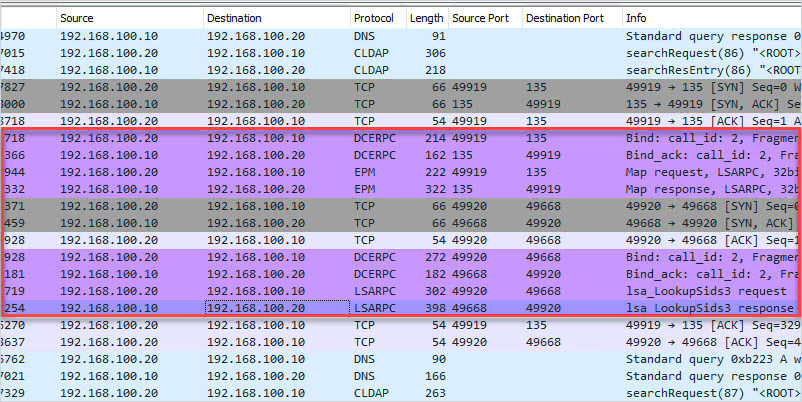
TCP 135 Microsoft RPC Mapper
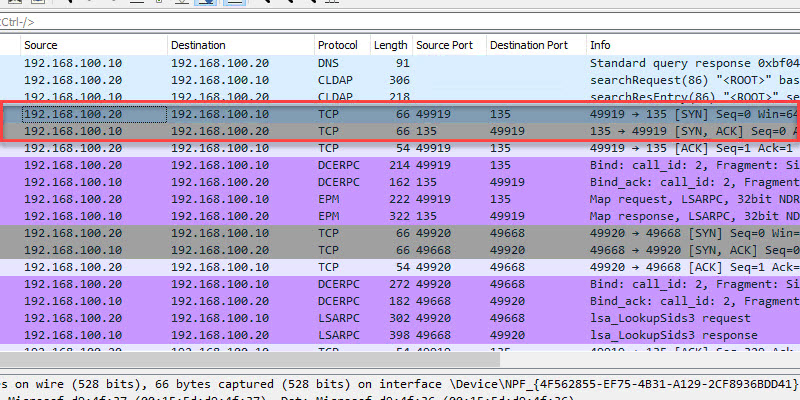
- Description: Port 135 is a critical client/server port. This port is used by many Microsoft services and should not be blocked by a firewall. First the client connects to the RPC mapper service (port 135) and asks the mapper what port a given service is listening on (which will be a dynamic port range… see below). The RPC mapper responds to the client with the port and then the client connects to that port. You can see this in the above screenshot.
- Firewall: Allow between client and server. Port 135 should not be exposed to the internet.
TCP/UDP 49152 – 65535 RPC Dynamic Ports
- Description: The dynamic port range is used by various server applications. RPC dynamic port allocation instructs the RPC program to use a particular random port in the range configured for TCP and UDP, based on the implementation of the operating system used. The RPC mapper (port 135) is used to connect clients to services running on these dynamic ports.
- Firewall: Allow between client and server. This port range should not be exposed to the internet.
we recommend that you reconfigure the firewalls to allow traffic between servers in the dynamic port range of 49152 through 65535. This range is in addition to well-known ports that are used by services and applications.
https://docs.microsoft.com/en-US/troubleshoot/windows-server/networking/default-dynamic-port-range-tcpip-chang
TCP 88 Kerberos
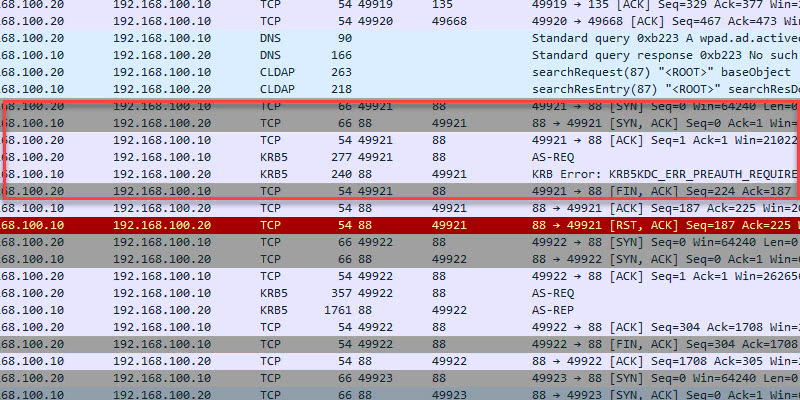
- Description: Kerberos is an authentication protocol that authenticates requests between a client and server in a secure manner. This is Microsoft Window’s default authentication method for domain-joined devices.
- Firewall: Allow between client and server. Port should not be exposed to the internet.
TCP 389 LDAP
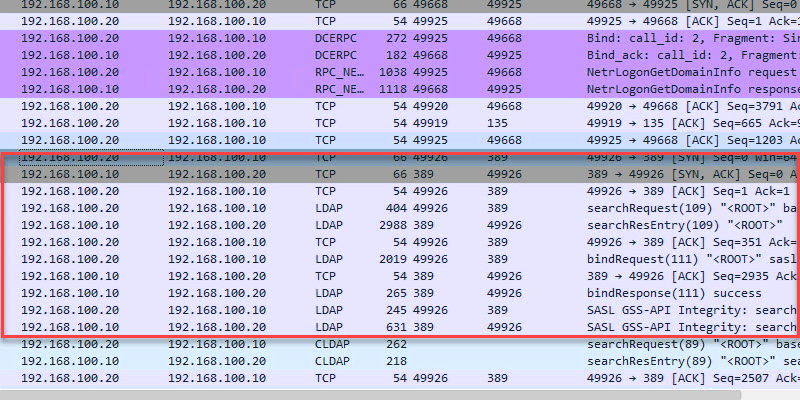
- Description: LDAP is a directory access protocol. This protocol is used to search, add/delete, authenticate and modify data in a Directory Server such as Active Directory.
- Firewall: Allow between client and server. Port should not be exposed to the internet.
UDP 53 DNS

- Description: DNS is a critical service used to map IP addresses to host names. This is a critical service used by clients to locate resource records in the domain and lookup external domain names.
- Firewall: Allow between client and server. If DNS is running on your Active Directory server I do not recommend exposing it to the internet.
TCP 445 SMB
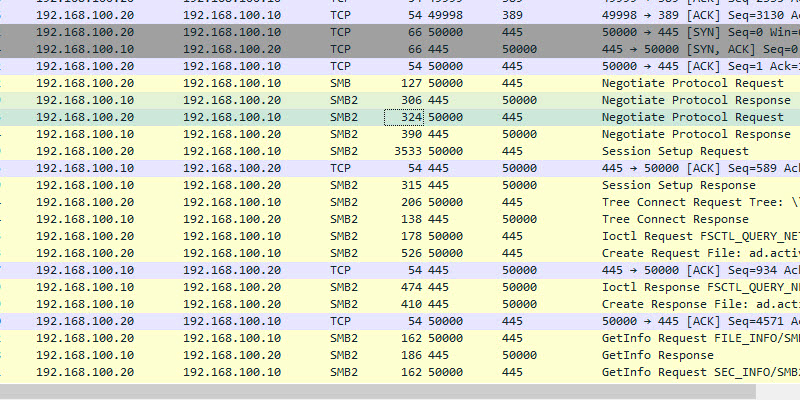
- Description: Server message blocks (SMB protocol) is a client-to-server communication protocol used for accessing files, printers, and data on a network. This port is used during startup to get GPO information, it is also used when running the gpupdate command.
- Firewall: Allow between client and server. Do not expose this port to the internet.
Ports Used When a User Logs into a Domain-Joined Computer
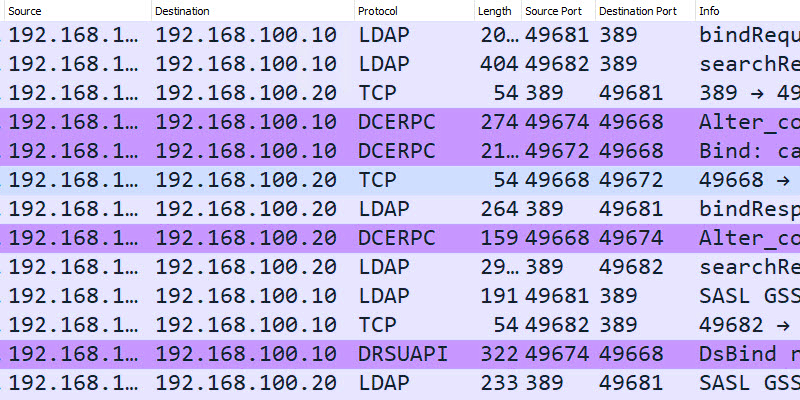
In this example, I will log into computer PC1 (192.168.100.20) and capture the network packets from the domain controller.
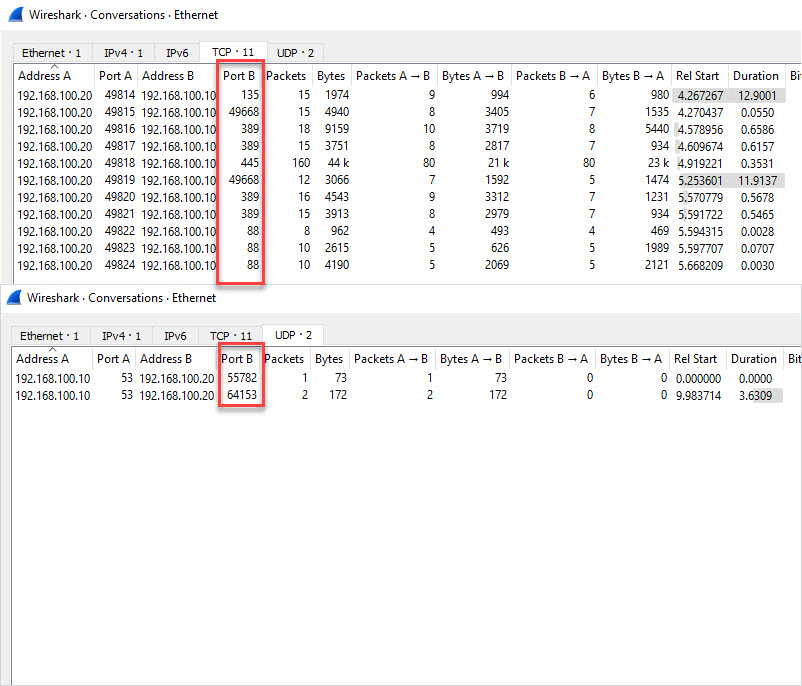
Here is a conversation view of the TCP/UDP ports used. This is traffic sent from the client to the domain controller and destination ports.
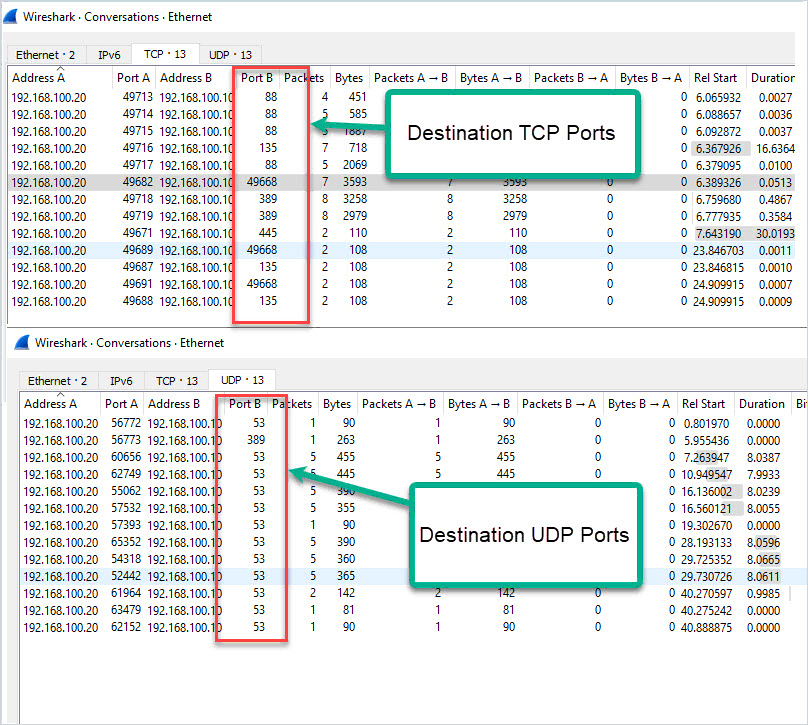
Here is a summary of the destination ports used by the client.
- TCP 88 (Kerberos)
- TCP 135 (Microsoft RPC)
- TCP 389 (LDAP)
- TCP 445 (Microsoft DS)
- TCP 49668 (RPC for LSA, SAM, NetLogon) – This starts with a request to port 135
- UDP 53 (DNS)
- UDP 389 (LDAP)
Ports Used When Running Gpupdate
While logged into the client PC I will run the gpupdate command to see what ports are used.
Results below. It Looks like TCP port 445 is used the most when running a gpupdate.
Ports Used When Joining a Computer to The Domain
This looked similar to the other packet captures.
TCP 88 (Kerberos)
TCP 135 (Microsoft RPC)
TCP 389 (LDAP)
TCP 445 (Microsoft DS)
TCP 49668 (RPC for LSA, SAM, NetLogon) – This starts with a request to port 135
UDP 53 (DNS)
Ports Used When Rebooting
Nothing new, I see the same ports used when compared to the other packet captures.
Hopefully, this guide helps you to understand the ports used between a client and an Active Directory server. Keep in mind this test was a default domain controller install with no additional services running, the more services you install the more ports that may be used.
Resources:
- Service overview and network port requirements for Windows
- Service Name and Transport Protocol Number Registry
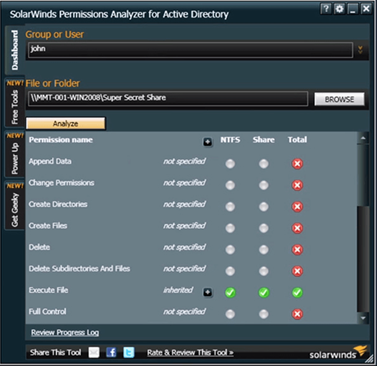
Recommended Tool: Permissions Analyzer for Active Directory
This FREE tool lets you get instant visibility into user and group permissions and allows you to quickly check user or group permissions for files, network, and folder shares.
You can analyze user permissions based on an individual user or group membership.
This is a Free tool, download your copy here.
1 thought on “Active Directory Ports Used Client to Server”
Source :
https://activedirectorypro.com/active-directory-ports-used-client-to-server/