QRescue is the data recovery tool for Qlocker-encrypted 7z files. It contains:
PhotoRec (Open Source Project / GNU General Public License / Project Link): File recovery software designed to recover lost files from hard disks and CD-ROMs, and lost pictures (thus the Photo Recovery name) from storage medium.
QRescue (Powered by QNAP): The script to recover file structures from the encrypted 7z files and PhotoRec files.
Prepare an external hard disk drive with a capacity larger than the total used storage space on your NAS.
Note: It’s advised to prepare an external HDD with 1.5 to 2x free space than the total used storage space on your NAS. Additional space might be required during the recovery process. If the available space is less than the suggested value, error and other issues may occur.
Part 1. Configure external HDD with the name “rescue” and create folders with the name “recup1” for recovery.
QRescue will process the recovery process to external drive first, and we need to do some configuration for this recovery process and create the specific destination and folder name.
You need to prepare an external HDD that its usable capacity is larger than the total used storage size of your NAS. This is because you will recover the files to the external device first. Please check your used volume size first by clicking More > About on the QTS desktop.
Insert the external drive to your NAS. Please go to Storage Manager > External Device > Select your external device > Click “Actions” > Click “Format” to format the external drive.
The File System must be “EXT4”, and the Label name must be key in “rescue”. If these configuration is ready, please click “Format” Notice: The QRescue app will use “rescue” as the external drive name. If you use other names, the recovery process might fail.
(Optional) If you disable the admin account or you don’t use admin to login QTS, you might not see the external drive on the File Station. Please go to Control Panel > Privilege > Shared Folder > Edit Shared Folder Permission to enable or change read / write permission for “rescue” folder and to match the account that you log in the NAS.
Sample: Grant other administrator group account (Example: “_qnap_support” is the administrator group account for read/write permission to external hard drive naming “rescue”).
Using File Station to check the volume for the correct external device name.
Create the new folder and name as “recup1” (format: recup+{number}). If you have more than one storage volume, you need to add more folders for recovery.
Notice: The QRescue app will use “recup+{number}” as the folder name. If you use other names, the recovery process might fail.Part 2. Download and Manually Install the QRescue AppThis QRescue app is a special build. Therefore, you need to manually install this app from the QTS App Center.
Please go to App Center > Click Install Manually > Click Browse to find the QRescue app location on your computer.
After selecting the app location, you can click Install. Wait until the installation completes and open the QRescue app on QTS desktop or side-bar.
When you open the QRescue app, you will see the web console. It can help to run PhotoRec and QRescue to recover your files.Part 3. Run PhotoRecRunning PhotoRec can help you to recover the lost files from hard disks to the external drive. Now you will recover the NAS files to the “recup1” (example: recup+{disk_number}) folder on the external drive.
Type this command and press Enter on your keyboard. You will start to run PhotoRec. Command: photorec
Use Up/Down arrows to choose the hard drive. And you can start to select the NAS disk for running recovery by PhotoRec.
Sample:
/dev/mapper/cachedev1 as 1st data volume
/dev/mapper/cachedev2 as 2nd data volume …
/dev/mapper/cachedev20 as 20th data volume
Note: You can check the number of data volumes in Storage & Snapshots > Storage/Snapshots
Select the “ext4” partition and press “Enter”
Select the file system as [ ext2/ext3 ] and click “Enter” key.
Select the space as [ Whole ] and click the “Enter” key.
Now we need to select the external device’s folder as the recovery destination.
Please click “C” on the keyboard when the destination is “/share/rescue/recup1”.
Start to run the recovery process by PhotoRec. Now you can see the estimated time to completion.
When you finish the PhotoRec, you can press enter when you select [Quit] or type in “ctrl-c” to exit. Part 4. Run QRescueRun QRescue can help you to recover the files retrieved by PhotoRec. Now you will recover the files from the “recup+{number}” folder to the “restore+{number}” folder which auto creates on your external drive.
Type this command and click Enter on your keyboard. You will start to run QRescue. Command: qrescue.sh
(Optional) If you have two or more data volumes on your NAS, the screen will let you select which data volume you will start the process. Please type the number and press “enter”. If you only have one data volume, you might not see this step.
(Optional) Now you can see the progress for which files were completed in the recovery process.
When all of the QRescue process is completed, the screen will show the result summary and the process for sending the system log.
QRescue app also will send the event log to QuLog Center / System Log and notify you on finishing the whole recovery process. If you have opened the QNAP support ticket, don’t forget to make the feedback for your case. QNAP support team will help you to double check. Thank you very much.
Part 5. Move the recovery data to your NAS.
You can move the recovery data to your NAS by File Station
Click Get Started. The Welcome to myQNAPcloud! window appears.
Follow the steps to register your NAS. Click Next to move to the next step.
Enter your QNAP ID and Password.
Enter a Device name for your NAS. Note: This name is used to identify your NAS on myQNAPcloud and must be unique across all users.
Choose what NAS services will be enabled and the Access Control setting. Your device is registered on myQNAPcloud. A summary page displays all the registration details and services guidelines of your NAS.
As part of Google Cloud, Mandiant now has a far greater capability to close the security gap created by a growing number of adversaries. In my 29 years on the front lines of securing networks, I have seen criminals, nation states, and plain bad actors bring harm to good people. By combining our expertise and intelligence with the scale and resources of Google Cloud, we can make a far greater difference in preventing and countering cyber attacks, while pinpointing new ways to hold adversaries accountable.
When I founded Mandiant Corporation in 2004, we set out to change how businesses protected themselves from cyber threats. We felt the technologies people depended on to defend ultimately failed to innovate at the pace of the attackers. In order to deliver cyber defenses as dynamic as the threats, we believed you had to have your finger on the pulse of adversaries around the world. To address this need, we set out to respond to as many cyber security breaches as possible. We wanted to learn first-hand how adversaries were circumventing common safeguards with new and novel attacks; monitor the development and deployment of attacker tools, their infrastructure, and their underground economies; and study the attacker’s targeting trends.
Armed with this knowledge and experience, we felt we were best positioned to close the gap between the offense and the defense in the security arms race.
As we investigated thousands of security incidents over the years, we honed the deep expertise required to find the proverbial needle in the haystack: the trace evidence that something unlawful, unauthorized, or simply unacceptable had occurred. We believed this skill was the foundation to automating security operations through software, so that organizations and governments around the world could easily implement effective security capabilities.
By joining forces with Google Cloud, we can accelerate this vision. I am very excited that Mandiant and Google Cloud can now work together to leverage our frontline intelligence and security expertise to address a common goal: to relentlessly protect organizations against cyber attacks and provide solutions that allow defenders to operate with confidence in their cyber security posture. More specifically, we can leverage our intelligence differentiator to automate security operations and validate security effectiveness.
Mandiant Remains Relentless
While we are now part of Google Cloud, Mandiant is not going away—in fact, it’s getting stronger. We will maintain our focus on knowing the most about threat actors and extend our reputation for delivering world-class threat intelligence, consulting services, and security solutions.
Automating Security Operations
Today’s announcement should be welcome news to organizations facing cyber security challenges that have accelerated in frequency, severity, and diversity. I have always believed that organizations can remain resilient in the fight against cyber threats if they have the right combination of expertise, intelligence, and adaptive technology.
This is why I am a proponent of Google Cloud’s shared fate model. By taking an active stake in the security posture of customers, we can help organizations find and validate potential security issues before they become an incident. Google Cloud and Mandiant have the knowledge and skills to provide an incredibly efficient and effective security operations platform. We are building a “security brain” that scales our team to address the expertise shortage.
Validating Security Effectiveness
Google Cloud’s reach, resources, and focus will accelerate another Mandiant imperative: validating security effectiveness. Organizations today lack the tools needed to validate the effectiveness of security, quantify risk, and exhibit operational competency. Mandiant is working to provide visibility and evidence on the status of how effective security controls are against adversary threats. With this data, organizations have a clear line of sight into optimizing their individual environment against relevant threats.
Advancing Our Mission
Google Cloud has made security the cornerstone of its commitment to users around the world, and the Mandiant acquisition underscores that focus.
We are thrilled to continue moving our mission forward alongside the Google Cloud team. Together, I believe Mandiant and Google Cloud will help reinvent how organizations protect, detect, and respond to threats. This will benefit not only a growing base of customers and partners, but the security community at large.
A new attack technique called ‘GIFShell’ allows threat actors to abuse Microsoft Teams for novel phishing attacks and covertly executing commands to steal data using … GIFs.
The new attack scenario, shared exclusively with BleepingComputer, illustrates how attackers can string together numerous Microsoft Teams vulnerabilities and flaws to abuse legitimate Microsoft infrastructure to deliver malicious files, commands, and perform exfiltrating data via GIFs.
As the data exfiltration is done through Microsoft’s own servers, the traffic will be harder to detect by security software that sees it as legitimate Microsoft Team’s traffic.
Overall, the attack technique utilizes a variety of Microsoft Teams flaws and vulnerabilities:
Bypassing Microsoft Teams security controls allows external users to send attachments to Microsoft Teams users.
Modify sent attachments to have users download files from an external URL rather than the generated SharePoint link.
Spoof Microsoft teams attachments to appear as harmless files but download a malicious executable or document.
Insecure URI schemes to allow SMB NTLM hash theft or NTLM Relay attacks.
Microsoft supports sending HTML base64 encoded GIFs, but does not scan the byte content of those GIFs. This allows malicious commands to be delivered within a normal-looking GIF.
Microsoft stores Teams messages in a parsable log file, located locally on the victim’s machine, and accessible by a low-privileged user.
Microsoft servers retrieve GIFs from remote servers, allowing data exfiltration via GIF filenames.
GIFShell – a reverse shell via GIFs
The new attack chain was discovered by cybersecurity consultant and pentester Bobby Rauch, who found numerous vulnerabilities, or flaws, in Microsoft Teams that can be chained together for command execution, data exfiltration, security control bypasses, and phishing attacks.
The main component of this attack is called ‘GIFShell,’ which allows an attacker to create a reverse shell that delivers malicious commands via base64 encoded GIFs in Teams, and exfiltrates the output through GIFs retrieved by Microsoft’s own infrastructure.
To create this reverse shell, the attacker must first convince a user to install a malicious stager that executes commands, and uploads command output via a GIF url to a Microsoft Teams web hook. However, as we know, phishing attacks work well in infecting devices, Rauch came up with a novel phishing attack in Microsoft Teams to aid in this, which we describe in the next section.
GIFShell works by tricking a user into loading a malware executable called the “stager” on their device that will continuously scan the Microsoft Teams logs located at $HOME\AppData\Roaming\Microsoft\Teams\IndexedDB\https_teams.microsoft.com_0.indexeddb.leveldb\*.log.
Microsoft Teams log folder Source: BleepingComputer
All received messages are saved to these logs and are readable by all Windows user groups, meaning any malware on the device can access them.
Once the stager is in place, a threat actor would create their own Microsoft Teams tenant and contact other Microsoft Teams users outside of their organization. Attackers can easily achieve this as Microsoft allows external communication by default in Microsoft Teams.
To initiate the attack, the threat actor can use Rauch’s GIFShell Python script to send a message to a Microsoft Teams user that contains a specially crafted GIF. This legitimate GIF image has been modified to include commands to execute on a target’s machine.
When the target receives the message, the message and the GIF will be stored in Microsoft Team’s logs, which the malicious stager monitors.
When the stager detects a message with a GIF, it will extract the base64 encoded commands and execute them on the device. The GIFShell PoC will then take the output of the executed command and convert it to base64 text.
This base64 text is used as the filename for a remote GIF embedded in a Microsoft Teams Survey Card that the stager submits to the attacker’s public Microsoft Teams webhook.
As Microsoft Teams renders flash cards for the user, Microsoft’s servers will connect back to the attacker’s server URL to retrieve the GIF, which is named using the base64 encoded output of the executed command.
The GIFShell server running on the attacker’s server will receive this request and automatically decode the filename allowing the attackers to see the output of the command run on the victim’s device, as shown below.
For example, a retrieved GIF file named ‘dGhlIHVzZXIgaXM6IA0KYm9iYnlyYXVjaDYyNzRcYm9iYnlyYXVJa0K.gif’ would decode to the output from the ‘whoami’ command executed on the infected device:
the user is:
bobbyrauch6274\bobbyrauIkBáë
The threat actors can continue using the GIFShell server to send more GIFs, with further embedded commands to execute, and continue to receive the output when Microsoft attempts to retrieve the GIFs.
As these requests are made by the Microsoft website, urlp.asm.skype.com, used for regular Microsoft Teams communication, the traffic will be seen as legitimate and not detected by security software.
This allows the GIFShell attack to covertly exfiltrate data by mixing the output of their commands with legitimate Microsoft Teams network communication.
Even worse, as Microsoft Teams runs as a background process, it does not even need to be opened by the user to receive the attacker’s commands to execute.
The Microsoft Teams logs folder have also been found accessed by other programs, including business monitoring software, such as Veriato, and potentially malware.
Microsoft acknowledged the research but said it would not be fixed as no security boundaries were bypassed.
“For this case, 72412, while this is great research and the engineering team will endeavor to improve these areas over time, these all are post exploitation and rely on a target already being compromised,” Microsoft told Rauch in an email shared with BleepingComputer.
“No security boundary appears to be bypassed. The product team will review the issue for potential future design changes, but this would not be tracked by the security team.”
Abusing Microsoft teams for phishing attacks
As we previously said, the GIFShell attack requires the installation of an executable that executes commands received within the GIFs.
To aid in this, Rauch discovered Microsoft Teams flaws that allowed him to send malicious files to Teams users but spoof them to look as harmless images in phishing attacks.
“This research demonstrates how it is possible to send highly convincing phishing attachments to victims through Microsoft Teams, without any way for a user to pre-screen whether the linked attachment is malicious or not,” explains Rauch in his writeup on the phishing method.
As we previously said in our discussion about GIFShell, Microsoft Teams allows Microsoft Teams users to message users in other Tenants by default.
However, to prevent attackers from using Microsoft Teams in malware phishing attacks, Microsoft does not allow external users to send attachments to members of another tenant.
While playing with attachments in Microsoft Teams, Rauch discovered that when someone sends a file to another user in the same tenant, Microsoft generates a Sharepoint link that is embedded in a JSON POST request to the Teams endpoint.
This JSON message, though, can then be modified to include any download link an attacker wants, even external links. Even worse, when the JSON is sent to a user via Teams’ conversation endpoint, it can also be used to send attachments as an external user, bypassing Microsoft Teams’ security restrictions.
For example, the JSON below has been modified to show a file name of Christmas_Party_Photo.jpeg but actually delivers a remote Christmas_Party_Photo.jpeg………….exe executable.
Microsoft Teams JSON to spoof an attachment Source: Bobby Rauch
When the attachment is rendered in Teams, it is displayed as Christmas_Party_Photo.jpeg, and when highlighting it, it will continue to show that name, as shown below.
Spoofing a JPEG file Source: Bobby Rauch
However, when the user clicks on the link, the attachment will download the executable from the attacker’s server.
In addition to using this Microsoft Teams spoofing phishing attack to send malicious files to external users, attackers can also modify the JSON to use Windows URIs, such as ms-excel:, to automatically launch an application to retrieve a document.
Rauch says this would allow attackers to trick users into connecting to a remote network share, letting threat actors steal NTLM hashes, or local attackers perform an NTLM relay attack to elevate privileges.
“These allowed, potentially unsafe URI schemes, combined with the lack of permissions enforcement and attachment spoofing vulnerabilities, can allow for a One Click RCE via NTLM relay in Microsoft Teams,” Rauch explains in his report on the spoofing attack.
Microsoft not immediately fixing bugs
Rauch told BleepingComputer that he disclosed the flaws to Microsoft in May and June of 2022, and despite Microsoft saying they were valid issues, they decided not to fix them immediately.
When BleepingComputer contacted Microsoft about why the bugs were not fixed, we were not surprised by their response regarding the GIFShell attack technique, as it requires the device to already be compromised with malware.
“This type of phishing is important to be aware of and as always, we recommend that users practice good computing habits online, including exercising caution when clicking on links to web pages, opening unknown files, or accepting file transfers.
We’ve assessed the techniques reported by this researcher and have determined that the two mentioned do not meet the bar for an urgent security fix. We’re constantly looking at new ways to better resist phishing to help ensure customer security and may take action in a future release to help mitigate this technique.” – a Microsoft spokesperson.
However, we were surprised that Microsoft did not consider the ability of external attackers to bypass security controls and send attachments to another tenant as not something that should be immediately fixed.
Furthermore, not immediately fixing the ability to modify JSON attachment cards so that Microsoft Teams recipients could be tricked to download files from remote URLs was also surprising.
However, Microsoft has left the door open to resolving these issues, telling BleepingComputer that they may be serviced in future versions.
“Some lower severity vulnerabilities that don’t pose an immediate risk to customers are not prioritized for an immediate security update, but will be considered for the next version or release of Windows,” explained Microsoft in a statement to BleepingComputer.
Hardening changes in DCOM were required for CVE-2021-26414. Therefore, we recommended that you verify if client or server applications in your environment that use DCOM or RPC work as expected with the hardening changes enabled.
To address the vulnerability described in CVE-2021-26414, you must install updates released September 14, 2021 or later and enable the registry key described below in your environment. We recommended that you complete testing in your environment and enable these hardening changes as soon as possible. If you find issues during testing, you must contact the vendor for the affected client or server software for an update or workaround before early 2022.
Note We recommend that you update your devices to the latest security update available to take advantage of the advanced protections from the latest security threats.
Timeline
Update release
Behavior change
June 8, 2021
Hardening changes disabled by default but with the ability to enable them using a registry key.
June 14, 2022
Hardening changes enabled by default but with the ability to disable them using a registry key.
March 14, 2023
Hardening changes enabled by default with no ability to disable them. By this point, you must resolve any compatibility issues with the hardening changes and applications in your environment.
Registry setting to enable or disable the hardening changes
During the timeline phases in which you can enable or disable the hardening changes for CVE-2021-26414, you can use the following registry key:
Value Name: “RequireIntegrityActivationAuthenticationLevel”
Type: dword
Value Data: default = 0x00000000 means disabled. 0x00000001 means enabled. If this value is not defined, it will default to enabled.
Note You must enter Value Data in hexadecimal format.
Important You must restart your device after setting this registry key for it to take effect.
Note Enabling the registry key above will make DCOM servers enforce an Authentication-Level of RPC_C_AUTHN_LEVEL_PKT_INTEGRITY or higher for activation.
Note This registry value does not exist by default; you must create it. Windows will read it if it exists and will not overwrite it.
New DCOM error events
To help you identify the applications that might have compatibility issues after we enable DCOM security hardening changes, we added new DCOM error events in the System log; see the tables below. The system will log these events if it detects that a DCOM client application is trying to activate a DCOM server using an authentication level that is less than RPC_C_AUTHN_LEVEL_PKT_INTEGRITY. You can trace to the client device from the server-side event log and use client-side event logs to find the application.
Server events
Event ID
Message
10036
“The server-side authentication level policy does not allow the user %1\%2 SID (%3) from address %4 to activate DCOM server. Please raise the activation authentication level at least to RPC_C_AUTHN_LEVEL_PKT_INTEGRITY in client application.”(%1 – domain, %2 – user name, %3 – User SID, %4 – Client IP Address)
Client events
Event ID
Message
10037
“Application %1 with PID %2 is requesting to activate CLSID %3 on computer %4 with explicitly set authentication level at %5. The lowest activation authentication level required by DCOM is 5(RPC_C_AUTHN_LEVEL_PKT_INTEGRITY). To raise the activation authentication level, please contact the application vendor.”
10038
“Application %1 with PID %2 is requesting to activate CLSID %3 on computer %4 with default activation authentication level at %5. The lowest activation authentication level required by DCOM is 5(RPC_C_AUTHN_LEVEL_PKT_INTEGRITY). To raise the activation authentication level, please contact the application vendor.”(%1 – Application Path, %2 – Application PID, %3 – CLSID of the COM class the application is requesting to activate, %4 – Computer Name, %5 – Value of Authentication Level)
Availability
These error events are only available for a subset of Windows versions; see the table below.
Late evening, on September 6, 2022, the Wordfence Threat Intelligence team was alerted to the presence of a vulnerability being actively exploited in BackupBuddy, a WordPress plugin we estimate has around 140,000 active installations. This vulnerability makes it possible for unauthenticated users to download arbitrary files from the affected site which can include sensitive information.
After reviewing historical data, we determined that attackers started targeting this vulnerability on August 26, 2022, and that we have blocked 4,948,926 attacks targeting this vulnerability since that time.
The vulnerability affects versions 8.5.8.0 to 8.7.4.1, and has been fully patched as of September 2, 2022 in version 8.7.5. Due to the fact that this is an actively exploited vulnerability, we strongly encourage you to ensure your site has been updated to the latest patched version 8.7.5 which iThemes has made available to all site owners running a vulnerable version regardless of licensing status.
All Wordfence customers, including Wordfence Premium, Wordfence Care, Wordfence Response, and Wordfence Free users, have been, and will continue to be, protected against any attackers trying to exploit this vulnerability due to the Wordfence firewall’s built-in directory traversal and file inclusion firewall rules. Wordfence Premium, Care, & Response, customers receive enhanced protection as attackers heavily targeting the vulnerability are blocked by the IP Blocklist.
The BackupBuddy plugin for WordPress is designed to make back-up management easy for WordPress site owners. One of the features in the plugin is to store back-up files in multiple different locations, known as Destinations, which includes Google Drive, OneDrive, and AWS just to name a few. There is also the ability to store back-up downloads locally via the ‘Local Directory Copy’ option. Unfortunately, the method to download these locally stored files was insecurely implemented making it possible for unauthenticated users to download any file stored on the server.
More specifically the plugin registers an admin_init hook for the function intended to download local back-up files and the function itself did not have any capability checks nor any nonce validation. This means that the function could be triggered via any administrative page, including those that can be called without authentication (admin-post.php), making it possible for unauthenticated users to call the function. The back-up path is not validated and therefore an arbitrary file could be supplied and subsequently downloaded.
Due to this vulnerability being actively exploited, and its ease of exploitation, we are sharing minimal details about this vulnerability.
Indicators of Compromise
The Wordfence firewall has blocked over 4.9 million exploit attempts targeting this vulnerability since August 26, 2022, which is the first indication we have that this vulnerability was being exploited. We are seeing attackers attempting to retrieve sensitive files such as the /wp-config.php and /etc/passwd file which can be used to further compromise a victim.
The top 10 Attacking IP Addresses are as follows:
195.178.120.89 with 1,960,065 attacks blocked
51.142.90.255 with 482,604 attacks blocked
51.142.185.212 with 366770 attacks blocked
52.229.102.181 with 344604 attacks blocked
20.10.168.93 with 341,309 attacks blocked
20.91.192.253 with 320,187 attacks blocked
23.100.57.101 with 303,844 attacks blocked
20.38.8.68 with 302,136 attacks blocked
20.229.10.195 with 277,545 attacks blocked
20.108.248.76 with 211,924 attacks blocked
A majority of the attacks we have observed are attempting to read the following files:
/etc/passwd
/wp-config.php
.my.cnf
.accesshash
We recommend checking for the ‘local-download’ and/or the ‘local-destination-id’ parameter value when reviewing requests in your access logs. Presence of these parameters along with a full path to a file or the presence of ../../ to a file indicates the site may have been targeted for exploitation by this vulnerability. If the site is compromised, this can suggest that the BackupBuddy plugin was likely the source of compromise.
Conclusion
In today’s post, we detailed a zero-day vulnerability being actively exploited in the BackupBuddy plugin that makes it possible for unauthenticated attackers to steal sensitive files from an affected site and use the information obtained in those files to further infect a victim. This vulnerability was patched yesterday and we strongly recommend updating to the latest version of the plugin, currently version 8.7.5, right now since this is an actively exploited vulnerability.
All Wordfence customers, including Wordfence Premium, Wordfence Care, Wordfence Response, and Wordfence Free users, have been, and will continue to be, protected against any attackers trying to exploit this vulnerability due to the Wordfence firewall’s built-in directory traversal and file inclusion firewall rules.
If you believe your site has been compromised as a result of this vulnerability or any other vulnerability, we offer Incident Response services via Wordfence Care. If you need your site cleaned immediately, Wordfence Response offers the same service with 24/7/365 availability and a 1-hour response time. Both these products include hands-on support in case you need further assistance.
If you know a friend or colleague who is using this plugin on their site, we highly recommend forwarding this advisory to them to help keep their sites protected, as this is a serious vulnerability that is actively being exploited in the wild.
We will continue to monitor the situation and follow up as more information becomes available.
Actions to take today to mitigate cyber threats from ransomware:
• Prioritize and remediate known exploited vulnerabilities. • Train users to recognize and report phishing attempts. • Enable and enforce multifactor authentication.
Note: This joint Cybersecurity Advisory (CSA) is part of an ongoing #StopRansomware effort to publish advisories for network defenders that detail various ransomware variants and ransomware threat actors. These #StopRansomware advisories include recently and historically observed tactics, techniques, and procedures (TTPs) and indicators of compromise (IOCs) to help organizations protect against ransomware. Visit stopransomware.gov to see all #StopRansomware advisories and to learn more about other ransomware threats and no-cost resources.
The Federal Bureau of Investigation (FBI), the Cybersecurity and Infrastructure Security Agency (CISA), and the Multi-State Information Sharing and Analysis Center (MS-ISAC) are releasing this joint CSA to disseminate IOCs and TTPs associated with Vice Society actors identified through FBI investigations as recently as September 2022. The FBI, CISA, and the MS-ISAC have recently observed Vice Society actors disproportionately targeting the education sector with ransomware attacks.
Over the past several years, the education sector, especially kindergarten through twelfth grade (K-12) institutions, have been a frequent target of ransomware attacks. Impacts from these attacks have ranged from restricted access to networks and data, delayed exams, canceled school days, and unauthorized access to and theft of personal information regarding students and staff. The FBI, CISA, and the MS-ISAC anticipate attacks may increase as the 2022/2023 school year begins and criminal ransomware groups perceive opportunities for successful attacks. School districts with limited cybersecurity capabilities and constrained resources are often the most vulnerable; however, the opportunistic targeting often seen with cyber criminals can still put school districts with robust cybersecurity programs at risk. K-12 institutions may be seen as particularly lucrative targets due to the amount of sensitive student data accessible through school systems or their managed service providers.
The FBI, CISA, and the MS-ISAC encourage organizations to implement the recommendations in the Mitigations section of this CSA to reduce the likelihood and impact of ransomware incidents.
Download the PDF version of this report: pdf, 521 KB
Technical Details
Note:This advisory uses the MITRE ATT&CK® for Enterprise framework, version 11. See MITRE ATT&CK for Enterprise for all referenced tactics and techniques.
Vice Society is an intrusion, exfiltration, and extortion hacking group that first appeared in summer 2021. Vice Society actors do not use a ransomware variant of unique origin. Instead, the actors have deployed versions of Hello Kitty/Five Hands and Zeppelin ransomware, but may deploy other variants in the future.
Vice Society actors likely obtain initial network access through compromised credentials by exploiting internet-facing applications [T1190]. Prior to deploying ransomware, the actors spend time exploring the network, identifying opportunities to increase accesses, and exfiltrating data [TA0010] for double extortion–a tactic whereby actors threaten to publicly release sensitive data unless a victim pays a ransom. Vice Society actors have been observed using a variety of tools, including SystemBC, PowerShell Empire, and Cobalt Strike to move laterally. They have also used “living off the land” techniques targeting the legitimate Windows Management Instrumentation (WMI) service [T1047] and tainting shared content [T1080].
Vice Society actors have been observed exploiting the PrintNightmare vulnerability (CVE-2021-1675 and CVE-2021-34527 ) to escalate privileges [T1068]. To maintain persistence, the criminal actors have been observed leveraging scheduled tasks [T1053], creating undocumented autostart Registry keys [T1547.001], and pointing legitimate services to their custom malicious dynamic link libraries (DLLs) through a tactic known as DLL side-loading [T1574.002]. Vice Society actors attempt to evade detection through masquerading their malware and tools as legitimate files [T1036], using process injection [T1055], and likely use evasion techniques to defeat automated dynamic analysis [T1497]. Vice Society actors have been observed escalating privileges, then gaining access to domain administrator accounts, and running scripts to change the passwords of victims’ network accounts to prevent the victim from remediating.
Indicators of Compromise (IOCs)
Email Addresses
v-society.official@onionmail[.]org
ViceSociety@onionmail[.]org
OnionMail email accounts in the format of [First Name][Last Name]@onionmail[.]org
Vice Society have used malicious files that create component task schedule objects, which are often mean to register a specific task to autostart on system boot. This facilitates recurring execution of their code.
Vice Society actors may directly side-load their payloads by planting their own DLL then invoking a legitimate application that executes the payload within that DLL. This serves as both a persistence mechanism and a means to masquerade actions under legitimate programs.
Vice Society actors may attempt to manipulate features of the files they drop in a victim’s environment to mask the files or make the files appear legitimate.
Vice Society artifacts have been analyzed to reveal the ability to inject code into legitimate processes for evading process-based defenses. This tactic has other potential impacts, including the ability to escalate privileges or gain additional accesses.
Vice Society actors are known for double extortion, which is a second attempt to force a victim to pay by threatening to expose sensitive information if the victim does not pay a ransom.
Vice Society actors have encrypted data on target systems or on large numbers of systems in a network to interrupt availability to system and network resources.
Vice Society actors run a script to change passwords of victims’ email accounts.
Mitigations
The FBI and CISA recommend organizations, particularly the education sector, establish and maintain strong liaison relationships with the FBI Field Office in their region and their regional CISA Cybersecurity Advisor. The location and contact information for FBI Field Offices and CISA Regional Offices can be located at www.fbi.gov/contact-us/field-offices and www.cisa.gov/cisa-regions, respectively. Through these partnerships, the FBI and CISA can assist with identifying vulnerabilities to academia and mitigating potential threat activity. The FBI and CISA further recommend that academic entities review and, if needed, update incident response and communication plans that list actions an organization will take if impacted by a cyber incident.
The FBI, CISA, and the MS-ISAC recommend network defenders apply the following mitigations to limit potential adversarial use of common system and network discovery techniques and to reduce the risk of compromise by Vice Society actors:
Preparing for Cyber Incidents
Maintain offline backups of data, and regularly maintain backup and restoration. By instituting this practice, the organization ensures they will not be severely interrupted, and/or only have irretrievable data.
Ensure all backup data is encrypted, immutable (i.e., cannot be altered or deleted), and covers the entire organization’s data infrastructure. Ensure your backup data is not already infected.
Review the security posture of third-party vendors and those interconnected with your organization. Ensure all connections between third-party vendors and outside software or hardware are monitored and reviewed for suspicious activity.
Implement listing policies for applications and remote access that only allow systems to execute known and permitted programs under an established security policy.
Document and monitor external remote connections. Organizations should document approved solutions for remote management and maintenance, and immediately investigate if an unapproved solution is installed on a workstation.
Implement a recovery plan to maintain and retain multiple copies of sensitive or proprietary data and servers in a physically separate, segmented, and secure location (i.e., hard drive, storage device, the cloud).
Refrain from requiring password changes more frequently than once per year unless a password is known or suspected to be compromised. Note: NIST guidance suggests favoring longer passwords instead of requiring regular and frequent password resets. Frequent password resets are more likely to result in users developing password “patterns” cyber criminals can easily decipher.
Require administrator credentials to install software.
Require phishing-resistant multifactor authentication for all services to the extent possible, particularly for webmail, virtual private networks, and accounts that access critical systems.
Review domain controllers, servers, workstations, and active directories for new and/or unrecognized accounts.
Audit user accounts with administrative privileges and configure access controls according to the principle of least privilege.
Implement time-based access for accounts set at the admin level and higher. For example, the Just-in-Time (JIT) access method provisions privileged access when needed and can support enforcement of the principle of least privilege (as well as the Zero Trust model). This is a process where a network-wide policy is set in place to automatically disable admin accounts at the Active Directory level when the account is not in direct need. Individual users may submit their requests through an automated process that grants them access to a specified system for a set timeframe when they need to support the completion of a certain task.
Protective Controls and Architecture
Segment networks to prevent the spread of ransomware. Network segmentation can help prevent the spread of ransomware by controlling traffic flows between—and access to—various subnetworks and by restricting adversary lateral movement.
Identify, detect, and investigate abnormal activity and potential traversal of the indicated ransomware with a networking monitoring tool. To aid in detecting the ransomware, implement a tool that logs and reports all network traffic, including lateral movement activity on a network. Endpoint detection and response (EDR) tools are particularly useful for detecting lateral connections as they have insight into common and uncommon network connections for each host.
Install, regularly update, and enable real time detection for antivirus software on all hosts.
Secure and closely monitor remote desktop protocol (RDP) use.
Limit access to resources over internal networks, especially by restricting RDP and using virtual desktop infrastructure. If RDP is deemed operationally necessary, restrict the originating sources and require MFA to mitigate credential theft and reuse. If RDP must be available externally, use a VPN, virtual desktop infrastructure, or other means to authenticate and secure the connection before allowing RDP to connect to internal devices. Monitor remote access/RDP logs, enforce account lockouts after a specified number of attempts to block brute force campaigns, log RDP login attempts, and disable unused remote access/RDP ports.
Vulnerability and Configuration Management
Keep all operating systems, software, and firmware up to date. Timely patching is one of the most efficient and cost-effective steps an organization can take to minimize its exposure to cybersecurity threats. Organizations should prioritize patching of vulnerabilities on CISA’s Known Exploited Vulnerabilities catalog.
Disable unusedports.
Consider adding an email banner to emails received from outside your organization.
Disable hyperlinks in received emails.
Disable command-line and scripting activities and permissions. Privilege escalation and lateral movement often depend on software utilities running from the command line. If threat actors are not able to run these tools, they will have difficulty escalating privileges and/or moving laterally.
Ensure devices are properly configured and that security features are enabled.
Disable ports and protocols that are not being used for a business purpose (e.g., RDP Transmission Control Protocol Port 3389).
Restrict Server Message Block (SMB) Protocol within the network to only access servers that are necessary, and remove or disable outdated versions of SMB (i.e., SMB version 1). Threat actors use SMB to propagate malware across organizations.
REFERENCES
Stopransomware.gov is a whole-of-government approach that gives one central location for ransomware resources and alerts.
The FBI is seeking any information that can be shared, to include boundary logs showing communication to and from foreign IP addresses, a sample ransom note, communications with Vice Society actors, Bitcoin wallet information, decryptor files, and/or a benign sample of an encrypted file.
The FBI, CISA, and the MS-ISAC strongly discourage paying ransom as payment does not guarantee victim files will be recovered. Furthermore, payment may also embolden adversaries to target additional organizations, encourage other criminal actors to engage in the distribution of ransomware, and/or fund illicit activities. Regardless of whether you or your organization have decided to pay the ransom, the FBI and CISA urge you to promptly report ransomware incidents to a local FBI Field Office, or to CISA at report@cisa.gov or (888) 282-0870. SLTT government entities can also report to the MS-ISAC (SOC@cisecurity.org or 866-787-4722).
DISCLAIMER
The information in this report is being provided “as is” for informational purposes only. The FBI, CISA, and the MS-ISAC do not endorse any commercial product or service, including any subjects of analysis. Any reference to specific commercial products, processes, or services by service mark, trademark, manufacturer, or otherwise, does not constitute or imply endorsement, recommendation, or favoring by the FBI, CISA, or the MS-ISAC.
What is Cumulative Layout Shift (CLS) and Why it Matters?
The Cumulative Layout Shift is a Core Web Vital metric and measures how visually stable the page is. The visual stability is calculated by how many unexpected layout shifts occur without interacting with the page. Every time the content shifts — not because you clicked on a link and so on — counts as a layout shift.
The sum of all these shifts determines the Cumulative Layout Shift score.
How many times have you been reading an article, and the content moved down because of some new ads? Or, have you ever tried to click on a button and ended up clicking on another link because a new big image suddenly pushed the content down?
All these examples are layout shifts — they’re caused by some elements on the page being unstable and changing their position on the page. Elements change their position due to different reasons. For instance, a new image or an ad loading above-the-fold (at the top of the page) forces some content to go down and occupy another section of the page.
You can imagine how annoying this experience is for users.
That’s why Cumulative Layout Shift is one of the three Core Web Vitals metrics assessing a page’s user experience. Alongside Largest Contentful Paint and First Input Delay, CLS will roll out as part of the Page Experience ranking factor in June 2021.
The Cumulative Layout Shift accounts for 15% of the PageSpeed score and it’s a highly relevant metric for user experience and the new ranking factor. Therefore, it could also affect your SEO performance.
What’s a Good CLS Score
As we explained, the CLS is the sum of all the unexpected content shifts occurring on the page. According to the sum of all the shifts, your CLS grade could pass Google’s assessment or not.
A good CLS score should be equal to or less than 0.1.
A CLS score between 0.1 and 0.25 means that the performance “needs improvements”.
The grade is “poor” if CLS is more than 0.25.
How to Find and Measure the Cumulative Layout Shift (CLS)
There are several ways to measure the CLS score, both from Lab and Data tools. Here are the most popular tools you can use:
Let’s see how PageSpeed Insights and Search Console can help you find and measure Cumulative Layout Shift.
Measuring and Finding CLS with PageSpeed Insights
PageSpeed Insights is one the best tools to measure and find Cumulative Layout Shift.
The tool provides you with the CLS score from the Lab and Field data so that you can measure both controlled and user data.
PageSpeed Insights also shows you the potential elements causing a layout shift.
The example below shows a bad score for CLS, both for the Field and Lab Data:
Jumping to the Diagnostics area, you can find what is causing the issue under the “Avoid large layout shift” section.
In this case, there’s only one element affecting CLS. It’s a preformatted text included on the page to explain how to measure CLS in JavaScript:
As you can see, PSI gives you the score related to each element so that you can understand how much every element contributes to the overall CLS score.
If you have more than one element listed in this section, you should start fixing the ones that contribute the most to the bad grade. It’s likely that by fixing the most relevant issues, you’ll get a score good enough to pass Google’s assessment.
Note: Let’s say that you get a bad Field grade and a good Lab one — yes, it could happen! In that case, you should make sure you get a good score for CLS in the Field Data, too. Keep in mind that Field Data is related to the real user experience. As for CLS, Lab Data only considers layout shifts during page load. On the other hand, Field Data counts all the layout shifts during the whole visit, from entry until the page is closed. Therefore, it’s more representative of your site than the Lab Data. It’s no coincidence that Google uses field Data for search rankings.
Measuring and Finding LCP on Search Console
In addition to measuring the CLS score and finding the elements causing layout shifts, you should analyze the sitewide performance.
The Core Web Vitals report in Search Console is the best way to find all the URLs affected by the same issue. For instance, in the Mobile or Desktop report’s Details tab, you may read “CLS issue: more than 0.1 (mobile)”.
By clicking on the specific row, you’ll find a list of URLs that need to be fixed for the same reason.
Once you solve the issue, it will be easy to validate the fix for all the pages affected by the same problem.
Let’s now understand what causes a bad CLS score and how you can solve it.
What Factors Affect CLS and Cause a Slow Score
The most common factors of a poor Cumulative Layout Shift grade on WordPress are:
Images and videos without dimensions
Ads, embeds, and iframes without dimensions
Web Fonts causing Flash of Unstyled Text (FOUT) or Flash of invisible text (FOIT)
Actions waiting for a network response before updating DOM (especially for ads)
Dynamically injected content (e.g., animations).
Keep in mind that CLS has the most significant impact on mobile — the most critical and challenging device for optimizing performance. There are several reasons, from a smaller viewport to a challenging mobile network and a weaker Central Processing unit (CPU).
Images and Videos Without Dimensions
Images and videos without dimensions are a common cause for a layout shift.
If you don’t specify the width and height size attributes, the browser doesn’t know how much space has to allocate while loading these elements. Likely, the space reserved won’t be enough. As a result, once these elements are fully loaded, they will take more space than expected — the content already displayed will shift.
You can solve this issue by including image dimensions on images and video elements in different ways. We’ve got you covered in the dedicated section!
Ads, Embeds, and Iframes Without Dimensions
The same “dimension” issue goes for ads, embeds, and iframes. Once again, not reserving enough space makes these dynamic elements push down the content already displayed. Therefore, new layout shifts will occur on the page.
You’ll manage this problem by assigning fixed dimensions to the ads and managing the size reserved for such elements through specific tactics.
Web Fonts Causing Flash of Unstyled Text (FOUT) or Flash of Invisible Text (FOIT)
Web fonts can cause layout shifts, plus a pretty unpleasant user experience while rendering the page. It’s about how slow the fonts load. You might face two different issues: Flash of Unstyled Text (FOUT) or Flash of invisible text (FOIT).
On the one hand, you could see the text on the page with a “not-so-good” style (FOUT). It’s because the custom font takes a bit to load. In the meantime, you’ll see the fallback font. Once the custom font is ready, it will replace the fallback one. You’ll then see the font changing on the page — and the content will inevitably shift.
On the other hand, you could wait a bit before seeing any text displayed. It’s because the custom font is still being loaded (FOIT). You’ll see the content on the page only after the custom fonts have been rendered. Once fully loaded, that content might cause a layout shift.
The main way to solve this issue is to preload fonts, as you’ll read in a minute.
Actions Waiting for a Network Response Before Updating DOM & Content Injected on the Page
Animations and dynamic content injected on the page — such as banners, ads, or Instagram feeds — can also cause a layout shift. Once again, it’s because there’s not enough space reserved for such elements.
At this point, you know how essential it is to allocate space for the elements that engage users and shouldn’t ruin the user experience.
By going over each point, you’ll understand how to fix the Search Console status: CLS issue: more than 0.25s or CLS issue: more than 0.1s, both from mobile and/or desktop.
🚀 For each of our recommendations, you’ll find a piece of information about its performance impact — from low to high. The higher the impact is, the higher chance that the Cumulative Layout Shift grade will improve after following that specific recommendation.
Some best practices to avoid large layout shifts don’t include a specific solution — they’re more about managing well space for ads and other crucial elements.
1. Include Width and Height Size Attributes on Images and Video Elements
Performance impact: high 🚀🚀🚀
One of the simplest ways to fix CLS is to include the width and height attributes on your images and video elements in your WordPress CMS:
WordPress adds image dimensions by default. So, this action should be automatically solved.
In case you’re facing any issue, keep in mind that WP Rocket automatically includes any missing “width” and “height” values to images.
You only have to select the “Add missing image dimensions” option in the Media tab. Fast and straightforward as that!
Another way to solve this issue is to take advantage of the CSS aspect ratio boxes and let the browsers set the default ratio of images.
Simply put, you should include the width or the height attribute and set the aspect ratio using CSS. The browser will figure out the missing attribute and get the image dimensions before rendering the page. By doing so, it will allocate the space needed while the image is loading. As a result, the content won’t move around, and layout shifts will be avoided.
It’s helpful information to keep in mind because many plugins, such as YouTube video embed ones, use aspect-ratio on their output.
Don’t forget about responsive images! You can use the srcset attribute:
Thanks to srcset, the browser can choose between a set of images and related sizes. Keep in mind that images should use the same aspect ratio to set image size.
By including size images, you’ll serve images with correct dimensions and address the PageSpeed Insights opportunity.
2. Preload Fonts (And Optimize Them)
Performance impact: low (high only if the site had large text) 🚀
As we explained, if web fonts don’t load fast, they cause a terrible user experience and affect the CLS grade.
As a best practice for avoiding layout shifts, you should preload fonts.
By preloading fonts, you’ll tell the browser to load the fonts as one of the top-priority resources. When rendering the page, the browser will load the fonts as fast as possible. As a result, the browser will likely include the fonts in the first meaningful paint — that’s when the page’s primary content is fully loaded and displayed. In that case, no layout shift will occur.
Did you know that you can easily preload fonts with WP Rocket? In the dedicated tab, you only have to include the URLs of the font files to be preloaded:
Please note that it’s useful to enable this WP Rocket option only if you have not activated the Remove Unused CSS feature (File optimization tab). If RUCSS is activated, you don’t need to activate the Preload fonts option.
There’s more to this point. To prevent any FOIT and FOUT issues, you should combine the rel=preload (or the WP Rocket feature enabled) with the CSS line font-display: optional.
The CSS font-display descriptor determines how font files are downloaded and displayed by the browser. With font-display: optional, the browser will download and cache the font files to make them immediately available for rendering. So, even though font-display has several values, optional is the one you should use.
Another useful tip to reduce the FOUT issue is to add the display:swap;missing on font-display properties. WP Rocket can help you do it if you minify/combine CSS files.
There are other ways to load fonts faster:
Convert the icon fonts to SVG. Font icons take a while to load and don’t help accessibility. There’s no reason to use them. Using SVGs, the font will render faster, and you will load the exact fonts you need.
Make multiple font formats available. By doing so, the browsers will pick the compatible format and only load its font. Here is some information about font formats that you may find helpful:
Avoid TTF. It’s usually 10 – 20% more heavy than WOFF.
Use SVG for Safari. It’s usually a bit smaller than WOFF.
Use WOFF2 for modern browsers. It’s the smallest size – around 30% smaller than WOFF and SVG.
Implement WOFF as a fallback when SVG or WOFF2 can’t be used.
Host your fonts locally or use a CDN to cache them. You’ll avoid any delay and deliver fonts faster.
By applying these recommendations, you’ll optimize your fonts and avoid several layout shifts. You’ll address the PSI recommendation: “Ensure text remains visible during webfont load” on your WordPress site.
3. Manage Space and Size for Ad Slots
Performance impact: high 🚀🚀🚀
There are several best practices to avoid any layout shift for ads:
Assign fixed dimensions to the ads so that you’ll reserve enough space for the ads to be loaded.
Reserve the biggest possible space for ads. Historical data come in handy to assess what’s the best dimension for each ad slot.
Keep every space reserved for ads that have not been displayed. In other words, you shouldn’t collapse any area on the viewport. You could rather include a placeholder or a fallback element.
Place non-sticky ads in the middle of the page — anyway, far from the top of the viewport.
The Delay JavaScript Execution feature provided by WP Rocket can help you control dynamic content above the fold like Google Ads. The feature can be used to stop dynamic interaction, content injection (ads), and dynamic class changes until there is an interaction on the page.
Once again, you’ll address the “Serve images with correct dimensions” PSI recommendation. The same goes for the next section.
4. Manage Space for Embeds and Iframes
Performance impact: high 🚀🚀🚀
The recommendations for managing embeds and iframes are similar to the ones for ads.
In particular, you should precompute enough space for such elements. Once again, historical data can be useful to understand how much space you should reserve.
Placeholder or fallback is an excellent solution to manage the unknown embed size.
5. Manage Dynamic Content
Performance impact: high 🚀🚀🚀
Dynamic content such as banners can also affect Cumulative Layout Shift. That’s why you should avoid displaying new content unless it’s triggered by user interaction. As you know, CLS counts only the layout shifts that occurred when users are not interacting with the page.
As explained in the “Manage Space and Size for Ad Slots” section, you can take advantage of the Delay JavaScript Execution option provided by WP Rocket to control dynamic content above the fold.
By managing dynamic content, you’ll take care of the following PageSpeed recommendations:
Avoid large layout shifts
Avoids enormous network payloads.
6. Prefer the CSS Transform Property for Animations
Performance impact: low 🚀
The last best practice to ensure visual stability is to take care of animations. You can use the CSS property: transform, which doesn’t trigger any layout changes.
You’ll address the “Avoid non-composited animations” PageSpeed recommendation.
What is First Input Delay (FID) and Why it Matters?
First Input Delay is a Core Web Vitals metric and measures how long it takes for the browser to respond to the first user’s interaction with a page — that is, clicking on a link, tapping on a button, or interacting with another element.
Let’s say that you land on a site and click on a link. Of course, you would expect the page to answer as soon as possible, right? Unfortunately, this is not always the case. For instance, you may click on a link, and nothing happens for a while — it’s because the browser is not able to process the user’s request immediately.
In more technical words, it’s because the browser’s main thread is processing another request and can’t respond to the user’s one. Quite often, the requests that keep the browser busy are related to processing JavaScript files. We’ll go over the JS files in the next section and explain how to fix the main issues.
So, back to you: you click on a link and keep waiting for something to happen on the page… Pretty annoying, isn’t it?
That’s why FID is part of the Core Web Vitals metrics and helps measure a page’s user experience.
Unlike the other two Core Web Vitals metrics, FID can only be measured on the field — after all, it’s all about users’ interaction.
For this reason, some tools, such as Lighthouse, can’t measure the First Input Delay and use Total Blocking Time as a proxy. TBT is a lab metric that also measures interactivity and responsiveness (without user interaction). As long as the TBT score is good, the FID grade should also be fine.
TBT accounts for 25% of the overall PageSpeed Insights score. It’s the highest weight, and only LCP has the same one. By improving TBT performance, you’ll likely improve your page speed grade and the FID performance.
What’s a good FID score
As for the other Core Web Vitals, scores are divided into three buckets: Good, Needs improvement, and Poor.
A good FID score needs to have a First Input Delay of less or equal to 100 milliseconds.
The score “needs improvement” if it’s between 100 and 300 milliseconds.
On the other hand, a “poor” score is beyond 300 milliseconds.
What’s a Good Total Blocking Time Score
You may wonder if the same score buckets apply to the Total Blocking Time. TBT score is slightly different — as the metric itself is. The key difference is that TBT measures interactivity without user input. That’s why it can be calculated as lab Data.
Total Blocking time measures how long the page is “blocked” before responding to user input such as a keyboard press, screen tap, or mouse click — no user interaction, you see? The sum of all the “block times” determines the TBT score.
To be a bit more technical, TBT measures the sum of all periods between First Contentful Paint (when you can interact with the first content on the page) and Time to Interactive (how long it takes for the page to get fully interactive).
As usual, Total Blocking Time includes three buckets:
Good – less or equal to 300 milliseconds
Needs improvement – Between 300-600 milliseconds
Poor – over 600 milliseconds.
In short: both FID and TBT capture a page’s interactivity and responsiveness — even though FID takes into account the user interaction, whereas TBT relies on user input. For this reason, both metrics are similar in terms of improvements needed.
What’s The Maximum Potential First Input Delay
You may have come across the Maximum Potential First Input Delay and wondered what’s the relationship with FID.
The Maximum Potential First Input Delay measures the maximum delay between the user’s interaction and the browser’s response.
It’s the worst-case scenario based on the duration of the longest task after the First Contentful Paint — that’s when the first part of a content’s page is displayed on the screen, and you can start interacting with the page.
Once you can click on a link or tap a button (First Contentful Paint accomplished), you can measure how long it takes for the page to respond to your request while the longest task is running. The longest task’s length is the Maximum Potential First Input Delay.
By measuring the Maximum Potential First Input Delay, you’ll know how long users will wait when interacting with the page after seeing the first content.
How to Measure the First Input Delay
Being a field metric, First Input Delay can be only measured by a few tools:
PageSpeed Insights give you the easiest opportunity to measure the First Input Delay score on a page basis, as well as the Total Blocking Time:
Measuring FID with Search Console
If you want to assess your site’s sitewide FID performance, you should take a look at the Core Web Vitals report in Search Console. The report is based on the Chrome User Experience Report.
By choosing either the mobile or desktop report, you can identify the FID performance’s potential issues and dive deeper into the URLs affected by the same problem — for instance, FID Issue: longer than 100 ms.
What factors affect FID and cause a slow score on WordPress
At this point, you can guess that FID is mainly impacted by JavaScript execution. When the browser is busy dealing with heavy JavaScript files, it can’t process other requests, including the users’ ones.
As a result, interactivity is poor; JavaScript execution times are longer; the main thread is busy and blocked. In short, the page can’t respond to user inputs nor interactions.
We’ll see different ways to fix these issues.
Since JavaScript is the key to improving FID, you should be aware that having many plugins — especially the JavaScript-based ones — could also affect the First Input Delay grade. You should avoid any unnecessary JavaScript execution on the pages where the plugin is not needed. It’s also important to remove any plugin that is not essential.
Heavy WordPress themes can also affect the First Input Delay grade. They have more JS files, complex layouts, and an inefficient style that will affect the main thread — therefore, the FID performance.
That’s why the less complexity the themes have, the better. And that’s also why the tendency now is to simplify everything: layouts, animations, more native JS use vs. relying on complex libraries.
We’ll go over the actions to improve FID in the next section. If you prefer, you can first watch the video that shows how to optimize FID with WP Rocket!
How to Reduce the First Input Delay Longer Than 100 ms or 300 ms on Mobile and Desktop
Improving how the browser deals with JavaScript execution reduces the First Input Delay on WordPress and enhances the FID score.
The goal is to make the process faster and smoother so that interactivity and responsiveness can get better.
If your FID grade has any issues, in the Core Web Vitals report on Search Console you’ll read “FID issue: longer than 100ms” or “FID issue: longer than 300ms“. The issue can be from mobile and/or desktop.
There are several ways to optimize the First Input Delay grade on WordPress:
Let’s see in detail what actions you should take and what’s the performance impact.
1. Defer JavaScript
Performance Impact: high
As for optimizing the JavaScript execution, you should defer Javascript files.
By deferring JavaScript files, these render-blocking resources will be loaded after the browser has rendered the most relevant content — that is, the content needed to let users interact with the page.
As a result, the loading time will improve, as well as the FID grade.
Once you have identified the JS resources to defer, you should add the defer attribute to the JavaScript files. The browser will then know which files to defer until the page rendering is complete.
You’ll find this option in the File optimization tab. You’ll also be able to exclude specific JS files from being deferred — in case you need this option due to any conflict.
You’ll address the “Eliminate render-blocking resources” and “Reduce the impact of third party code” PageSpeed recommendations — even though the JS render-blocking resources issues don’t stop here.
Keep reading to learn what other actions you should implement.
Unused JS files are the JavaScript resources not essential for rendering the page or not useful at all. Yet, these files are in the code, so you should manage them. Examples of unused JS files are the third-party JavaScript files such as the analytics and ads tracking codes.
The PageSpeed Insights report shows you the list of the unused JS files you should take care of:
You have two options to tackle unused Javascript files:
1. Load the JavaScript files only when needed. You can use plugins such as Perfmatters and Assets Cleanup to load these files only when needed. The execution of JavaScript files should be disabled in any other case. As an additional tip, you may ask your theme and plugin developers to ensure that only the needed assets are loaded when their respective features are used.
2. Delay the JavaScript files. Delaying JavaScript resources means that the JavaScript files won’t be loaded until the first user interaction (e.g., scrolling, clicking a button). In other words, no JS files will be loaded unless there’s user interaction. It’s important to keep in mind that not all the scripts from the PageSpeed recommendation list, like the one included above, can be safely delayed. An additional advantage of delaying JavaScript is that Lighthouse won’t detect any JS files. As a result, the tool won’t include any of these JS resources in the “Remove unused Javascript files” recommendation.
To be clear: you shouldn’t delay JS files to solve this PSI recommendation. You’ll find more information about the main reason why you should delay JS in the next point. However, it’s useful for you to know as an added value for improving your PSI score.
So, how can you delay JavaScript files? You can use a free plugin such as Flying Scripts.
On the other hand, you can take advantage of WP Rocket and its Delay JavaScript execution feature. The File optimization tab allows you to delay the JavaScript execution in a few clicks.
Lastly, here’s a list of other plugins that can help you to minimize unused JS. We recommend using them carefully:
Removing unused Javascript files will address the specific PageSpeed recommendation listed in the report. You’ll also address the “Eliminating render-blocking resources” and “Reducing javascript execution time” recommendations.
Don’t Miss Out!
The Core Web Vitals Cheat Sheets are the easiest and fastest way to learn how to optimize LCP, FID, and CLS and prioritize your performance tasks.Yes, I Want This!
3. Delay JS Execution Time Until User Interaction
Performance impact: very high
You can optimize JavaScript resources and prioritize the scripts needed for interaction by delaying the JS files and their execution until user interaction.
In other words, no JavaScript files will be loaded until user interaction, such as clicking a button or scrolling the content.
As explained above, you should delay all the JavaScript files that affect loading time and interaction for no reason, such as the unused JS files included in the previous section.
As you already know, you have different options to delay JavaScript files. You can use a free plugin such as Flying Scripts or take advantage of the Delay JavaScript execution feature option provided by WP Rocket — more details above.
This is how you’ll address the “Reduce javascript execution time” PSI recommendation.
4. Minify JS
Performance impact: low
Another effective way to manage the JavaScript execution time goes through the minification of JavaScript files.
By minifying JS files, you’ll remove any comments, line breaks, and white spaces included in the code. The goal is to make the files’ size smaller and faster.
Minification can be time-consuming, and there’s always the risk of missing out on anything. For these reasons, it’s best to use a minification tool or use WP Rocket. WP Rocket is the easiest way to minify JS files in a few clicks. You only have to enable the Minify JavaScript file option in the file optimization tab.
You’ll address the following PageSpeed Insights recommendations:
Minify JS
Avoid enormous network payloads.
5. Remove (or Reduce) Unused CSS
Performance impact: medium
As explained in the LCP section, removing or reducing unused CSS helps improve loading time — therefore, it improves interactivity and the FID metric.
WP Rocket offers a powerful feature that allows you to tackle unused CSS in one click. You only need to enable the option below, and the plugin will remove the unused CSS included in the HTML of the page.
By enabling this feature, you’ll easily address the “Reduce unused CSS” recommendation.
6. Async or Defer CSS
Performance impact: medium
The main thread work can have a significant impact on interactivity and FID performance. That’s why one of the PSI recommendations is “Minimize main thread work.” To address the issue and improve FID time, you should defer or async the CSS files.
In the Defer JavaScript section, you read why defer is essential to allow the browser to focus only on the resources essential to page rendering. The same goes for the CSS files that are render-blocking resources.
An option is to include the Defer attribute to all the CSS files:
<script defer src="/example-css-script"></script>
And here’s another 2-step process to make the CSS render-blocking resources load asynchronously:
Extract and inline the Critical Path CSS (CPCSS) using an available generator tool like this one.
If you’re looking for more detailed information, we recommend you read the dedicated Google resource.
An extra tip to keep in mind is to avoid placing large non-critical CSS code in the <head> of the code.
If you’re looking for a faster and easier way to quickly take care of both critical and non-critical CSS, WP Rocket can help you. Under Optimize CSS delivery, our cache plugin offers the Load CSS asynchronously option that defers non-critical CSS and inline critical CSS.
You’ll remove all the render-blocking CSS resources by enabling the option in the File Optimization tab:
Please note that if you have already enabled the Remove Unused CSS option (RUCSS), you can’t choose this option — simply because you don’t need it. WP Rocket is already optimizing CSS files at its best. We recommend optimizing CSS Delivery only in case RUCSS is not working for you.
By implementing these actions, you’ll take care once again of the “Eliminate render-blocking resources” PageSpeed Insights recommendations. You’ll also address the “Avoid chaining critical requests” recommendation.
7. Compress text files
Performance impact: high
As you can guess at this point, compression is something you need to take care of. It goes without saying that “Enable text compression” is one of the PSI recommendations that apply to FID times.
By compression and reducing files’ size, the browser and the server will send over files faster. The browser will load these resources quicker.
The easiest way to enable Gzip compression on WordPress is using a plugin. You can choose between different options, from the Enable Gzip Compression plugin to WP Rocket, which includes GZIP compression by default. Keep in mind that some hosts enable GZIP compression automatically.
8. Break up Long Tasks
Performance impact: high
As we explained at the beginning of the article, when the main thread is busy and blocked, the FID grade is negatively affected, and the page can’t respond to user inputs nor interactions.
The main thread is blocked because of the long tasks that the browser can’t interrupt — that is, all the tasks running longer than 50 ms. That’s why when the main thread is blocked, a page can’t respond to user inputs, and responsiveness gets affected.
To solve this issue, you should split long-running scripts into smaller chunks that can be run in less than 50ms.
content-visibility is a new powerful CSS property that can help boost the rendering performance by enabling the user agent to skip an element’s rendering work until it is needed.
You can improve your load performance by applying content-visibility: auto; contain-intrinsic-size: 1px 5000px; to elements where you want to delay the paint. Don’t forget the second part: it’s important to fix some usability issues.
Currently, this CSS property works only on Chrome and the majority of browsers based on it.
What is Largest Contentful Paint (LCP) and Why it Matters?
The Largest Contentful Paint (LCP) is a Core Web Vital metric and measures how long it takes for the largest element to become visible in the viewport. Until the LCP doesn’t load, you won’t see almost anything on the page. It’s because the LCP element is always above the fold — that’s at the top of the page.
LCP is usually an image or a text block. However, it could also be a video or an animation. The LCP element can differ between mobile and desktop.
As you can guess, the largest element is the most relevant one for user experience and perceived load speed.
Think about it: if the page’s biggest element doesn’t load fast, your user experience won’t be good. You would look at an almost blank page, waiting for the page to load… You could even leave the site! When browsing, a few seconds can make a huge difference.
That’s why Google has included LCP as one of the Core Web Vitals metrics — the metrics measuring how great your user experience is.
In June, LCP will roll out as part of the new ranking factor, the Page Experience Signal. For this reason, Largest Contentful Paint matters not only for delivering a great user experience but also for improving your SEO performance.
Let’s go over some of the easiest and most effective tools: PageSpeed Insights and Search Console.
Measuring and Finding LCP with PageSpeed Insights
PageSpeed Insights is the easiest way to measure and find the LCP element.
After testing your URL’s page, you’ll get the LCP grade in the Lab Data and the Field Data (if available). You’ll also get the PageSpeed recommendations to improve your performance.
Go to the Diagnostics area and look for the “Largest Contentful Paint element” section. You’ll discover what’s the LCP element for the page you’re analyzing.
Let’s go over a couple of examples and make things easier to understand.
The LCP example From Mobile
Let’s analyze a WP Rocket blog page from mobile.
We test the performance of the page in the tool and go to the Diagnostics area. The LCP element is the H1, which is the blog post title:
As long as the main title loads fast, the page will deliver an excellent user experience.
The LCP example From Desktop
Let’s now take a look at the same URL from the desktop.
We go again to the Diagnostics Area and look for the LCP element. Not surprisingly, LCP is not the same as for mobile. For desktop, the LCP is an image:
More precisely, it’s the image of the post.
Since PageSpeed Insights is a page-based tool, we recommend that you run several tests for different pages.
For an overall analysis, you should also take advantage of the Search Console.
Measuring and Finding LCP on Search Console
You can assess your sitewide performance and detect any issues with the Core Web Vitals report in Search Console.
You’ll be able to access both performances from mobile and desktop:
Once you open the report, you’ll see how your site’s pages perform according to each threshold: good, needs improvement, and poor.
Search Console report groups each Core Web Vital performance by status, issue type, and URLs.
For example, you might have some URLs not performing well for LCP. If so, in the report, you may read “LCP issue: longer than 2.5 s (mobile).”
By clicking on the row related to that specific issue, you’ll land on a page that provides the list of URLs that need to be fixed. While these URLs are an example, they can give you a pretty accurate idea of what’s going on.
It will be pretty easy to find the URL pattern and move forward with the fixing and the validation.
What Factors Affect LCP and Cause a Slow Score
For WordPress sites, three factors affect LCP: slow server response times, render-blocking JavaScript and CSS, and slow resource load time.
Slow Server Response Times
The browser makes a request to the server, but the server takes too long to send the content requested. Since the browser doesn’t receive the content quickly enough, it takes a while to get something rendered on your screen. As a result, load time is not great. The LCP score gets affected.
You’ll fix the issue by improving your Time to First Byte, using a CDN, and establishing third-party connections early.
Render-blocking JavaScript and CSS
The browser makes a request and gets the content from the server. At this point, the browser will render the content and show it, right? Not so fast.
To render any content, the browser has to analyze (or parse) the HTML of the page and make it “readable” into the HTML structure of the page — that’s the DOM tree. After that, the content will be rendered and fully displayed — unless some scripts and stylesheets block the HTML parsing. These scripts and stylesheets are the render-blocking resources.
As a result of this block, the parsing is delayed. Once again, the content you requested takes a bit before being loaded. The LCP performance gets affected again.
You’ll tackle these issues by deferring and removing unused JS files. Don’t worry! You’ll find all the information you need in the next section.
Slow Resource Load Times
Other files can also cause poor performance and a bad user experience: images, videos, and block-level elements like HTML and CSS files.
As you already know, LCP is related to the elements at the top of the page. And this issue comes up precisely when these files are rendered above-the-fold and take too long to load. As a result, loading time and LCP are affected once again.
You’ll manage the resource load times by optimizing images, minifying and compressing CSS, JS, HTML files, and preloading critical assets.
The bottom line: how fast the browser receives and renders the content requested determines the LCP score.
Let’s understand how to fix all these issues in detail.
If you prefer, you can first watch the video that shows how to improve LCP with WP Rocket.
How to Reduce a Largest Contentful Paint Longer Than 2.5 s or 4 s on Mobile and Desktop
Here are ten ways to improve the Largest Contentful Paint performance and fix the Search Console status “LCP issue: longer than 2.5s or LCP issue: longer than 4s“, both from mobile and/or desktop.
🚀 For each suggestion, you’ll find a piece of information about its performance impact — from low to high. The highest the impact is, the highest chance that the Largest Contentful Paint score will improve after following that specific recommendation.
1. Improve the Time to First Byte and Reduce Server Response Time
Performance Impact: high 🚀🚀🚀
One of the main reasons for a bad LCP is a slow server response time.
Every time you want to consume any piece of content, the browser sends a request to the server. The TTFB measures how long it takes for the browser to receive the first byte of content from the server.
By improving your TTFB, you’ll improve your server response time and the LCP score.
Please note that a good TTFB should be under 200 ms — you can quickly check this metric by testing your URL’s site on WebPageTest.
There are two ways to fix a bad server time:
1. Enable Page Caching
By enabling page caching, your site’s pages will be stored as HTML files on the server after the page is loaded for the first time. As a result, the content will be displayed faster. It’s an easy and effective way to improve TTFB.
You can also choose one of the top WordPress hosting providers that include a server-level caching option.
A dedicated tab will allow you to enable mobile caching and set the options you prefer. WP Rocket enables 80% of web performance best practices automatically. So, if you’re in doubt, you’ll get covered anyway!
2. Choose a Fast Server Hosting Service
A fast hosting can make a huge difference in performance. And maybe it’s time to upgrade your hosting plan!
As the first thing, your hosting provider should have servers close to the majority of your users. The closer your users are to the server, the fastest the data will be sent.
You should also choose the right server host type. A dedicated hosting server will ensure the fastest performance. Take into consideration how much traffic your site gets, and make your decision.
By enabling caching and choosing a fast hosting, you’ll take care of the following PageSpeed Insights recommendations:
Reduce server response times (TTFB)
Serve static assets with an efficient cache policy.
2. Use a CDN
Performance Impact: medium 🚀🚀
A CDN helps you reduce the length of time between the user request and the server response. This amount of time is the latency. The back and forth between the browser request and the server response is the round trip time (RTT).
If your users are located far from the server’s location, it could take a while before all the assets (e.g., images, JS and CSS files, videos ) are sent. Latency and RTT will be high and will affect loading time and the LCP score.
You already saw how the location of your server could affect your site’s performance.
A CDN solves the issue thanks to a global network of servers. No matter where your users are located. Every time they request a page, they will receive the assets from the closest server. Simple as that.
RocketCDN is the best way to let your users access your site quickly and easily.
If you want to know more about the CDN benefits and the different types, you can read our article.
Choosing a CDN will help you address the following PageSpeed recommendations:
Serve static assets with an efficient cache policy
Enable text compression.
Please note that a CDN will address such recommendations only if properly configured. The default options might not be enough to improve performance as expected.
3. Defer JavaScript
Performance Impact: high 🚀🚀🚀
Render-blocking resources like JavaScript files are one of the main causes of a bad LCP score.
Deferring the JavaScript files will help you tackle the issue. In other words, you’ll change the priority of the JS files being loaded.
Remember? The browser parses the HTML, builds the DOM tree, and then renders the page — unless there is any blocking resource to slow the process down.
By deferring JavaScript, the browser will process and load the JS files only after parsing the HTML document and building the DOM tree. Since there won’t be anything to block the process, rendering will be much faster — and the LCP metric will improve.
You can add the defer attribute to the JavaScript files so that the browser can detect the resources to defer. The browser will analyze the HTML and build the DOM tree with no interruption.
You can choose this option in the File optimization tab. What’s more, you can easily exclude specific JS files from being deferred — in case the defer feature conflicts with any file.
You’ll address the “Eliminate render-blocking resources” PSI recommendation in a few clicks — even though the render-blocking resources issues don’t stop here.
Let’s move to the next point about tackling render-blocking resources.
4. Remove Unused JavaScript
Performance Impact: medium 🚀🚀
Another way to eliminate the render-blocking resources is to remove the JavaScript resources that are not used. They may not be used for two reasons:
They’re not used anymore on your site. They’re still in the code but are completely useless.
They aren’t included in the above-the-fold content. Therefore, they’re non-critical for building the DOM tree. Yet, these files have a reason to be there (e.g., Google Analytics tracking code).
You can find the list of the unused JS files in the PageSpeed report in the “Remove unused Javascript” section:
There are two ways to solve this issue in WordPress:
1. Load the JavaScript files only when needed. For instance, the files should be loaded only on the pages that need that specific file — in any other case, the execution of JS should be disabled. You can take care of this aspect with plugins such as Perfmatters and Assets Cleanup.
2. Delay the JavaScript files. The JavaScript files won’t be loaded until the first user interaction (e.g., scrolling, clicking a button). If there’s no user interaction, the JS files won’t be loaded at all. By delaying JavaScript, the JS files won’t be detected by Lighthouse nor listed in the “Remove unused Javascript files” recommendation — even though not all the scripts from the PageSpeed recommendation list can be safely delayed. For instance, the Google Analytics tracking code is usually included in this PageSpeed Insights recommendation. If you delay the JS files, the Google Analytics JS file won’t be reported anymore. Note: Delaying JS files doesn’t have the purpose of solving this PSI recommendation per se. However, it works well in addressing this PageSpeed audit and improving your LCP score. So, it’s good for you to know.
So, how can you delay JS resources? You have different options.
If you’re looking for a free plugin to delay JavaScript files, you can use Flying Scripts.
Another way to safely tackle any unused JavaScript is to take advantage of WP Rocket! The plugin allows you to delay the JavaScript execution in a few clicks from the File optimization tab. You can easily add the URLs you want to exclude from delaying execution:
As we mentioned, by removing unused Javascript files, you’ll address the specific PageSpeed recommendation. Overall, you’ll work towards “Eliminating render-blocking resources” and “Reducing javascript execution time”.
As for the JS files, you should also defer non-critical CSS — all the files not relevant for rendering the page. In other words, you should change the priority for these files, too.
They will load after the browser has rendered the most relevant content on the page.
While deferring the CSS files, you should also inline critical CSS — the resources above-the-fold that need to be loaded as fast as possible. It means that you should identify the critical CSS (or Critical Path CSS) and inline them inside the HTML structure.
If you want to implement both actions on WordPress, here’s how the process looks like:
First, you should extract and inline the Critical Path CSS (CPCSS) using one available generator tool. You can find one here.
Another tip is to avoid placing large non-critical CSS code in the <head> of the code.
If you want to take care of both critical and non-critical CSS quickly, you can take advantage of WP Rocket’s features!
An effective way to tackle CSS is to remove unused CSS. WP Rocket can also help you to do it easily, thanks to its dedicated feature. You only need to enable the Remove unused CSS option, and the plugin will remove the unused CSS from the HTML of each page.
By implementing these actions, you’ll address the “Eliminate render-blocking resources”, “Reduce unused CSS”, and “Avoid chaining critical requests” PageSpeed Insights recommendations.
6. Minify CSS and JS Files
Performance Impact: low 🚀
Another effective way to optimize Largest Contentful Paint is to minify CSS and JS files.
Minification comes down to optimizing your code by making it more compact. It means to remove any white spaces, line breaks, and comments included in the code. As a result, minification will reduce CSS and JS files’ size and make them load faster.
It sounds easy, but the reality is more complicated. It’s not always simple to minify both file types and be sure to have excluded all the right resources — especially if you’re not a developer. Either way, it’s time-consuming.
The easiest and most effective way to take care of minification is to use a plugin like WP Rocket.
In the file optimization tab, you’ll have the opportunity to minify both CSS and JavaScript files.
You’ll address the following PageSpeed Insights recommendations:
Minify CSS
Minify JS
Avoid enormous network payloads.
7. Optimize Your Images
Performance Impact: high 🚀🚀🚀
Optimizing images is another relevant way to fix a bad LCP score.
Images are often the LCP element from mobile or desktop. By improving their loading time, you’ll boost the Largest Contentful Paint performance.
Here’s what you can do to fix any performance issues about images.
Compress and resize your images. You should reduce the file size without losing quality. The smaller the image dimension is, the faster the loading time will be.
To be clear: if you use a tool to optimize your images on the desktop, you will only optimize the original size. The images that you upload on WordPress won’t be resized. As you may know, in WordPress, there are different image sizes. Unless you use a proper image optimization plugin, you won’t optimize anything for performance.
For optimizing a few images, you could use a tool like ImageOptim. On the other hand, if you want to optimize more images and their thumbnails in bulk, Imagify is the perfect solution. You’ll reduce your images’ weight without sacrificing their quality. You’ll save plenty of time!
Convert your images into new formats. Overall, Google recommends the WebP format. And that’s why all WordPress image optimizer plugins now include the option to convert images to WebP. Other formats you may take into account are JPEG 2000 and JPEG XR. These formats are smaller than the JPEG, PNG, and GIF ones and help improve performance.
Use responsive images. You shouldn’t use the same images’ size for desktop and mobile. For instance, if the desktop image size is large, the mobile image size should be medium.
Page builders like Elementor allow users to upload different image sizes according to the device. Mobile image optimization is pretty essential, and the mobile score matters the most. Don’t underestimate its impact on your LCP grade!
Exclude the LCP element from lazy-loading. While overall lazy-load helps improve loading time, it can make the LCP score worse, especially when the LCP element is an image and gets lazy-loaded. That’s why excluding the LCP element from lazy-load and displaying it directly in the HTML of the page is an excellent way to optimize the LCP score.
Use a static image instead of a slider. Sliders can be very heavy to load because of the code. On the other hand, a static image made by HTML code is lighter and faster.
By optimizing your images, you’ll address the following PageSpeed Insights audits:
Serve images in next-gen formats
Properly size images
Efficiently encode images
Avoid enormous network payloads.
8. Compress Text Files
Performance Impact: high 🚀🚀🚀
You should also compress text files such as HTML, CSS, or JavaScript resources.
Compression means to “zip” your files in a smaller and lighter format so that they load faster. Once you reduce their size, the transfer between browser and server will be quicker. The browser will be able to load these resources faster. Load time and LCP will improve.
You can use compression formats such as GZIP and Brotli. On the one hand, GZIP is supported by most of the hosts. On the other one, Brotli is more performant and currently mostly recommended. Learn more about GZIP vs. Brotli in our blog post.
You can easily enable GZIP compression on WordPress by using a plugin. You can choose between different options, from the straightforward Enable Gzip Compression plugin to WP Rocket, which automatically includes GZIP compression. Also, some hosts enable GZIP compression by default.
Either way, you’ll address the “Enable text compression” PageSpeed recommendation.
9. Use Preload for Critical Assets (As the Largest Contentful Paint Image)
Performance Impact: low 🚀
At this point, you know how much the assets above the fold are critical for a good performance score. These critical resources can be fonts, images, videos, CSS, or JavaScript files.
To improve your LCP score, you should always make the critical assets load as fast as possible.
So, you may be wondering how to preload the Largest Contentful Paint image.
The Preload option comes in handy. It tells the browser to prioritize the load of these resources. In other words, the Preload prevents the browser from discovering and loading these critical files (including the LCP image) until much later.
By using preload for critical assets, you’ll address the “Preload key requests” PageSpeed recommendation.
10. Establish Third-party Connections Early
Performance Impact: low 🚀
Making the third-party connections faster is an additional way to optimize your LCP performance.
You should use the Preconnect option.
Let’s say that there’s a CSS or JS file requested from a third-party, such as Facebook or Google Analytics. The browser will request the external resource.
If enabled, the Preconnect option tells the browser to establish a connection with the external domain as fast as possible. The browser will then handle the request in parallel with the ongoing rendering process.
You can include the rel=”preconnect” in your code:
As an alternative, you can use a plugin as Perfmatters.
Since your browser may not support the preconnect option, it’s always best to implement dns-prefetch as a fallback technique. You’ll then resolve the DNS lookups faster. In other words, the external files will load more quickly, especially on mobile networks.
You can add the rel=”dns-prefetch” to your code — as a separate tag from the preconnect attribute:
WP Rocket’s Preload tab allows you to prefetch the DNS requests. You only have to specify the external hosts to be prefetched:
By establishing third-party connections earlier, you’ll improve the Time to First Byte and the server response time. You’ll also address the “Preconnect to required origins” PageSpeed recommendation.
Start Optimizing Your LCP Score on WordPress Today
You should now understand why Largest Contentful Paint is essential for performance and user experience and how you can improve its score. By applying all these optimization techniques, you’ll enhance the LCP grade on your WordPress site.
Not a WP Rocket customer yet? Save yourself time and let WP Rocket do the job for you. WP Rocket is the easiest way to get an excellent LCP score. You don’t even have to touch any settings! WP Rocket will automatically apply 80% of web performance best practices. You’ll see an instant improvement to the naked eye in your Core Web Vitals scores right away.
What’s more, you’ll stop managing multiple web performance plugins. You will only need WP Rocket to boost your LCP grade — no technical knowledge required, we promise!
Do you want to take a look first? Then watch our video and learn how to improve Largest Contentful Paint with WP Rocket in a few clicks!
First Input Delay (FID)What’s the First Input Delay and what’s the impact on UX and SEO performance? On this page, you’ll learn what FID is, how you can test it, and what factors affect its grade. You’ll also understand how to fix a bad score from mobile and desktop (FID longer than 100 or 300 ms) and improve your WordPress performance. Everything in plain English!
Cumulative Layout Shift (CLS)Wondering what Cumulative Layout Shift means and what’s the impact on your UX and SEO performance? Keep reading! You’ll find out what CLS is, how you can test it, and what factors affect its score. You’ll discover how to avoid large layout shifts and fix a bad grade from mobile and desktop (Cumulative Layout Shift more than 0.25 or 0.1 s). Everything in plain English!


 Part 3. Run PhotoRecRunning PhotoRec can help you to recover the lost files from hard disks to the external drive. Now you will recover the NAS files to the “recup1” (example: recup+{disk_number}) folder on the external drive.


 Part 4. Run QRescueRun QRescue can help you to recover the files retrieved by PhotoRec. Now you will recover the files from the “recup+{number}” folder to the “restore+{number}” folder which auto creates on your external drive.


 ” button next to the device to display the device IP and SmartURL.

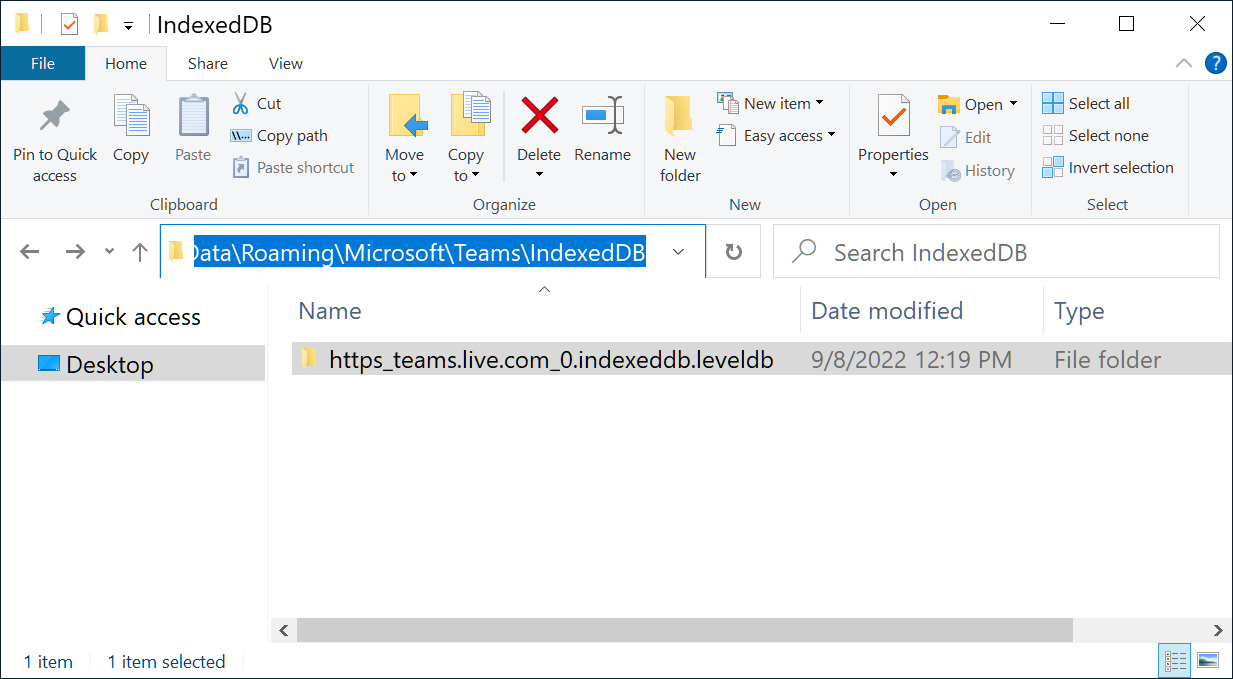
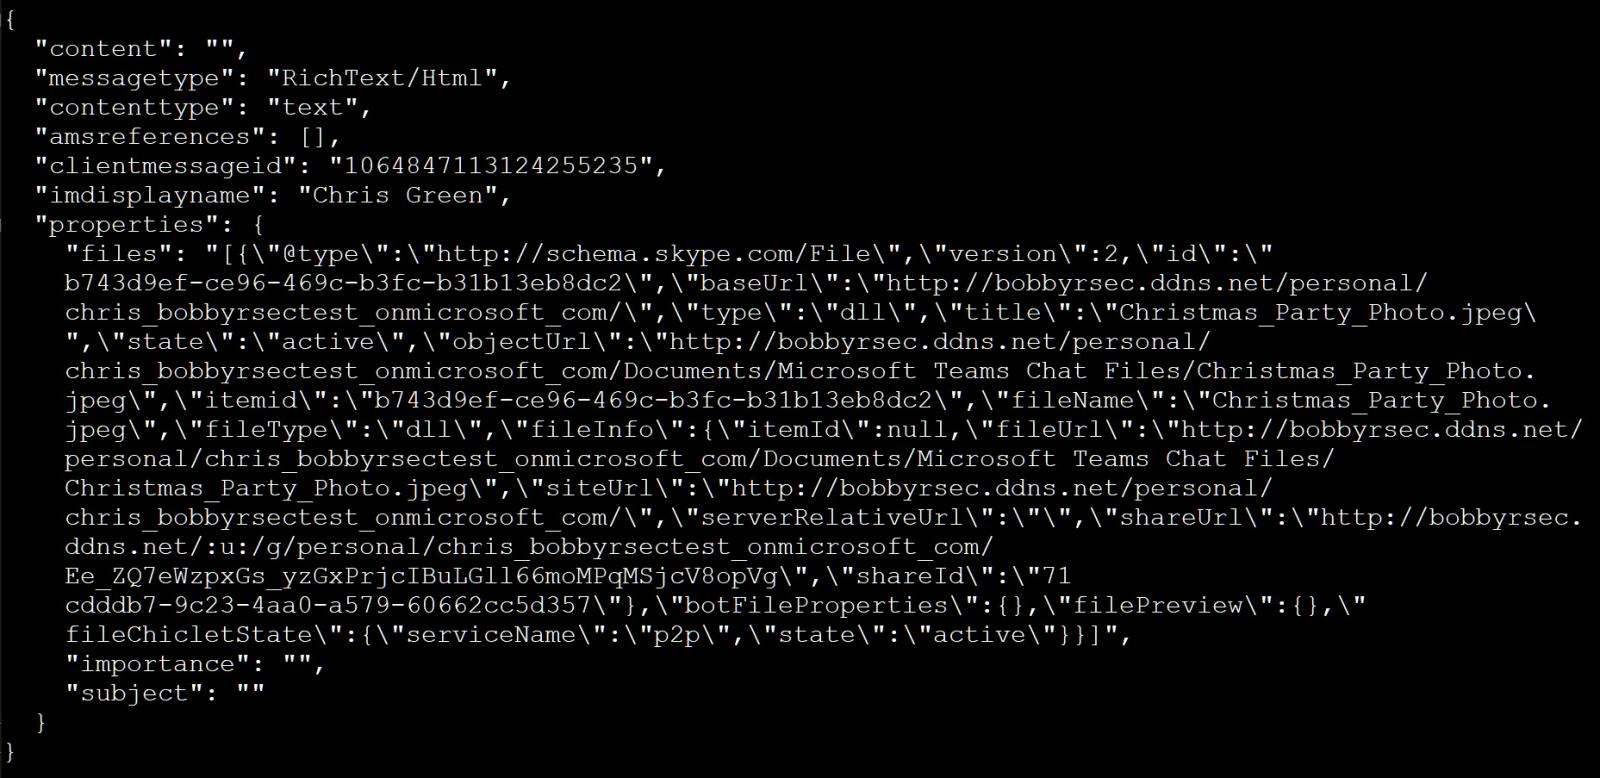
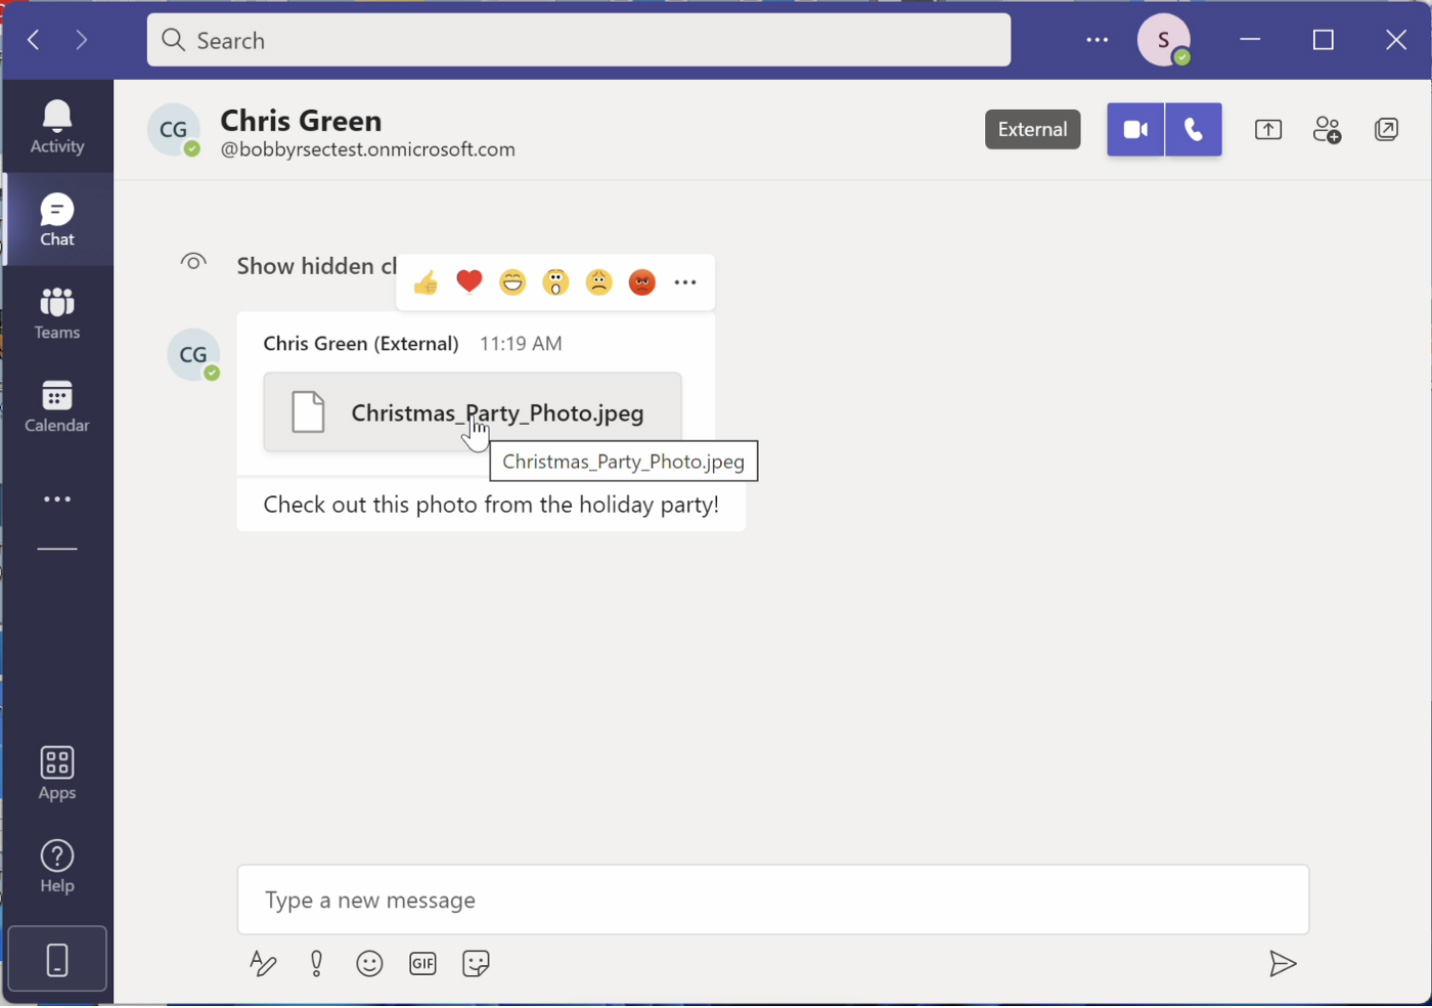


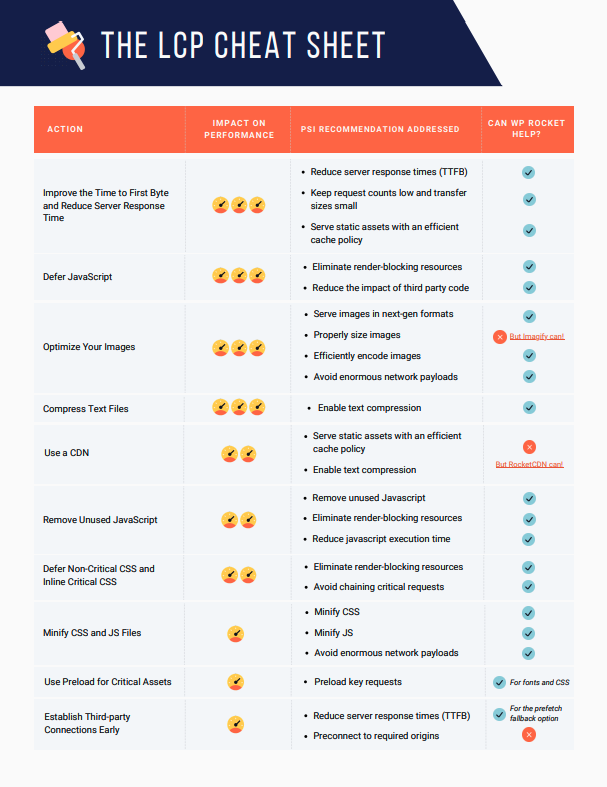


 First Input Delay (FID)What’s the First Input Delay and what’s the impact on UX and SEO performance? On this page, you’ll learn what FID is, how you can test it, and what factors affect its grade. You’ll also understand how to fix a bad score from mobile and desktop (FID longer than 100 or 300 ms) and improve your WordPress performance. Everything in plain English!
 Cumulative Layout Shift (CLS)Wondering what Cumulative Layout Shift means and what’s the impact on your UX and SEO performance? Keep reading! You’ll find out what CLS is, how you can test it, and what factors affect its score. You’ll discover how to avoid large layout shifts and fix a bad grade from mobile and desktop (Cumulative Layout Shift more than 0.25 or 0.1 s). Everything in plain English!