QNAP has warned customers today that some of its Network Attached Storage (NAS) devices (with non-default configurations) are vulnerable to attacks that would exploit a three-year-old critical PHP vulnerability allowing remote code execution.
“A vulnerability has been reported to affect PHP versions 7.1.x below 7.1.33, 7.2.x below 7.2.24, and 7.3.x below 7.3.11. If exploited, the vulnerability allows attackers to gain remote code execution,” QNAP explained in a security advisory released today.
“To secure your device, we recommend regularly updating your system to the latest version to benefit from vulnerability fixes.”
The Taiwanese hardware vendor has already patched the security flaw (CVE-2019-11043) for some operating system versions exposed to attacks (QTS 5.0.1.2034 build 20220515 or later and QuTS hero h5.0.0.2069 build 20220614 or later).
However, the bug affects a wide range of devices running:
QTS 5.0.x and later
QTS 4.5.x and later
QuTS hero h5.0.x and later
QuTS hero h4.5.x and later
QuTScloud c5.0.x and later
QNAP customers who want to update their NAS devices to the latest firmware automatically need to log on to QTS, QuTS hero, or QuTScloud as administrator and click the “Check for Update” button under Control Panel > System > Firmware Update.
You can also manually upgrade your device after downloading the update on the QNAP website from Support > Download Center.
QNAP devices targeted by ransomware
Today’s warning comes after the NAS maker warned its customers on Thursday to secure their devices against active attacks deploying DeadBolt ransomware payloads.
BleepingComputer also reported over the weekend that ech0raix ransomware has started targeting vulnerable QNAP NAS devices again, according to sample submissions on the ID Ransomware platform and multiple user reports who had their systems encrypted.
Until QNAP issues more details on ongoing attacks, the infection vector used in these new DeadBolt and ech0raix campaigns remains unknown.
While QNAP is working on patching the CVE-2019-11043 PHP vulnerability in all vulnerable firmware versions, you should ensure that your device is not exposed to Internet access as an easy way to block incoming attacks.
As QNAP has advised in the past, users with Internet-exposed NAS devices should take the following measures to prevent remote access:
Disable the Port Forwarding function of the router: Go to the management interface of your router, check the Virtual Server, NAT, or Port Forwarding settings, and disable the port forwarding setting of the NAS management service port (port 8080 and 433 by default).
Disable the UPnP function of the QNAP NAS: Go to myQNAPcloud on the QTS menu, click the “Auto Router Configuration,” and unselect “Enable UPnP Port forwarding.”
QNAP also provides detailed info on how to toggle off remote SSH and Telnet connections, change the system port number, change device passwords, and enable IP and account access protection to further secure your device.
Update June 22, 08:45 EDT: After this story was published, QNAP’s PSIRT team updated the original advisory and told BleepingComputer that devices with default configurations are not impacted by CVE-2019-11043.
Also, QNAP said that the Deadbolt ransomware attacks are targeting devices running older system software (released between 2017 and 2019).
For CVE-2019-11043, described in QSA-22-20, to affect our users, there are some prerequisites that need to be met, which are:
nginx is running, and
php-fpm is running.
As we do not have nginx in our software by default, QNAP NAS are not affected by this vulnerability in their default state. If nginx is installed by the user and running, then the update provided with QSA-22-20 should be applied as soon as possible to mitigate associated risks.
We are updating our security advisory QSA-22-20 to reflect the facts stated above. Again we would like to point out that most QNAP NAS users are not affected by this vulnerability since its prerequisites are not met. The risk only exists when there is user-installed nginx present in the system.
We have also updated the story to reflect the new information provided by QNAP.
Microsoft has revealed that this week’s Microsoft 365 worldwide outage was caused by an infrastructure power outage that led to traffic management servicing failovers in multiple regions.
Starting on Monday, June 20, at 11:00 PM UTC, customers began experiencing and reporting several issues while trying to access and use Microsoft 365 services.
According to Microsoft, problems encountered during the incident included delays and failures when accessing some Microsoft 365 services.
Customer reports also shared info on continuous re-login requests, emails not getting delivered after being stuck in queues, and the inability to access Exchange Online mailboxes despite trying all available connection methods.
The affected services included the Microsoft Teams communication platform, the Exchange Online hosted email platform, SharePoint Online, Universal Print, and the Graph API.
Microsoft’s response while investigating the root cause behind the outage also brought to light some issues related to how the company fails to share new incident-related info with customers.
Even though Microsoft told customers they could find out more about this incident from the admin center under EX394347 and MO394389, user reports suggest that those incident tickets were not showing up, effectively keeping the customers in the dark.
16-hour-long incident caused by power failure
More than 16 hours after the first signs of the outage were detected, on Tuesday, June 21, at 3:27 PM UTC, Microsoft said in an update to the MO394389 service alert sent to customers that the root cause was an infrastructure power loss.
“An infrastructure power outage necessitated failing over Microsoft 365 traffic management servicing users primarily in Western Europe,” the company explained.
“This action failed to properly complete, leading to functional delays and access failures for several Microsoft 365 services.”
The outage was most severe for customers in Western Europe. Still, the impact extended to “a small percentage” users throughout EMEA (Europe, the Middle East, and Africa), North America, and the Asia-Pacific regions.
Redmond also refuted reports that a separate outage affecting the company’s Outlook on the web service was also linked to this incident.
“We’ve confirmed from our updated service monitoring that all services remain healthy following the targeted restarts,” Microsoft added.
“Additionally, we completed our investigation into the potential remaining impact to Outlook on the web and confirmed that this is a known issue
Cloudflare revealed that the incident was caused by a configuration error while implementing a change that would have otherwise increased its network’s resilience.
The National Security Agency (NSA) and cybersecurity partner agencies issued an advisory today recommending system administrators to use PowerShell to prevent and detect malicious activity on Windows machines.
PowerShell is frequently used in cyberattacks, leveraged mostly in the post-exploitation stage, but the security capabilities embedded in Microsoft’s automation and configuration tool can also benefit defenders in their forensics efforts, improve incident response, and to automate repetitive tasks.
The NSA and cyber security centres in the U.S. (CISA), New Zealand (NZ NCSC), and the U.K. (NCSC-UK) have created a set of recommendations for using PowerShell to mitigate cyber threats instead of removing or disabling it, which would lower defensive capabilities.
“Blocking PowerShell hinders defensive capabilities that current versions of PowerShell can provide, and prevents components of the Windows operating system from running properly. Recent versions of PowerShell with improved capabilities and options can assist defenders in countering abuse of PowerShell”
Lower risk for abuse
Reducing the risk of threat actors abusing PowerShell requires leveraging capabilities in the framework such as PowerShell remoting, which does not expose plain-text credentials when executing commands remotely on Windows hosts.
Administrators should be aware that enabling this feature on private networks automatically adds a new rule in Windows Firewall that permits all connections.
Customizing Windows Firewall to allow connections only from trusted endpoints and networks helps reduce an attacker’s chance for successful lateral movement.
For remote connections, the agencies advise using the Secure Shell protocol (SSH), supported in PowerShell 7, to add the convenience and security of public-key authentication:
remote connections don’t need HTTPS with SSL certificates
no need for Trusted Hosts, as required when remoting over WinRM outside a domain
secure remote management over SSH without a password for all commands and connections
PowerShell remoting between Windows and Linux hosts
Another recommendation is to reduce PowerShell operations with the help of AppLocker or Windows Defender Application Control (WDAC) to set the tool to function in Constrained Language Mode (CLM), thus denying operations outside the policies defined by the administrator.
“Proper configuration of WDAC or AppLocker on Windows 10+ helps to prevent a malicious actor from gaining full control over a PowerShell session and the host”
Detecting malicious PowerShell use
Recording PowerShell activity and monitoring the logs are two recommendations that could help administrators find signs of potential abuse.
The NSA and its partners propose turning on features like Deep Script Block Logging (DSBL), Module Logging, and Over-the-Shoulder transcription (OTS).
The first two enable building a comprehensive database of logs that can be used to look for suspicious or malicious PowerShell activity, including hidden action and the commands and scripts used in the process.
With OTS, administrators get records of every PowerShell input or output, which could help determine an attacker’s intentions in the environment.
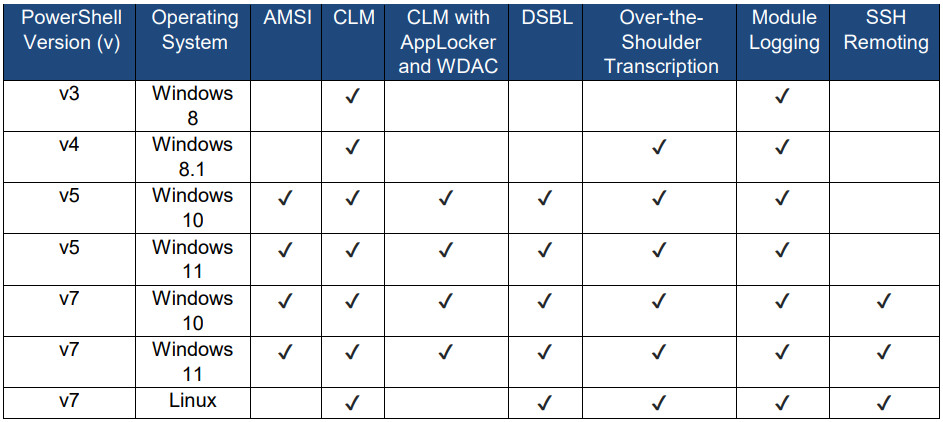
Administrators can use the table below to check the features that various PowerShell versions provide to help enable better defenses on their environment:
Security features present in PowerShell versions
The document the NSA released today states that “PowerShell is essential to secure the Windows operating system,” particularly the newer versions that dealt away with previous limitations.
When properly configured and managed, PowerShell can be a reliable tool for system maintenance, forensics, automation, and security.
The full document, titled “Keeping PowerShell: Security Measures to Use and Embrace” is available here [PDF].
Today, there is no question that IT admins are busier than ever, juggling multiple tasks and responsibilities. These include managing and administering Exchange email services, both on-premises and in the cloud. Exchange Online is an extremely popular solution for organizations to host mail services as many businesses have migrated email and file storage to the public cloud. PowerShell is a great scripting language that allows admins to make the best use of their time by automating common tasks and day-to-day activities.
Why use PowerShell?
Before considering PowerShell specifically in the context of Exchange Online, why should admins consider using PowerShell in general? Today, PowerShell has quickly become one of the most popular and fully-featured scripting languages. Many software vendors are developing and releasing their own PowerShell modules, allowing admins to control, configure, and manage many different solutions across the board with the familiar PowerShell syntax.
IT admins, especially Windows admins, are familiar with PowerShell as version 1.0 was released in 2006 for Windows Server 2003, Windows XP SP2, and Windows Vista. In addition, Windows PowerShell is included in modern Windows Server and client operating systems, with the newer PowerShell Core as an optional download.
PowerShell is both familiar and understandable for many admins, given its verb-noun constructs and very human-readable syntax. However, even for non-developers, writing simple PowerShell one-liner scripts can significantly reduce the number of manual tasks performed daily.
PowerShell is also very extensible. As mentioned, third-party software vendors can write their own PowerShell snap-ins and modules to integrate into the PowerShell framework, allowing PowerShell to be customized to work with many different software solutions. Third-party vendors are not the only ones that have extensively used Powershell modules and cmdlets. Most modern Microsoft software and cloud solutions have their own PowerShell modules, allowing for seamless automation, including configuration and management.
What is Exchange Online (EXO)?
Microsoft Exchange Online (EXO) is a hosted unified messaging solution that provides email, calendaring, contacts, and task management from a wide range of devices. Exchange Online is a modern counterpart to the traditional Exchange on-premises solutions organizations have used for decades. In addition, Exchange Online can leverage modern Microsoft technologies, including Azure Active Directory. With Exchange Online’s Azure integration, organizations have the tools needed to support the modern hybrid workforce worldwide.
Exchange Online is the email component included in an Office 365 or Microsoft 365 subscription. However, you can purchase Exchange Online services without the other components of Office/Microsoft 365. With Exchange Online, you retain control over the messaging services offered to your users.
Microsoft Exchange Online PowerShell
Exchange Online includes the ability to administer, configure, and manage your Exchange Online environment using PowerShell. In addition, Exchange Online Powershell provides many robust cmdlets allowing administrators to automate many common tasks.
The Exchange Online PowerShell V2 module is the latest iteration and release of the Exchange Online module and provides modern features, such as the ability to work with multi-factor authentication (MFA). With MFA, organizations can greatly bolster the security of their PowerShell sessions by requiring more than one authentication factor, such as a one-time code delivered via an authenticator app or text message.
Automated Configuration and Benefits of Exchange Online PowerShell
IT admins may ask why they would want to use PowerShell instead of simply using the GUI that is familiar and does most of what they way to do. When performing specific tasks one time or only a few times during a day on one object, the GUI tools are well suited to carry out these tasks and are quite efficient at carrying out a single job or a few tasks in an ad-hoc way. However, there are multiple reasons why you would use PowerShell instead of the Exchange Online GUI management tools. These include:
Bulk operations
Data filtering
Data piping
Bulk operations
GUI management tools do not scale well when dealing with tasks that may need to be performed on multiple users or other objects. Also, what if you need to carry out specific tasks on hundreds of objects on a schedule? GUI management tools are not suited for doing this. For example, can you imagine manually changing an attribute on hundreds of Exchange Online users through the GUI? It would be extremely time-consuming and not very efficient.
When needing to perform bulk operations on multiple objects, PowerShell is much better suited at doing this than the Exchange Online GUI. For example, when manually changing values and attributes on an object numerous times through a GUI, there is a high likelihood a mistake can be made. However, if you use PowerShell to make the changes, the actions are repeated precisely each time the code updates the object, eliminating mistakes due to human error.
Making changes using a PowerShell script on hundreds of users might take minutes or less, whereas making the same changes manually through the GUI might take hours. It can save many hours and manual labour for low-level administrative tasks.
Data filtering
One of the powerful reasons to use PowerShell with Exchange Online is the data filtering capabilities of PowerShell. Powershell is a powerful object-oriented scripting language that can pull out objects and filter data in ways that may not be available in the Exchange Online Management GUI.
When you think about it, GUI tools only allow filtering by the specific criteria built into the GUI tool or management console. If the specific filter you need is not available, you can’t see the information in the way you need it displayed. In addition, GUI tools generally do not provide IT admins with the filtering and data extraction capabilities of command-line tools and scripting languages.
With the filtering capabilities built into PowerShell for Exchange Online, IT admins can query and filter data as needed. PowerShell is an object-oriented scripting language that can return various data objects. For example, let’s say you want to get the archivestatus attribute from all your user mailboxes. You could do that with a simple PowerShell one-liner as follows:
get-mailbox | select name, archivestatus
With Exchange Online PowerShell, getting the value of any mailbox attribute is the same as following this simple syntax shown above. Now, things get more interesting by piping returned values and data into other PowerShell cmdlets.
Data piping
Another powerful capability of data filtering with PowerShell is to take the data returned from a data query with a filter and then pipe the return into another PowerShell command. This simple feature contained natively in PowerShell allows querying for specific matching objects such as mailboxes and then doing something with those returned objects, such as running another Exchange Online PowerShell cmdlet on them.
A very simple example of piping your return data into another PowerShell cmdlet is a simple “out-file” cmdlet. It allows you to export your returned data to a simple text file.
But, you can do anything you want with the pipe from a get-mailbox, get-user, or other PowerShell “get” command. You can think of the workflow like this: you are querying for a specific list of objects that match the filter criteria you have specified and then take that set of matching objects and then feed these into another PowerShell cmdlet.
Manually Configuring Exchange Online PowerShell
To get started using Exchange Online PowerShell cmdlets, you need first to install the required PowerShell modules to work with Exchange Online PowerShell. The Exchange Online PowerShell module is part of several modules that fall under the umbrella of services contained in Microsoft 365. As mentioned earlier, the Exchange Online service can be purchased as a standalone product or included with the mail services offered by Microsoft 365.
Each of the Microsoft 365 services has its own PowerShell modules, including:
Azure Active Directory (Azure AD)
Exchange Online
SharePoint Online
Skype for Business Online
Teams
If you are explicitly working with Exchange Online (EXO), two modules are needed to interact with the low-level Azure AD user objects and the Exchange Online mailboxes:
Azure Active Directory (Azure AD) PowerShell – Allows querying the Azure Active Directory environment users, attributes, etc
Exchange Online PowerShell – Allows querying and performing critical tasks at the mailbox level for users with Exchange Online mailboxes
Let’s see how to install both of these PowerShell modules for specifically interacting with Exchange Online via PowerShell.
Azure Active Directory (Azure AD)
First, we are going to install the AzureAD PowerShell module. As a note. It does not matter if you install the AzureAD module first or the ExchangeOnline module. To install the module, run the following cmdlet:
Install-Module AzureAD
Accept the warning message displayed regarding the untrusted repository by typing “Y.” Learn more about AzureAD PowerShell module cmdlet reference here: AzureAD Module | Microsoft Docs.
Installing AzureAD PowerShell module using Windows Terminal
Installing Exchange Online PowerShell Module
Now, installing the Exchange Online PowerShell module is the same process. To install the Exchange Online Powershell module, run the following cmdlet:
Install-Module ExchangeOnlineManagement
Installing the ExchangeOnlineManagement PowerShell module
Accept the warning message displayed regarding the untrusted repository by typing “Y.” For details on using the Exchange Online Management PowerShell, look at Microsoft’s Exchange Online PowerShell documentation here: Exchange Online PowerShell | Microsoft Docs.
Allowing all of the features of Exchange Online to PowerShell
By default, all accounts you create in Microsoft 365 can connect to and use Exchange Online PowerShell. However, IT admins can use Exchange Online PowerShell to enable or disable a user’s ability to use Exchange Online PowerShell in the environment.
As a security note, just because a user can connect to Exchange Online PowerShell, it does not give them administrator access. A user’s permissions in Exchange Online are defined by the built-in role-based access control (RBAC) used by Exchange Online.
Using the Exchange Online PowerShell cmdlets shown below, Exchange administrators can enable or disable users’ access to Exchange Online PowerShell.
To enable or disable for multiple users based on a user attribute, you can also use the filtering and piping features discussed above with Exchange Online PowerShell. To enable Exchange Online Powershell for users with a specific Title, like “Manager,” you can do the following:
Connecting to Exchange Online PowerShell with Basic Authentication
If you search for connecting to Exchange Online PowerShell, you will see reference to basic authentication and modern authentication. To follow best practices, don’t attempt to use Basic Authentication any longer. All organizations at this point need to be switching to modern authentication with MFA enabled.
There is an additional reason. Microsoft is deprecating Basic Authentication access to Exchange Online on October 1, 2022. With this announcement, starting on October 1, 2022, they will begin disabling Basic Authentication for Outlook, EWS, RPS, POP, IMAP, and EAS protocols in Exchange Online. SMTP Auth will also be disabled if it is not being used. Read the official announcement here.
If you want to use the older Exchange Online Remote connection using Basic Authentication, you can view those instructions from Microsoft here. Again, note this method will be deprecated later this year.
Connecting to Exchange Online PowerShell with Modern Authentication
To connect to Exchange Online, use the Exchange Online PowerShell V2 module (installation shown above) to connect to your Exchange Online environment. The EXO PowerShell V2 module uses modern authentication and works with multi-factor authentication (MFA) for securing your Exchange Online PowerShell environment.
To connect to your Exchange Online environment, you need to import the ExchangeOnlineManagement module and then use the Connect-ExchangeOnline cmdlet.
Import-Module ExchangeOnlineManagement
Connect-ExchangeOnline -ShowProgress $true
Connecting to Exchange Online using the Connect-ExchangeOnline cmdlet
It will bring up the login box to log into your Office/Microsoft 365 account. It allows taking advantage of the MFA configured for the account, etc.
Logging into Exchange Online with the Exchange Online PowerShell management module
The Top 10 Most Common Tasks in Exchange Online PowerShell
Now that we have installed the Exchange Online PowerShell module, what are some common tasks we can accomplish using Exchange Online PowerShell? Let’s take a look at the following:
Getting Migration information
Getting mailboxes
Viewing mailbox statistics
Increasing deleted items retention
Enable Mailbox Audit Logging
Identify inactive mailboxes
Identify mailboxes enabled with forwarding
Setting mailbox autoreply configuration
Assigning roles to users
Identifying ActiveSyncDevices
1. Getting Migration Information
You may be migrating users from one Exchange Server, such as on-premises, to another Exchange Server (Exchange Online). The Get-MigrationUser cmdlet is a great command to check the status of a migration batch used to migrate user batches.
One of the most basic tasks an Exchange admin needs to carry out is getting information about mailboxes. The most basic cmdlet to use for this use case is the Get-Mailbox cmdlet. The Get-Mailbox cmdlet is generally used with piping into other cmdlets to pull mailboxes meeting specific filters and then performing configuration on the mailboxes queried with the Get-Mailbox cmdlet.
Using the Get-Mailbox cmdlet to get mailbox information in Exchange Online
3. Viewing mailbox statistics
A common task of Exchange admins is keeping an eye on the size of mailboxes in the environment, so these do not become unwieldy. Using the Get-MailboxStatistics cmdlet allows getting the size information, the number of messages it contains, and the last time it was accessed.
Get-MailboxStatistics -identity <username>
Using the Get-MailboxStatistics cmdlet in Exchange Online to get mailbox information
4. Increasing deleted items retention
By default, Exchange Online is configured to retain deleted items for 14 days. However, this limit can be increased easily for users using the Exchange Online PowerShell module cmdlet Set-Mailbox.
The Set-Mailbox cmdlet allows configuring many aspects of the user mailbox in Exchange Online
5. Enable Mailbox Audit Logging
Even though audit logging is on by default for all organizations in Microsoft 365, only users with E5 licenses will return mailbox audit log events in audit log searches. If you want to retrieve audit log events for users without an E5 license, PowerShell is a great way to do that. You can use the Exchange Online PowerShell cmdlet one-liner:
Getting the last logon time using Exchange Online PowerShell
7. Identify mailboxes enabled with forwarding
What if you want to identify mailboxes enabled with a forwarding address as these have not been documented? You can easily do this with another useful Exchange Online PowerShell one-liner:
Get-mailbox -ResultSize Unlimited| where {$_.ForwardingAddress -ne $Null} | select DisplayName,ForwardingAddress
8. Setting mailbox autoreply configuration
A user may forget to set their autoreply configuration. If they go away on vacation or if there is a need to set the autoreply on a user mailbox for other reasons, you can easily accomplish this using PowerShell. It eliminates the need to log in as that user and do this interactively in Outlook.
To do this, you can use the Set-MailboxAutoReplyConfiguration cmdlet. It allows setting both an internal message and an external message for the mailbox.
Setting autoreply messages using PowerShell
9. Manage roles for groups
Using the New-ManagementRoleAssignment cmdlet, you can assign a management role to a management role group, management role assignment policy, user, or universal security group.
New-ManagementRoleAssignment -Role “Mail Recipients” -SecurityGroup “Tier 2 Help Desk”
Assigning management roles using the New-ManagementRoleAssignment cmdlet
10. Identifying ActiveSync Devices
Identifying and seeing ActiveSync Devices in use in the organization can easily be accomplished with Exchange Online PowerShell using the Get-MobileDevice cmdlet.
Getting mobile devices paired with Exchange Online Users
To properly protect your Hyper-V virtual machines, use Altaro VM Backup to securely backup and replicate your virtual machines. We work hard perpetually to give our customers confidence in their Hyper-V backup strategy.
To keep up to date with the latest Hyper-V best practices, become a member of the DOJO | Hyper-V now (it’s free).
The Future is Automated
Many organizations are now migrating and hosting their mail services in the cloud. Exchange Online provides businesses with a great way to host their mail services in Microsoft’s cloud infrastructure, either as a standalone subscription or part of their Office/Microsoft 365 subscription.
While Exchange admins can undoubtedly use the GUI management tools for daily tasks, Exchange Online PowerShell provides a great way to automate and carry out everyday tasks much more quickly, efficiently, and using automation. The Exchange Online PowerShell module is easy to install. In addition, it provides quick time to value by allowing Exchange admins to easily query and configure multiple objects in their Exchange Online environments.
Used in automated processes, Exchange Online PowerShell allows Exchange admins to carry out tasks consistently and in a way that helps to eliminate human error from mundane low-level tasks.
Cisco advises owners of end-of-life Small Business RV routers to upgrade to newer models after disclosing a remote code execution vulnerability that will not be patched.
The vulnerability is tracked as CVE-2022-20825 and has a CVSS severity rating of 9.8 out of 10.0.
According to a Cisco security advisory, the flaw exists due to insufficient user input validation of incoming HTTP packets on the impacted devices.
An attacker could exploit it by sending a specially crafted request to the web-based management interface, resulting in command execution with root-level privileges.
Impact and remediation
The vulnerability impacts four Small Business RV Series models, namely the RV110W Wireless-N VPN Firewall, the RV130 VPN Router, the RV130W Wireless-N Multifunction VPN Router, and the RV215W Wireless-N VPN Router.
This vulnerability only affects devices with the web-based remote management interface enabled on WAN connections.
While the remote management feature is not enabled in the default configuration, brief searches using Shodan found exposed devices.
To determine whether remote management is enabled, admins should log in to the web-based management interface, navigate to “Basic Settings > Remote Management,” and verify the state of the relevant check box.
Cisco states that they will not be releasing a security update to address CVE-2022-20825 as the devices are no longer supported. Furthermore, there are no mitigations available other than to turn off remote management on the WAN interface, which should be done regardless for better overall security.
Users are advised to apply the configuration changes until they migrate to Cisco Small Business RV132W, RV160, or RV160W Routers, which the vendor actively supports.
Cisco warned last year that admins should upgrade to newer models after disclosing that they would not fix a critical vulnerability in Universal Plug-and-Play (UPnP) service.
This week, Cisco patched a critical vulnerability in Cisco Secure Email that could allow attackers to bypass authentication and login into the web management interface of the Cisco email gateway.
A Year in Review of 0-days Used In-the-Wild in 2021
Posted by Maddie Stone, Google Project Zero
This is our third annual year in review of 0-days exploited in-the-wild [2020, 2019]. Each year we’ve looked back at all of the detected and disclosed in-the-wild 0-days as a group and synthesized what we think the trends and takeaways are. The goal of this report is not to detail each individual exploit, but instead to analyze the exploits from the year as a group, looking for trends, gaps, lessons learned, successes, etc. If you’re interested in the analysis of individual exploits, please check out our root cause analysis repository.
We perform and share this analysis in order to make 0-day hard. We want it to be more costly, more resource intensive, and overall more difficult for attackers to use 0-day capabilities. 2021 highlighted just how important it is to stay relentless in our pursuit to make it harder for attackers to exploit users with 0-days. We heard over and over and over about how governments were targeting journalists, minoritized populations, politicians, human rights defenders, and even security researchers around the world. The decisions we make in the security and tech communities can have real impacts on society and our fellow humans’ lives.
We’ll provide our evidence and process for our conclusions in the body of this post, and then wrap it all up with our thoughts on next steps and hopes for 2022 in the conclusion. If digging into the bits and bytes is not your thing, then feel free to just check-out the Executive Summary and Conclusion.
Executive Summary
2021 included the detection and disclosure of 58 in-the-wild 0-days, the most ever recorded since Project Zero began tracking in mid-2014. That’s more than double the previous maximum of 28 detected in 2015 and especially stark when you consider that there were only 25 detected in 2020. We’ve tracked publicly known in-the-wild 0-day exploits in this spreadsheet since mid-2014.
While we often talk about the number of 0-day exploits used in-the-wild, what we’re actually discussing is the number of 0-day exploits detected and disclosedas in-the-wild. And that leads into our first conclusion: we believe the large uptick in in-the-wild 0-days in 2021 is due to increased detection and disclosure of these 0-days, rather than simply increased usage of 0-day exploits.
With this record number of in-the-wild 0-days to analyze we saw that attacker methodology hasn’t actually had to change much from previous years. Attackers are having success using the same bug patterns and exploitation techniques and going after the same attack surfaces. Project Zero’s mission is “make 0day hard”. 0-day will be harder when, overall, attackers are not able to use public methods and techniques for developing their 0-day exploits. When we look over these 58 0-days used in 2021, what we see instead are 0-days that are similar to previous & publicly known vulnerabilities. Only two 0-days stood out as novel: one for the technical sophistication of its exploit and the other for its use of logic bugs to escape the sandbox.
So while we recognize the industry’s improvement in the detection and disclosure of in-the-wild 0-days, we also acknowledge that there’s a lot more improving to be done. Having access to more “ground truth” of how attackers are actually using 0-days shows us that they are able to have success by using previously known techniques and methods rather than having to invest in developing novel techniques. This is a clear area of opportunity for the tech industry.
We had so many more data points in 2021 to learn about attacker behavior than we’ve had in the past. Having all this data, though, has left us with even more questions than we had before. Unfortunately, attackers who actively use 0-day exploits do not share the 0-days they’re using or what percentage of 0-days we’re missing in our tracking, so we’ll never know exactly what proportion of 0-days are currently being found and disclosed publicly.
Based on our analysis of the 2021 0-days we hope to see the following progress in 2022 in order to continue taking steps towards making 0-day hard:
All vendors agree to disclose the in-the-wild exploitation status of vulnerabilities in their security bulletins.
Exploit samples or detailed technical descriptions of the exploits are shared more widely.
Continued concerted efforts on reducing memory corruption vulnerabilities or rendering them unexploitable.Launch mitigations that will significantly impact the exploitability of memory corruption vulnerabilities.
A Record Year for In-the-Wild 0-days
2021 was a record year for in-the-wild 0-days. So what happened?
Is it that software security is getting worse? Or is it that attackers are using 0-day exploits more? Or has our ability to detect and disclose 0-days increased? When looking at the significant uptick from 2020 to 2021, we think it’s mostly explained by the latter. While we believe there has been a steady growth in interest and investment in 0-day exploits by attackers in the past several years, and that security still needs to urgently improve, it appears that the security industry’s ability to detect and disclose in-the-wild 0-day exploits is the primary explanation for the increase in observed 0-day exploits in 2021.
While we often talk about “0-day exploits used in-the-wild”, what we’re actually tracking are “0-day exploits detected and disclosed as used in-the-wild”. There are more factors than just the usethat contribute to an increase in that number, most notably: detection and disclosure. Better detection of 0-day exploits and more transparently disclosed exploited 0-day vulnerabilities is a positive indicator for security and progress in the industry.
Overall, we can break down the uptick in the number of in-the-wild 0-days into:
More detection of in-the-wild 0-day exploits
More public disclosure of in-the-wild 0-day exploitation
More detection
In the 2019 Year in Review, we wrote about the “Detection Deficit”. We stated “As a community, our ability to detect 0-days being used in the wild is severely lacking to the point that we can’t draw significant conclusions due to the lack of (and biases in) the data we have collected.” In the last two years, we believe that there’s been progress on this gap.
Anecdotally, we hear from more people that they’ve begun working more on detection of 0-day exploits. Quantitatively, while a very rough measure, we’re also seeing the number of entities credited with reporting in-the-wild 0-days increasing. It stands to reason that if the number of people working on trying to find 0-day exploits increases, then the number of in-the-wild 0-day exploits detected may increase.
We’ve also seen the number of vendors detecting in-the-wild 0-days in their own products increasing. Whether or not these vendors were previously working on detection, vendors seem to have found ways to be more successful in 2021. Vendors likely have the most telemetry and overall knowledge and visibility into their products so it’s important that they are investing in (and hopefully having success in) detecting 0-days targeting their own products. As shown in the chart above, there was a significant increase in the number of in-the-wild 0-days discovered by vendors in their own products. Google discovered 7 of the in-the-wild 0-days in their own products and Microsoft discovered 10 in their products!
More disclosure
The second reason why the number of detected in-the-wild 0-days has increased is due to more disclosure of these vulnerabilities. Apple and Google Android (we differentiate “Google Android” rather than just “Google” because Google Chrome has been annotating their security bulletins for the last few years) first began labeling vulnerabilities in their security advisories with the information about potential in-the-wild exploitation in November 2020 and January 2021 respectively. When vendors don’t annotate their release notes, the only way we know that a 0-day was exploited in-the-wild is if the researcher who discovered the exploitation comes forward. If Apple and Google Android had not begun annotating their release notes, the public would likely not know about at least 7 of the Apple in-the-wild 0-days and 5 of the Android in-the-wild 0-days. Why? Because these vulnerabilities were reported by “Anonymous” reporters. If the reporters didn’t want credit for the vulnerability, it’s unlikely that they would have gone public to say that there were indications of exploitation. That is 12 0-days that wouldn’t have been included in this year’s list if Apple and Google Android had not begun transparently annotating their security advisories.
Kudos and thank you to Microsoft, Google Chrome, and Adobe who have been annotating their security bulletins for transparency for multiple years now! And thanks to Apache who also annotated their release notes for CVE-2021-41773 this past year.
In-the-wild 0-days in Qualcomm and ARM products were annotated as in-the-wild in Android security bulletins, but not in the vendor’s own security advisories.
It’s highly likely that in 2021, there were other 0-days that were exploited in the wild and detected, but vendors did not mention this in their release notes. In 2022, we hope that more vendors start noting when they patch vulnerabilities that have been exploited in-the-wild. Until we’re confident that all vendors are transparently disclosing in-the-wild status, there’s a big question of how many in-the-wild 0-days are discovered, but not labeled publicly by vendors.
New Year, Old Techniques
We had a record number of “data points” in 2021 to understand how attackers are actually using 0-day exploits. A bit surprising to us though, out of all those data points, there was nothing new amongst all this data. 0-day exploits are considered one of the most advanced attack methods an actor can use, so it would be easy to conclude that attackers must be using special tricks and attack surfaces. But instead, the 0-days we saw in 2021 generally followed the same bug patterns, attack surfaces, and exploit “shapes” previously seen in public research. Once “0-day is hard”, we’d expect that to be successful, attackers would have to find new bug classes of vulnerabilities in new attack surfaces using never before seen exploitation methods. In general, that wasn’t what the data showed us this year. With two exceptions (described below in the iOS section) out of the 58, everything we saw was pretty “meh” or standard.
Out of the 58 in-the-wild 0-days for the year, 39, or 67% were memory corruption vulnerabilities. Memory corruption vulnerabilities have been the standard for attacking software for the last few decades and it’s still how attackers are having success. Out of these memory corruption vulnerabilities, the majority also stuck with very popular and well-known bug classes:
17 use-after-free
6 out-of-bounds read & write
4 buffer overflow
4 integer overflow
In the next sections we’ll dive into each major platform that we saw in-the-wild 0-days for this year. We’ll share the trends and explain why what we saw was pretty unexceptional.
Chromium (Chrome)
Chromium had a record high number of 0-days detected and disclosed in 2021 with 14. Out of these 14, 10 were renderer remote code execution bugs, 2 were sandbox escapes, 1 was an infoleak, and 1 was used to open a webpage in Android apps other than Google Chrome.
The 14 0-day vulnerabilities were in the following components:
When we look at the components targeted by these bugs, they’re all attack surfaces seen before in public security research and previous exploits. If anything, there are a few less DOM bugs and more targeting these other components of browsers like IndexedDB and WebGL than previously. 13 out of the 14 Chromium 0-days were memory corruption bugs. Similar to last year, most of those memory corruption bugs are use-after-free vulnerabilities.
A couple of the Chromium bugs were even similar to previous in-the-wild 0-days. CVE-2021-21166 is an issue in ScriptProcessorNode::Process() in webaudio where there’s insufficient locks such that buffers are accessible in both the main thread and the audio rendering thread at the same time. CVE-2019-13720 is an in-the-wild 0-day from 2019. It was a vulnerability in ConvolverHandler::Process() in webaudio where there were also insufficient locks such that a buffer was accessible in both the main thread and the audio rendering thread at the same time.
CVE-2021-30632 is another Chromium in-the-wild 0-day from 2021. It’s a type confusion in the TurboFan JIT in Chromium’s JavaScript Engine, v8, where Turbofan fails to deoptimize code after a property map is changed. CVE-2021-30632 in particular deals with code that stores global properties. CVE-2020-16009 was also an in-the-wild 0-day that was due to Turbofan failing to deoptimize code after map deprecation.
WebKit (Safari)
Prior to 2021, Apple had only acknowledged 1 publicly known in-the-wild 0-day targeting WebKit/Safari, and that was due the sharing by an external researcher. In 2021 there were 7. This makes it hard for us to assess trends or changes since we don’t have historical samples to go off of. Instead, we’ll look at 2021’s WebKit bugs in the context of other Safari bugs not known to be in-the-wild and other browser in-the-wild 0-days.
The 7 in-the-wild 0-days targeted the following components:
The one semi-surprise is that no DOM bugs were detected and disclosed. In previous years, vulnerabilities in the DOM engine have generally made up 15-20% of the in-the-wild browser 0-days, but none were detected and disclosed for WebKit in 2021.
It would not be surprising if attackers are beginning to shift to other modules, like third party libraries or things like IndexedDB. The modules may be more promising to attackers going forward because there’s a better chance that the vulnerability may exist in multiple browsers or platforms. For example, the webaudio bug in Chromium, CVE-2021-21166, also existed in WebKit and was fixed as CVE-2021-1844, though there was no evidence it was exploited in-the-wild in WebKit. The IndexedDB in-the-wild 0-day that was used against Safari in 2021, CVE-2021-30858, was very, very similar to a bug fixed in Chromium in January 2020.
Internet Explorer
Since we began tracking in-the-wild 0-days, Internet Explorer has had a pretty consistent number of 0-days each year. 2021 actually tied 2016 for the most in-the-wild Internet Explorer 0-days we’ve ever tracked even though Internet Explorer’s market share of web browser users continues to decrease.
So why are we seeing so little change in the number of in-the-wild 0-days despite the change in market share? Internet Explorer is still a ripe attack surface for initial entry into Windows machines, even if the user doesn’t use Internet Explorer as their Internet browser. While the number of 0-days stayed pretty consistent to what we’ve seen in previous years, the components targeted and the delivery methods of the exploits changed. 3 of the 4 0-days seen in 2021 targeted the MSHTML browser engine and were delivered via methods other than the web. Instead they were delivered to targets via Office documents or other file formats.
The four 0-days targeted the following components:
For CVE-2021-26411 targets of the campaign initially received a .mht file, which prompted the user to open in Internet Explorer. Once it was opened in Internet Explorer, the exploit was downloaded and run. CVE-2021-33742 and CVE-2021-40444 were delivered to targets via malicious Office documents.
CVE-2021-26411 and CVE-2021-33742 were two common memory corruption bug patterns: a use-after-free due to a user controlled callback in between two actions using an object and the user frees the object during that callback and a buffer overflow.
There were a few different vulnerabilities used in the exploit chain that used CVE-2021-40444, but the one within MSHTML was that as soon as the Office document was opened the payload would run: a CAB file was downloaded, decompressed, and then a function from within a DLL in that CAB was executed. Unlike the previous two MSHTML bugs, this was a logic error in URL parsing rather than a memory corruption bug.
Windows
Windows is the platform where we’ve seen the most change in components targeted compared with previous years. However, this shift has generally been in progress for a few years and predicted with the end-of-life of Windows 7 in 2020 and thus why it’s still not especially novel.
In 2021 there were 10 Windows in-the-wild 0-days targeting 7 different components:
The number of different components targeted is the shift from past years. For example, in 2019 75% of Windows 0-days targeted Win32k while in 2021 Win32k only made up 20% of the Windows 0-days. The reason that this was expected and predicted was that 6 out of 8 of those 0-days that targeted Win32k in 2019 did not target the latest release of Windows 10 at that time; they were targeting older versions. With Windows 10 Microsoft began dedicating more and more resources to locking down the attack surface of Win32k so as those older versions have hit end-of-life, Win32k is a less and less attractive attack surface.
Similar to the many Win32k vulnerabilities seen over the years, the two 2021 Win32k in-the-wild 0-days are due to custom user callbacks. The user calls functions that change the state of an object during the callback and Win32k does not correctly handle those changes. CVE-2021-1732 is a type confusion vulnerability due to a user callback in xxxClientAllocWindowClassExtraBytes which leads to out-of-bounds read and write. If NtUserConsoleControl is called during the callback a flag is set in the window structure to signal that a field is an offset into the kernel heap. xxxClientAllocWindowClassExtraBytes doesn’t check this and writes that field as a user-mode pointer without clearing the flag. The first in-the-wild 0-day detected and disclosed in 2022, CVE-2022-21882, is due to CVE-2021-1732 actually not being fixed completely. The attackers found a way to bypass the original patch and still trigger the vulnerability. CVE-2021-40449 is a use-after-free in NtGdiResetDC due to the object being freed during the user callback.
iOS/macOS
As discussed in the “More disclosure” section above, 2021 was the first full year that Apple annotated their release notes with in-the-wild status of vulnerabilities. 5 iOS in-the-wild 0-days were detected and disclosed this year. The first publicly known macOS in-the-wild 0-day (CVE-2021-30869) was also found. In this section we’re going to discuss iOS and macOS together because: 1) the two operating systems include similar components and 2) the sample size for macOS is very small (just this one vulnerability).
For the 5 total iOS and macOS in-the-wild 0-days, they targeted 3 different attack surfaces:
These 4 attack surfaces are not novel. IOMobileFrameBuffer has been a target of public security research for many years. For example, the Pangu Jailbreak from 2016 used CVE-2016-4654, a heap buffer overflow in IOMobileFrameBuffer. IOMobileFrameBuffer manages the screen’s frame buffer. For iPhone 11 (A13) and below, IOMobileFrameBuffer was a kernel driver. Beginning with A14, it runs on a coprocessor, the DCP. It’s a popular attack surface because historically it’s been accessible from sandboxed apps. In 2021 there were two in-the-wild 0-days in IOMobileFrameBuffer. CVE-2021-30807 is an out-of-bounds read and CVE-2021-30883 is an integer overflow, both common memory corruption vulnerabilities. In 2022, we already have another in-the-wild 0-day in IOMobileFrameBuffer, CVE-2022-22587.
One iOS 0-day and the macOS 0-day both exploited vulnerabilities in the XNU kernel and both vulnerabilities were in code related to XNU’s inter-process communication (IPC) functionality. CVE-2021-1782 exploited a vulnerability in mach vouchers while CVE-2021-30869 exploited a vulnerability in mach messages. This is not the first time we’ve seen iOS in-the-wild 0-days, much less public security research, targeting mach vouchers and mach messages. CVE-2019-6625 was exploited as a part of an exploit chain targeting iOS 11.4.1-12.1.2 and was also a vulnerability in mach vouchers.
Mach messages have also been a popular target for public security research. In 2020 there were two in-the-wild 0-days also in mach messages: CVE-2020-27932 & CVE-2020-27950. This year’s CVE-2021-30869 is a pretty close variant to 2020’s CVE-2020-27932. Tielei Wang and Xinru Chi actually presented on this vulnerability at zer0con 2021 in April 2021. In their presentation, they explained that they found it while doing variant analysis on CVE-2020-27932. TieLei Wang explained via Twitter that they had found the vulnerability in December 2020 and had noticed it was fixed in beta versions of iOS 14.4 and macOS 11.2 which is why they presented it at Zer0Con. The in-the-wild exploit only targeted macOS 10, but used the same exploitation technique as the one presented.
The two FORCEDENTRY exploits (CVE-2021-30860 and the sandbox escape) were the only times that made us all go “wow!” this year. For CVE-2021-30860, the integer overflow in CoreGraphics, it was because:
For years we’ve all heard about how attackers are using 0-click iMessage bugs and finally we have a public example, and
The exploit was an impressive work of art.
The sandbox escape (CVE requested, not yet assigned) was impressive because it’s one of the few times we’ve seen a sandbox escape in-the-wild that uses only logic bugs, rather than the standard memory corruption bugs.
For CVE-2021-30860, the vulnerability itself wasn’t especially notable: a classic integer overflow within the JBIG2 parser of the CoreGraphics PDF decoder. The exploit, though, was described by Samuel Groß & Ian Beer as “one of the most technically sophisticated exploits [they]’ve ever seen”. Their blogpost shares all the details, but the highlight is that the exploit uses the logical operators available in JBIG2 to build NAND gates which are used to build its own computer architecture. The exploit then writes the rest of its exploit using that new custom architecture. From their blogpost:
Using over 70,000 segment commands defining logical bit operations, they define a small computer architecture with features such as registers and a full 64-bit adder and comparator which they use to search memory and perform arithmetic operations. It’s not as fast as Javascript, but it’s fundamentally computationally equivalent.
The bootstrapping operations for the sandbox escape exploit are written to run on this logic circuit and the whole thing runs in this weird, emulated environment created out of a single decompression pass through a JBIG2 stream. It’s pretty incredible, and at the same time, pretty terrifying.
This is an example of what making 0-day exploitation hard could look like: attackers having to develop a new and novel way to exploit a bug and that method requires lots of expertise and/or time to develop. This year, the two FORCEDENTRY exploits were the only 0-days out of the 58 that really impressed us. Hopefully in the future, the bar has been raised such that this will be required for any successful exploitation.
Android
There were 7 Android in-the-wild 0-days detected and disclosed this year. Prior to 2021 there had only been 1 and it was in 2019: CVE-2019-2215. Like WebKit, this lack of data makes it hard for us to assess trends and changes. Instead, we’ll compare it to public security research.
For the 7 Android 0-days they targeted the following components:
5 of the 7 0-days from 2021 targeted GPU drivers. This is actually not that surprising when we consider the evolution of the Android ecosystem as well as recent public security research into Android. The Android ecosystem is quite fragmented: many different kernel versions, different manufacturer customizations, etc. If an attacker wants a capability against “Android devices”, they generally need to maintain many different exploits to have a decent percentage of the Android ecosystem covered. However, if the attacker chooses to target the GPU kernel driver instead of another component, they will only need to have two exploits since most Android devices use 1 of 2 GPUs: either the Qualcomm Adreno GPU or the ARM Mali GPU.
Public security research mirrored this choice in the last couple of years as well. When developing full exploit chains (for defensive purposes) to target Android devices, Guang Gong, Man Yue Mo, and Ben Hawkes all chose to attack the GPU kernel driver for local privilege escalation. Seeing the in-the-wild 0-days also target the GPU was more of a confirmation rather than a revelation. Of the 5 0-days targeting GPU drivers, 3 were in the Qualcomm Adreno driver and 2 in the ARM Mali driver.
The two non-GPU driver 0-days (CVE-2021-0920 and CVE-2021-1048) targeted the upstream Linux kernel. Unfortunately, these 2 bugs shared a singular characteristic with the Android in-the-wild 0-day seen in 2019: all 3 were previously known upstream before their exploitation in Android. While the sample size is small, it’s still quite striking to see that 100% of the known in-the-wild Android 0-days that target the kernel are bugs that actually were known about before their exploitation.
CVE-2021-1048 remained unpatched in Android for 14 months after it was patched in the Linux kernel. The Linux kernel was actually only vulnerable to the issue for a few weeks, but due to Android patching practices, that few weeks became almost a year for some Android devices. If an Android OEM synced to the upstream kernel, then they likely were patched against the vulnerability at some point. But many devices, such as recent Samsung devices, had not and thus were left vulnerable.
Microsoft Exchange Server
In 2021, there were 5 in-the-wild 0-days targeting Microsoft Exchange Server. This is the first time any Exchange Server in-the-wild 0-days have been detected and disclosed since we began tracking in-the-wild 0-days. The first four (CVE-2021-26855, CVE-2021-26857, CVE-2021-26858, and CVE-2021-27065) were all disclosed and patched at the same time and used together in a single operation. The fifth (CVE-2021-42321) was patched on its own in November 2021. CVE-2021-42321 was demonstrated at Tianfu Cup and then discovered in-the-wild by Microsoft. While no other in-the-wild 0-days were disclosed as part of the chain with CVE-2021-42321, the attackers would have required at least another 0-day for successful exploitation since CVE-2021-42321 is a post-authentication bug.
Of the four Exchange in-the-wild 0-days used in the first campaign, CVE-2021-26855, which is also known as “ProxyLogon”, is the only one that’s pre-auth. CVE-2021-26855 is a server side request forgery (SSRF) vulnerability that allows unauthenticated attackers to send arbitrary HTTP requests as the Exchange server. The other three vulnerabilities were post-authentication. For example, CVE-2021-26858 and CVE-2021-27065 allowed attackers to write arbitrary files to the system. CVE-2021-26857 is a remote code execution vulnerability due to a deserialization bug in the Unified Messaging service. This allowed attackers to run code as the privileged SYSTEM user.
For the second campaign, CVE-2021-42321, like CVE-2021-26858, is a post-authentication RCE vulnerability due to insecure deserialization. It seems that while attempting to harden Exchange, Microsoft inadvertently introduced another deserialization vulnerability.
While there were a significant amount of 0-days in Exchange detected and disclosed in 2021, it’s important to remember that they were all used as 0-day in only two different campaigns. This is an example of why we don’t suggest using the number of 0-days in a product as a metric to assess the security of a product. Requiring the use of four 0-days for attackers to have success is preferable to an attacker only needing one 0-day to successfully gain access.
While this is the first time Exchange in-the-wild 0-days have been detected and disclosed since Project Zero began our tracking, this is not unexpected. In 2020 there was n-day exploitation of Exchange Servers. Whether this was the first year that attackers began the 0-day exploitation or if this was the first year that defenders began detecting the 0-day exploitation, this is not an unexpected evolution and we’ll likely see it continue into 2022.
Outstanding Questions
While there has been progress on detection and disclosure, that progress has shown just how much work there still is to do. The more data we gained, the more questions that arose about biases in detection, what we’re missing and why, and the need for more transparency from both vendors and researchers.
Until the day that attackers decide to happily share all their exploits with us, we can’t fully know what percentage of 0-days are publicly known about. However when we pull together our expertise as security researchers and anecdotes from others in the industry, it paints a picture of some of the data we’re very likely missing. From that, these are some of the key questions we’re asking ourselves as we move into 2022:
Where are the [x] 0-days?
Despite the number of 0-days found in 2021, there are key targets missing from the 0-days discovered. For example, we know that messaging applications like WhatsApp, Signal, Telegram, etc. are targets of interest to attackers and yet there’s only 1 messaging app, in this case iMessage, 0-day found this past year. Since we began tracking in mid-2014 the total is two: a WhatsApp 0-day in 2019 and this iMessage 0-day found in 2021.
Along with messaging apps, there are other platforms/targets we’d expect to see 0-days targeting, yet there are no or very few public examples. For example, since mid-2014 there’s only one in-the-wild 0-day each for macOS and Linux. There are no known in-the-wild 0-days targeting cloud, CPU vulnerabilities, or other phone components such as the WiFi chip or the baseband.
This leads to the question of whether these 0-days are absent due to lack of detection, lack of disclosure, or both?
Do some vendors have no known in-the-wild 0-days because they’ve never been found or because they don’t publicly disclose?
Unless a vendor has told us that they will publicly disclose exploitation status for all vulnerabilities in their platforms, we, the public, don’t know if the absence of an annotation means that there is no known exploitation of a vulnerability or if there is, but the vendor is just not sharing that information publicly. Thankfully this question is something that has a pretty clear solution: all device and software vendors agreeing to publicly disclose when there is evidence to suggest that a vulnerability in their product is being exploited in-the-wild.
Are we seeing the same bug patterns because that’s what we know how to detect?
As we described earlier in this report, all the 0-days we saw in 2021 had similarities to previously seen vulnerabilities. This leads us to wonder whether or not that’s actually representative of what attackers are using. Are attackers actually having success exclusively using vulnerabilities in bug classes and components that are previously public? Or are we detecting all these 0-days with known bug patterns because that’s what we know how to detect? Public security research would suggest that yes, attackers are still able to have success with using vulnerabilities in known components and bug classes the majority of the time. But we’d still expect to see a few novel and unexpected vulnerabilities in the grouping. We posed this question back in the 2019 year-in-review and it still lingers.
Where are the spl0itz?
To successfully exploit a vulnerability there are two key pieces that make up that exploit: the vulnerability being exploited, and the exploitation method (how that vulnerability is turned into something useful).
Unfortunately, this report could only really analyze one of these components: the vulnerability. Out of the 58 0-days, only 5 have an exploit sample publicly available. Discovered in-the-wild 0-days are the failure case for attackers and a key opportunity for defenders to learn what attackers are doing and make it harder, more time-intensive, more costly, to do it again. Yet without the exploit sample or a detailed technical write-up based upon the sample, we can only focus on fixing the vulnerability rather than also mitigating the exploitation method. This means that attackers are able to continue to use their existing exploit methods rather than having to go back to the design and development phase to build a new exploitation method. While acknowledging that sharing exploit samples can be challenging (we have that challenge too!), we hope in 2022 there will be more sharing of exploit samples or detailed technical write-ups so that we can come together to use every possible piece of information to make it harder for the attackers to exploit more users.
As an aside, if you have an exploit sample that you’re willing to share with us, please reach out. Whether it’s sharing with us and having us write a detailed technical description and analysis or having us share it publicly, we’d be happy to work with you.
Conclusion
Looking back on 2021, what comes to mind is “baby steps”. We can see clear industry improvement in the detection and disclosure of 0-day exploits. But the better detection and disclosure has highlighted other opportunities for progress. As an industry we’re not making 0-day hard. Attackers are having success using vulnerabilities similar to what we’ve seen previously and in components that have previously been discussed as attack surfaces.The goal is to force attackers to start from scratch each time we detect one of their exploits: they’re forced to discover a whole new vulnerability, they have to invest the time in learning and analyzing a new attack surface, they must develop a brand new exploitation method. And while we made distinct progress in detection and disclosure it has shown us areas where that can continue to improve.
While this all may seem daunting, the promising part is that we’ve done it before: we have made clear progress on previously daunting goals. In 2019, we discussed the large detection deficit for 0-day exploits and 2 years later more than double were detected and disclosed. So while there is still plenty more work to do, it’s a tractable problem. There are concrete steps that the tech and security industries can take to make it even more progress:
Make it an industry standard behavior for all vendors to publicly disclose when there is evidence to suggest that a vulnerability in their product is being exploited,
Vendors and security researchers sharing exploit samples or detailed descriptions of the exploit techniques.
Continued concerted efforts on reducing memory corruption vulnerabilities or rendering them unexploitable.
Through 2021 we continually saw the real world impacts of the use of 0-day exploits against users and entities. Amnesty International, the Citizen Lab, and others highlighted over and over how governments were using commercial surveillance products against journalists, human rights defenders, and government officials. We saw many enterprises scrambling to remediate and protect themselves from the Exchange Server 0-days. And we even learned of peer security researchers being targeted by North Korean government hackers. While the majority of people on the planet do not need to worry about their own personal risk of being targeted with 0-days, 0-day exploitation still affects us all. These 0-days tend to have an outsized impact on society so we need to continue doing whatever we can to make it harder for attackers to be successful in these attacks.
2021 showed us we’re on the right track and making progress, but there’s plenty more to be done to make 0-day hard.
A new phishing campaign has been targeting U.S. organizations in the military, security software, manufacturing supply chain, healthcare and pharmaceutical sectors to steal Microsoft Office 365 and Outlook credentials.
The operation is ongoing and the threat actor behind it uses fake voicemail notifications to lure victims into opening a malicious HTML attachment.
Campaign overview
According to researchers at cloud security company ZScaler, the recently discovered campaign shares tactics, techniques, and procedures (TTPs) with another operation analyzed in mid-2020.
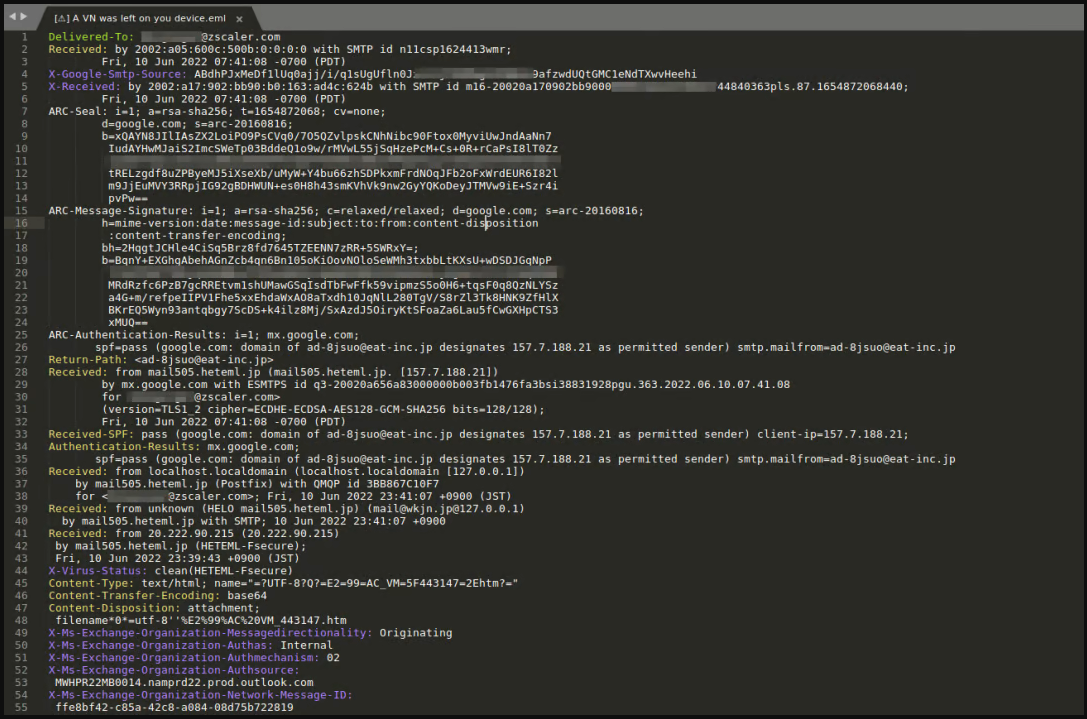
The threat actors leverage email services in Japan to route their messages and spoof the sender’s address, making it look like the emails come from an address belonging to the targeted organization.
Email headers(Zscaler)
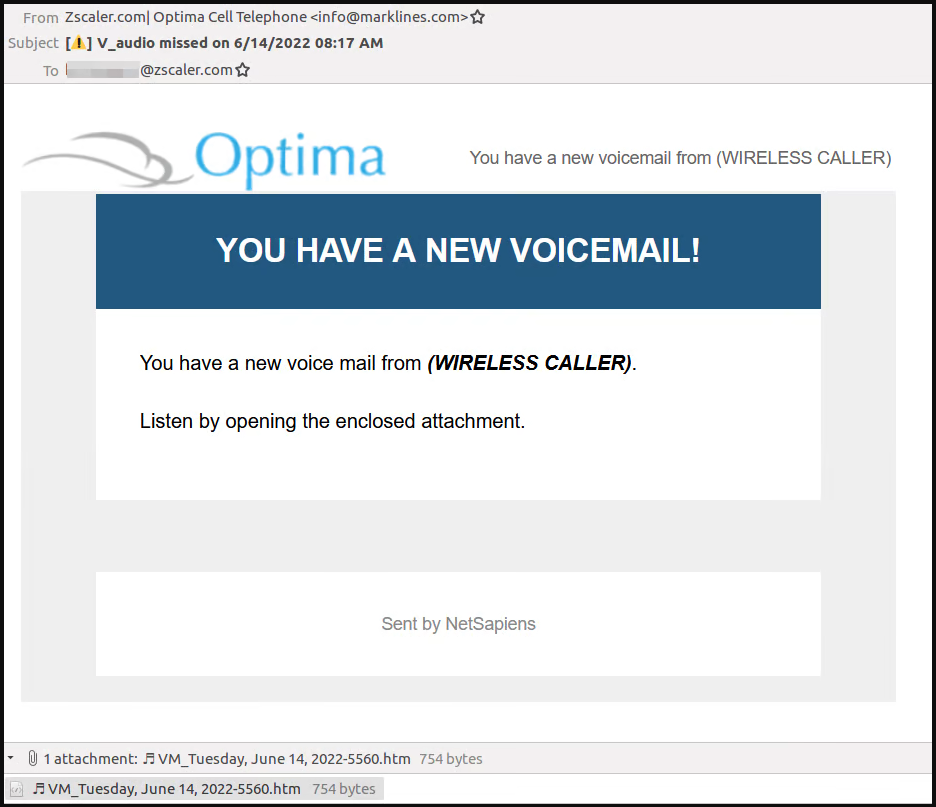
The email has an HTML attachment that uses a music note character in the naming to make it appear as if the file is a sound clip. In reality, the file contains obfuscated JavaScript code that takes the victim to a phishing site.
Message used in the phishing campaign(Zscaler)
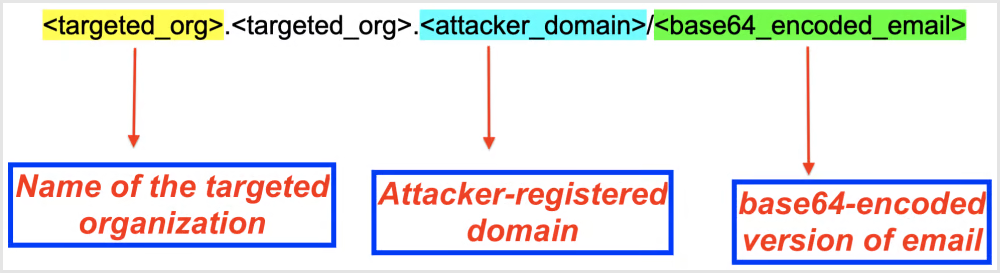
The URL format follows an assembly system that considers the targeted organization’s domain to make it appear as if the site is a legitimate subdomain.
Phishing domain naming scheme(Zscaler)
The redirection process first takes the victim to a CAPTCHA check, which is designed to evade anti-phishing tools and increases the illusion of legitimacy for the victims.
Typical CAPTCHA step on phishing site(Zscaler)
The CAPTCHA check was also used in a 2020 campaign that ZScaler’s ThreatLabZ researchers analyzed and it continues to be an effective middle step that helps increase the phishing success rate.
Once the users pass this step, they are redirected to a genuine-looking phishing page that steals Microsoft Office 365 accounts.
The final destination of the redirections is a phishing page(Zscaler)
Those careful enough would notice that the domain of the login page doesn’t belong to Microsoft or their organization and is one of the following:
briccorp[.]com
bajafulfillrnent[.]com
bpirninerals[.]com
lovitafood-tw[.]com
dorrngroup[.]com
lacotechs[.]com
brenthavenhg[.]com
spasfetech[.]com
mordematx[.]com
antarnex[.]com
This is why before submitting, or even before starting to type their username and password, users should always check and confirm they are on a real login portal and not a fake one.
Typically, recipients are logged into the account, which should make suspicious a request to log in once more to listen to the voicemail.
Voicemail-themed phishing using HTML attachments has been used since at least 2019, but it is still effective, especially with careless employees.
Cybersecurity researchers have disclosed details about 15 security flaws in Siemens SINEC network management system (NMS), some of which could be chained by an attacker to achieve remote code execution on affected systems.
“The vulnerabilities, if exploited, pose a number of risks to Siemens devices on the network including denial-of-service attacks, credential leaks, and remote code execution in certain circumstances,” industrial security company Claroty said in a new report.
The shortcomings in question — tracked from CVE-2021-33722 through CVE-2021-33736 — were addressed by Siemens in version V1.0 SP2 Update 1 as part of patches shipped on October 12, 2021.
“The most severe could allow an authenticated remote attacker to execute arbitrary code on the system, with system privileges, under certain conditions,” Siemens noted in an advisory at the time.
Chief among the weaknesses is CVE-2021-33723 (CVSS score: 8.8), which allows for privilege escalation to an administrator account and could be combined with CVE-2021-33722 (CVSS score: 7.2), a path traversal flaw, to execute arbitrary code remotely.
Another notable flaw relates to a case of SQL injection (CVE-2021-33729, CVSS score: 8.8) that could be exploited by an authenticated attacker to execute arbitrary commands in the local database.
“SINEC is in a powerful central position within the network topology because it requires access to the credentials, cryptographic keys, and other secrets granting it administrator access in order to manage devices in the network,” Claroty’s Noam Moshe said.
“From an attacker’s perspective carrying out a living-off-the-land type of attack where legitimate credentials and network tools are abused to carry out malicious activity, access to, and control of, SINEC puts an attacker in prime position for: reconnaissance, lateral movement, and privilege escalation.”
A security flaw in Apple Safari that was exploited in the wild earlier this year was originally fixed in 2013 and reintroduced in December 2016, according to a new report from Google Project Zero.
The issue, tracked as CVE-2022-22620 (CVSS score: 8.8), concerns a case of a use-after-free vulnerability in the WebKit component that could be exploited by a piece of specially crafted web content to gain arbitrary code execution.
In early February 2022, Apple shipped patches for the bug across Safari, iOS, iPadOS, and macOS, while acknowledging that it “may have been actively exploited.”
“In this case, the variant was completely patched when the vulnerability was initially reported in 2013,” Maddie Stone of Google Project Zero said. “However, the variant was reintroduced three years later during large refactoring efforts. The vulnerability then continued to exist for 5 years until it was fixed as an in-the-wild zero-day in January 2022.”
While both the 2013 and 2022 bugs in the History API are essentially the same, the paths to trigger the vulnerability are different. Then subsequent code changes undertaken years later revived the zero-day flaw from the dead like a “zombie.”
Stating the incident is not unique to Safari, Stone further stressed taking adequate time to audit code and patches to avoid instances of duplicating the fixes and understanding the security impacts of the changes being carried out.
“Both the October 2016 and the December 2016 commits were very large. The commit in October changed 40 files with 900 additions and 1225 deletions. The commit in December changed 95 files with 1336 additions and 1325 deletions,” Stone noted.
“It seems untenable for any developers or reviewers to understand the security implications of each change in those commits in detail, especially since they’re related to lifetime semantics.”
The Asia-Africa-Europe-1 (AAE-1) suffered a cable cut on Tuesday 7 June causing outages and network issues around the world.
The issue with the 25,000km submarine cable occurred on land in Egypt, meaning that a fix was much faster than if it had broken at the bottom of the ocean. Most services were restored after four hours, but latency issues persisted for some providers.
The telecoms consortium-owned AAE-1 starts in Hong Kong, traveling west via Vietnam, Malaysia, Thailand, Cambodia, Myanmar, India, Pakistan, Oman, UAE, Qatar, Yemen, Djibouti, Saudi Arabia, Egypt, Greece, and Italy, before terminating in France.
It has 100Gbps transmission technology, with a minimum design capacity of 40Tbps.
Following the cut, Cloudflare Radar, the Internet trends division of Cloudflare, reported traffic dropping in Ethiopia, Somalia, and Tanzania. Network monitoring company Kentik saw issues in East Africa, Middle East and South Asia, including Pakistan, Somalia, Djibouti, and Saudi Arabia.
Curiously, Cloudflare said that it was “also seeing concurrent drops in traffic in Pakistan, Mozambique, Kenya, and Uganda, reportedly due to an issue also impacting the SeaMeWe5 submarine cable.”
The two cables are supposed to be independent.
The cable cut caused issues with Cloudflare’s own system. “Full restoration is expected to be done within 6 hours. We are working to mitigate impact to Internet users in the regions of Asia Pacific, Middle East, and Africa,” it said at the time.
Google Cloud’s said that there was “incident affecting Hybrid Connectivity, Virtual Private Cloud (VPC), Google Cloud Networking, Cloud NAT,” and reports “packet loss observed from Internet in Middle East to Google.”
OVHcloud said that “partner fiber cuts” caused network backbone degradation.
Amazon Web Services and Microsoft Azure appeared to suffer some network degradation, but made no official comment. Around the time of the cut, Microsoft’s LinkedIn service went briefly offline.


 in-the-wild 0-days per year. The bar graph is split into two color: yellow for Anonymously reported 0-days and green for non-anonymous reported 0-days. 2021 is the only year with any anonymously reported 0-days. 2015: 0, 2016: 3, 2018: 2, 2019: 1, 2020: 3, 2021: Non-Anonymous: 8, Anonymous- 12. Data from: https://docs.google.com/spreadsheets/d/1lkNJ0uQwbeC1ZTRrxdtuPLCIl7mlUreoKfSIgajnSyY/edit#gid=2129022708")


.png)

