A list of the best Active Directory tools to help you simplify and automate Microsoft Active Directory management tasks.
The native Windows Administrative Tools are missing many features that administrators need to effectively do their jobs. Things like bulk operations and automation are just not possible with the Active Directory users and computer consoles.
The good news is there are many useful Active Directory Tools to choose from that can help you manage domain users, groups, and computers, generate reports, find security weaknesses, and more.
Check it out:
1. AD Bulk User Import
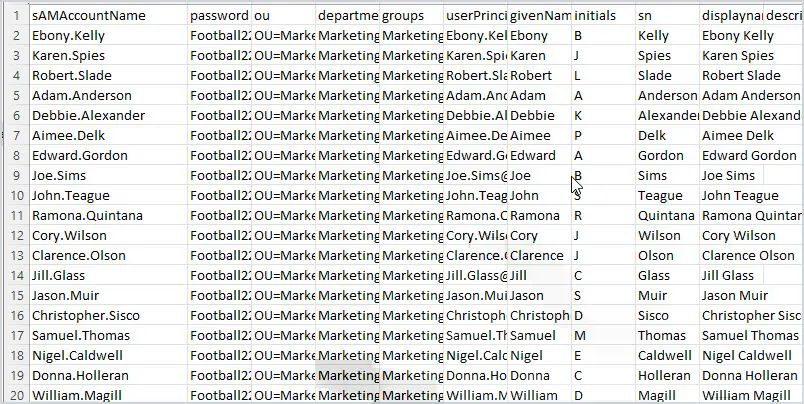
The Bulk Import tool makes it easy to import new user accounts into Active Directory from CSV. Includes a CSV template, sets multiple user attributes, and adds users to groups during the import. Automate the creation of new user accounts and simplify the user account provisioning process.
Key Features
- Easily bulk import new accounts
- Includes a CSV template
- Logs the import process
- Add users to groups during the import process
2. Active Directory Explorer
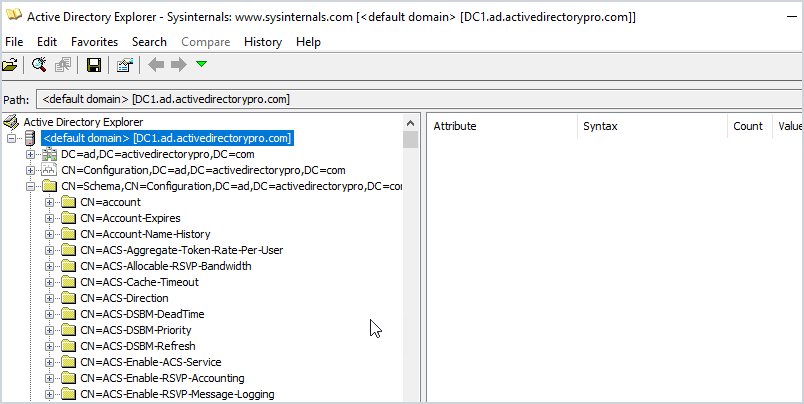
Active Directory Explorer is a browser to navigate the AD database, objects, permissions, and schema objects within Active Directory. The interface is similar to Active Directory users and computers but allows you to view advanced settings. This is not a tool you would use on a daily basis, this would be used for very specific tasks such as viewing an object’s attributes and security sessions.
Another neat feature is the ability to save a snapshot of the AD database. You can then load it for offline viewing and explore it like it was a live database. Again not a common use case.
Key Features
- Easily explore the Active Directory database
- View all object attributes
- View the Active Directory Schema
- Take a snapshot of the Database and view offline
3. Adaxes
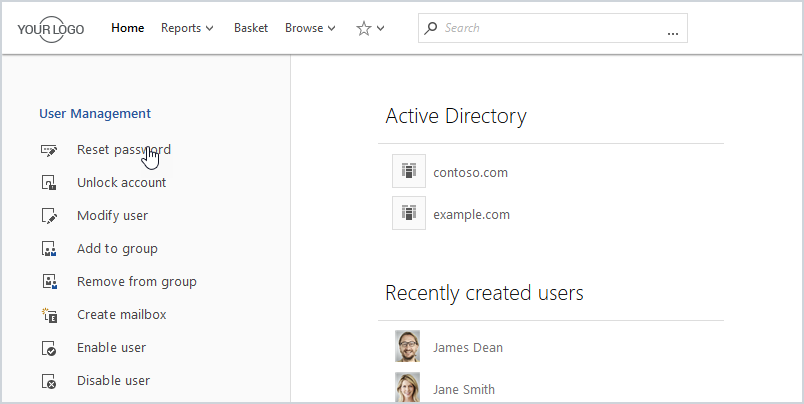
Adaxes is a premium product that automates many AD management tasks, like user provisioning, assigning permissions, creating mailboxes, delegation, and much more. All management tasks are done from a web interface and can be accessed from laptops, tablets, and phones. The web interface is fully customizable so you can view just want you to need. Also includes a user self service portal and a password self service portal.
Key Features
- Roles based access control
- Fully automate AD tasks
- Web interface
4. User Export Tool
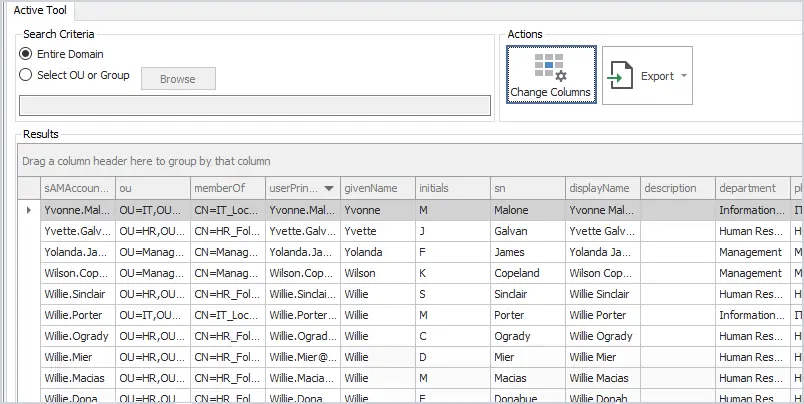
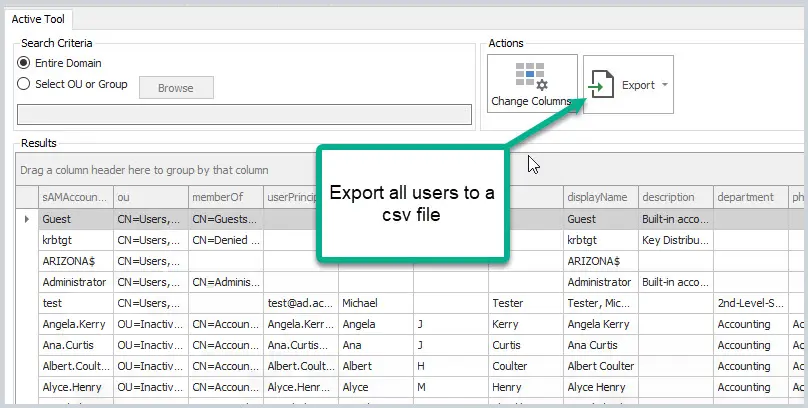
The user export tool lets you export all uses plus all common user fields to a CSV. Over 40 user fields can be added to the export by clicking the change columns button. This is a great tool if you need a report of all users, the groups they are a member of, OU, and more.
Key Features
- Find users TRUE last logon date from all domain controllers
- Export report to a CSV file
- Filter and search columns
- Easy to report on OUs or groups
5. Bulk User Updater
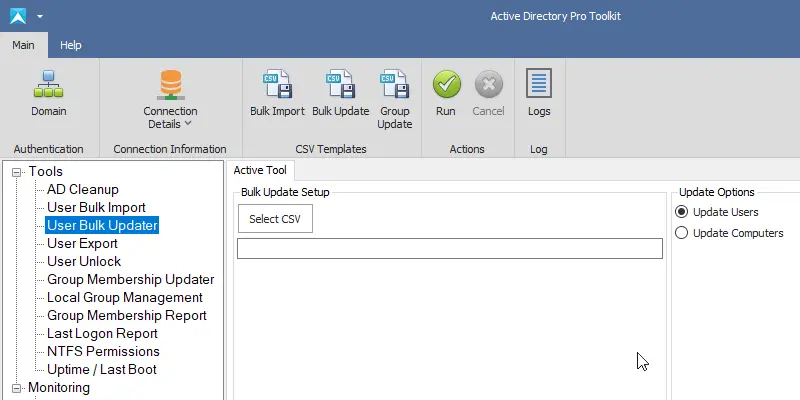
This tool lets you bulk update user account properties from CSV file. Some popular use cases are bulk updating user’s proxyaddresses, employeeid, addresses, manager, addresses, state, country, and so on.
All changes are sent to a log file which lets you keep track of changes and check for errors. This is a very popular tool!
Key Features
- Bulk update user account properties
- Includes CSV template
- Logs changes and errors
- Saves a lot of time
6. AD Cleanup Tool
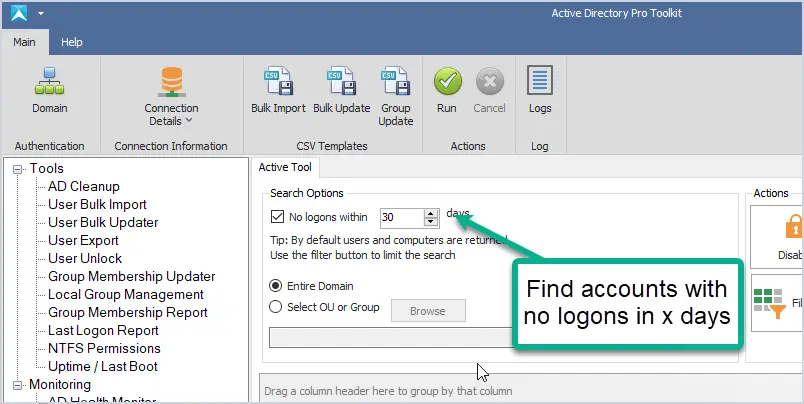
The AD Cleanup tool searches your domain for stale and inactive user accounts based on the account’s lastlogon attribute. You can also find disabled, expired, accounts that have never been used and empty groups.
It is recommended to run a cleanup process on your domain at least once a month, this tool can help simplify that cleanup process and secure your domain.
Key Features
- Quickly find old user and computer accounts
- Limit the scope to OUs and groups
- Bulk move and disable old accounts
- Find all expired user accounts
7. SolarWinds Server & Application Monitor
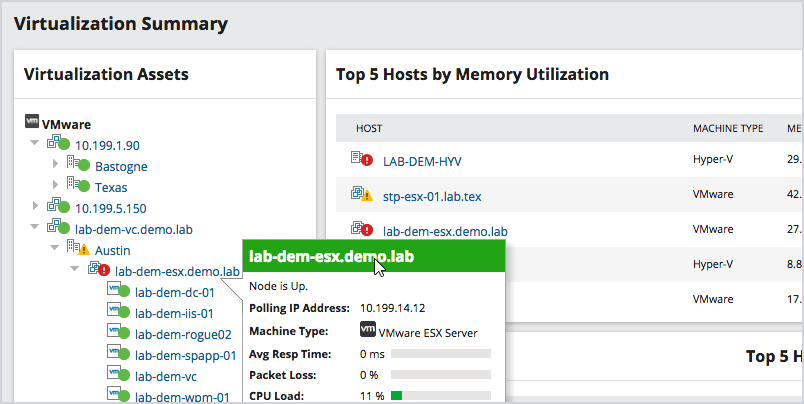
This utility was designed to Monitor Active Directory and other critical services like Azure, DNS, and DHCP. It will quickly spot domain controller issues, replication, performance issues with cloud services, failed logon attempts, and much more.
This is a premium tool that has a big price tag but it’s an incredible product. You can monitor all resources including applications, hardware, processes, and cloud systems. Everything is accessed from a single web console, you can get email alerts based on various thresholds.
Key Features
- Customizable dashboard
- Email alerts
- 1200 out of box templates
- Diagnose AD replication issues
- Monitor account logins
SolarWinds Server Monitor provides a fully functional 30-day free trial.
8. Active Directory Health Monitor
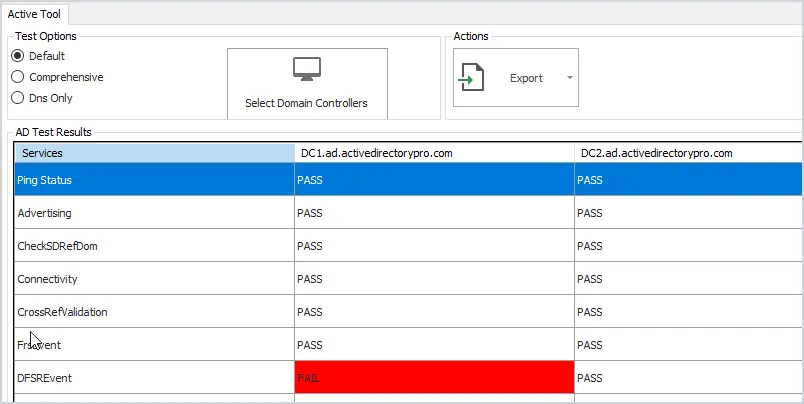
If you want a simple tool to monitor your Active Directory services then this is a great tool.
Check the health of your domain controllers with this easy to use tool. Runs 27 health checks on your servers to check for critical errors. Click on any failed test to quickly see the details.
Also includes an option to test DNS and check event logs for critical events.
Key Features
- Quickly check domain controller health
- Check DNS health
- Very easy to use
- Export report to csv file
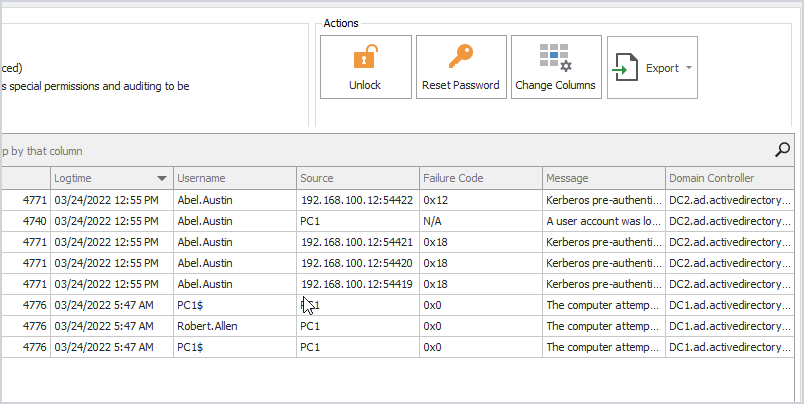
9. User Unlock and Lockout Troubleshooter
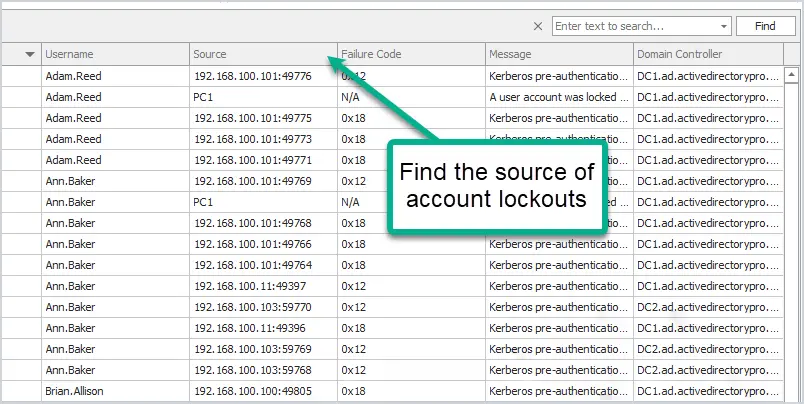
Find all locked users with the click of a button. Unlock, reset passwords or show advanced details like the source of the lockout and more. To pull the source computer you need to have auditing enabled, check the administrator guide for how to enable this.
Key Features
- Find the source of account lockouts
- Fast and easy to use
- Unlock multiple accounts at once
- Reset and unlock accounts from a single interface
10. Bulk Group Membership Updater
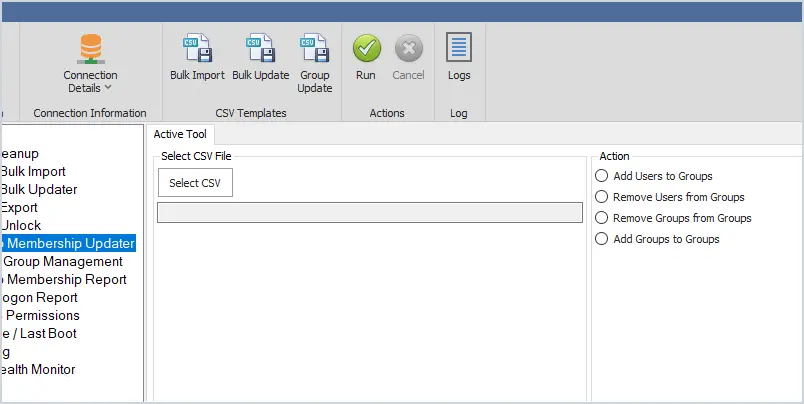
Bulk add or remove users to Active Directory groups. You can bulk add users to a single group or multiple groups all at once. Very easy to use and saves a lot of time. Just add the users to the CSV template and the name of the group or groups you want to add them to.
Key Features
- Easily bulk add users to groups
- Bulk remove users from groups
- Add groups to groups
11. Last Logon Reporter
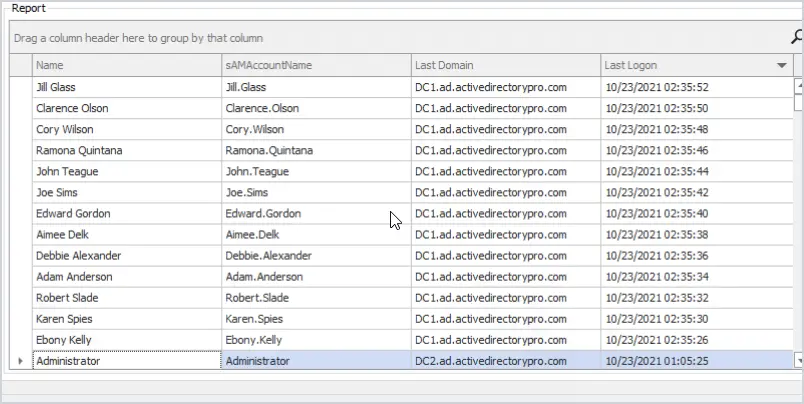
The last logon reporter will get the user’s TRUE last logon time from all domain controllers in your domain. You can limit the search to the entire domain, organizational unit, or groups.
12. AD FastReporter
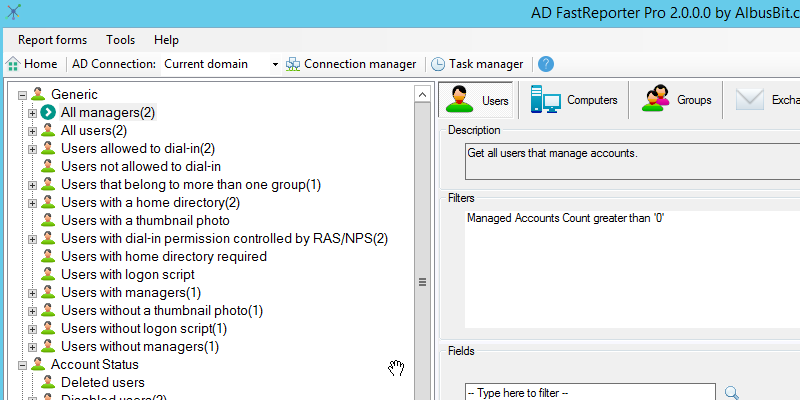
AD FastReporter has a large list of pre-built reports to pick from. Report on users, computers, groups, contacts, printers, group policy objects, and organizational units. Very easy to use but does have an older style interface.
Here is a small example of the reports you can run:
- All users
- Deleted Users
- Users with a home directory
- users without logon script
- All computers
- All domain controllers
- Computers created in the last 30 days
- Users created in the last 30 days
13. Local Group Report
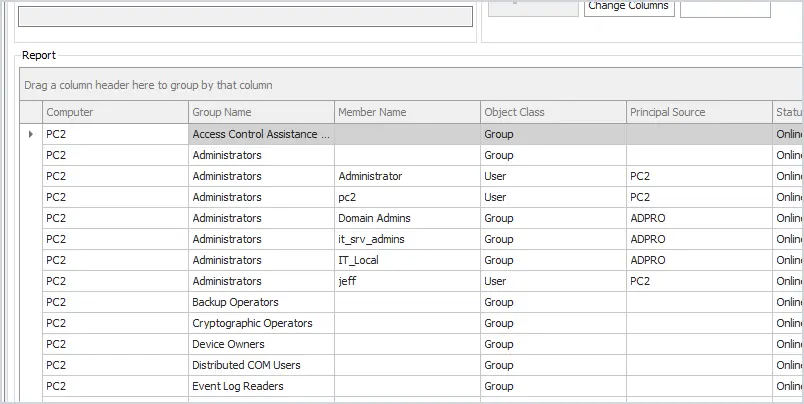
This tool gets the local groups and group members on remote computers. You can quickly sort or filter the groups to get a list of all users and groups that have local administrator rights.
Key Features
- Easily get group membership on remote computers
- Quickly find how as administrator rights
- Filter for any group or member
14. Group Membership Report Tool
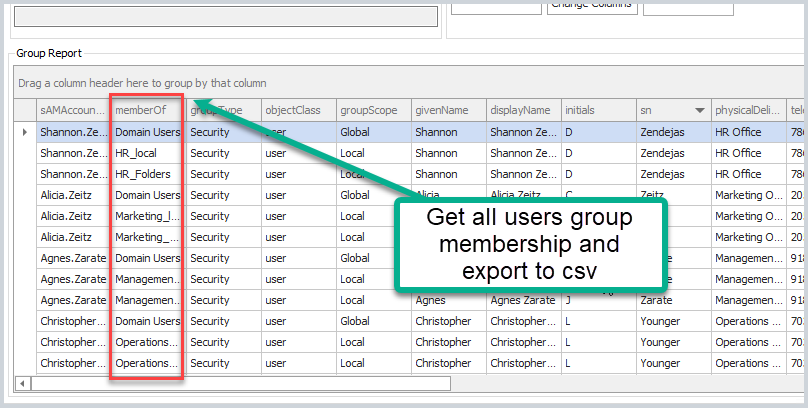
Report and export group membership has never been easier, select from the entire domain, groups, or organizational unit. This tool also helps to find nested security groups.
Key Features
- The fastest way to get all domain gruops and group membership
- Export report to a CSV
- Limit scope to an OU or group
15. Dovestones AD Reporting
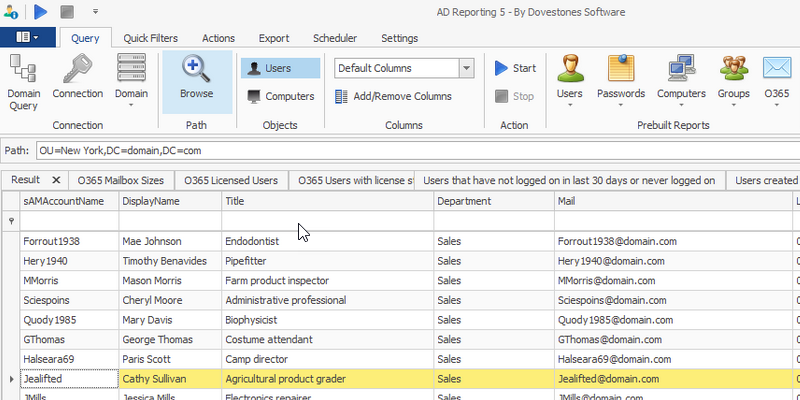
Dovestones AD Reporting tool contains a large number of pre built reports. You can customize the report by selecting user attributes and defining which users to export.
16. Computer Uptime Report
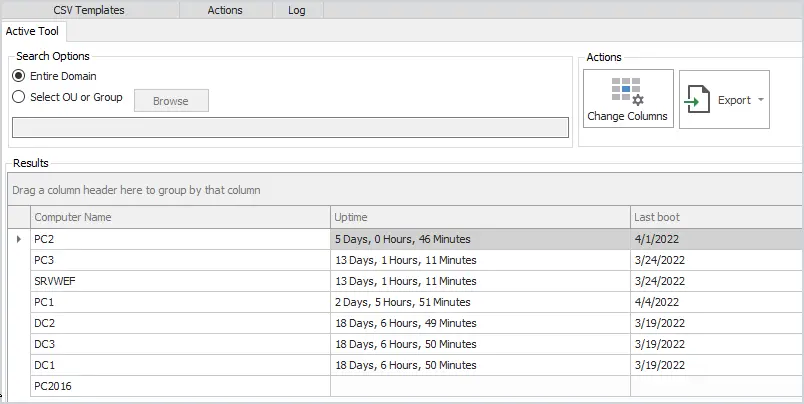
Get the uptime and last boot of remote computers. Report on the entire domain or select from an OU or group.
Very helpful during maintenance days to verify if computers have rebooted.
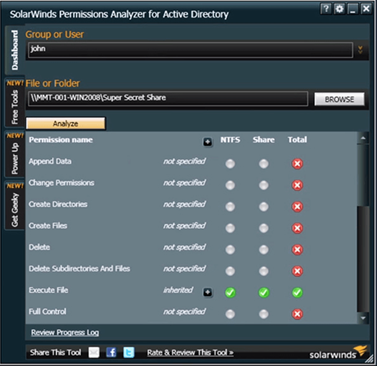
17. SolarWinds Permissions Analyzer
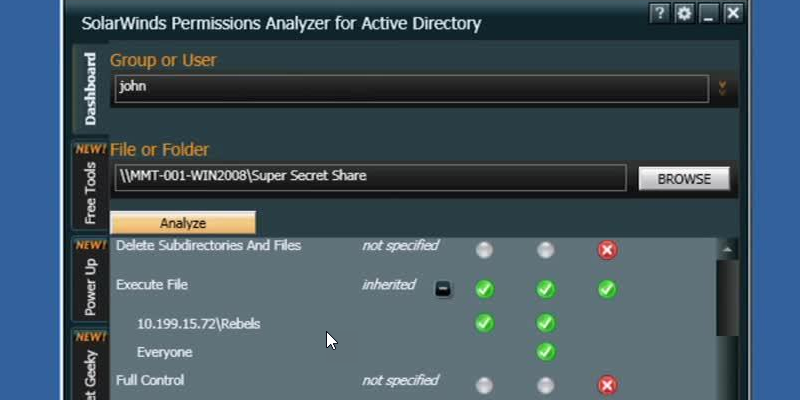
This FREE tool lets you get instant visibility into user and group permissions. Quickly check user or group permissions for files, network, and folder shares.
Analyze user permissions based on an individual user or group membership.
18. NTFS Permissions Reporter
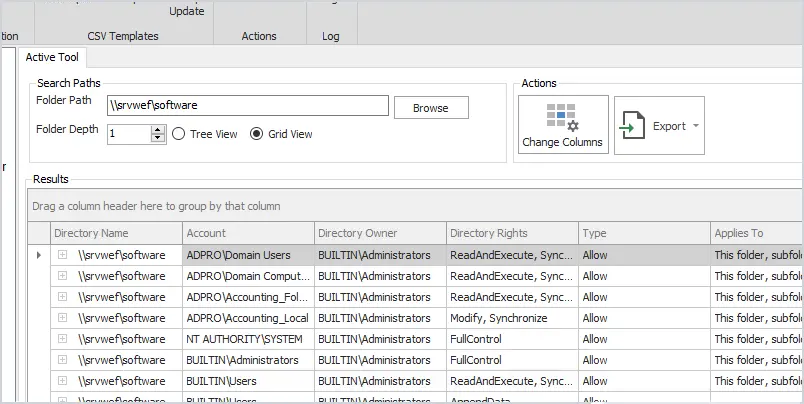
The NTFS permissions tool will report folder security for local, remote, and UNC folder permissions. The grid view comes with a powerful filter so you can search and limit the results to find specific permissions such as Active Directory groups.
19. Windows PowerShell
Windows PowerShell is a very powerful tool that can automate many Active Directory and Windows tasks. The problem is it can be complex to learn some of the advanced functions. With that said there are plenty of cmdlets that can be used in a single line of code to do some pretty cool things in Windows.
- Create new user account: New-Aduser
- Create computer account: New-ADComputer
- Create a security group: New-ADGroup
- Create a organizational unit: New-ADOrganizationalUnit
- Get domain details: Get-ADDomin
- Get domain password policy: Get-ADDefaultDomainPasswordPolicy
- Get group policy: get-GPO -all
- Get all services: get-service
- Find locked user accounts: Search-ADAccount -LockedOut
20. Windows sysinternals
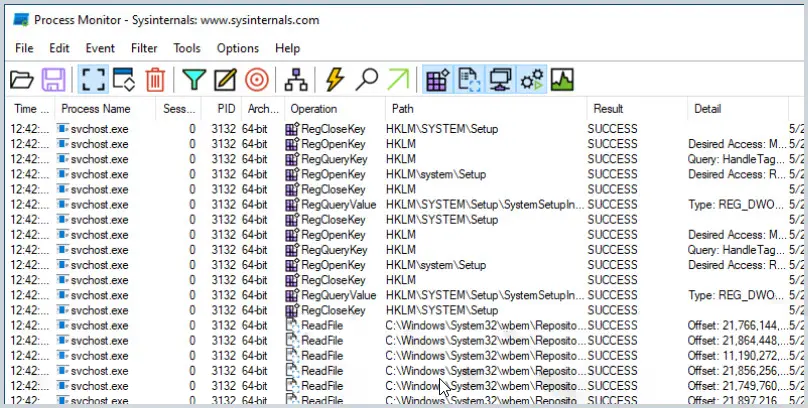
The Sysinternals is a suite of small GUI programs and command line utilities designed to troubleshoot and diagnose your Windows systems and applications. They are all portable, which means you don’t need to install them, you can just run the exe or commands with no installation required.
These utilities were created way back in 1996 by Mark Russinovich and then later acquired by Microsoft. There are a bunch of tools included I will list some of the popular ones.
- Process Monitor – Shows real time file system, registry and process activity.
- PsExec – Lets you execute programs on a remote system
- PsKill – Kill local and remote processes
- Sysmon – Logs system activity about process creations, network connection and changes to files
- Psinfo – Shows info about a local or remote computer
All-in-one Active Directory Toolkit
Our AD Pro Toolkit includes 12 Active Directory tools in a single interface.
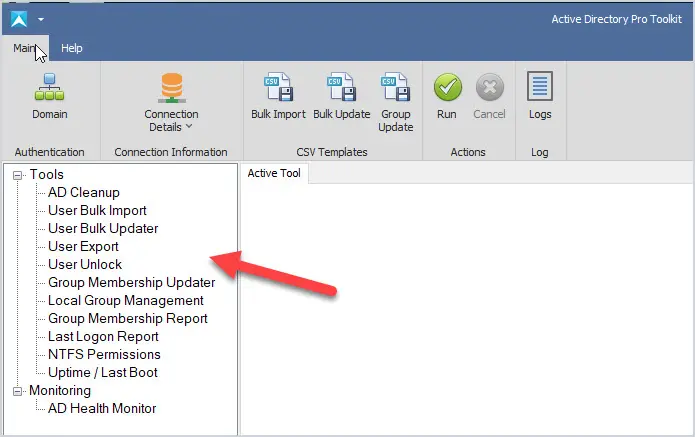
Tools included in the AD Pro Toolkit:
- Bulk User Import
- Bulk User Updater
- AD Cleanup Tool
- Last Logon Reporter
- User Export to CSV
- Unlock and Account Troubleshooter
- Group Reporter
- Group Management Tool
- NTFS Permissions Report
- Local Group Management
- AD Health Monitor
- Uptime last boot
Download a Free trial of the AD Pro Toolkit
What are the benefits of Active Directory Tools?
The main benefit is it will save you time and make managing Active Directory easier. One of the most popular tasks of working with Active Directory is to create new user accounts. The built-in tools provide no options for bulk importing new accounts so it becomes very time-consuming. With the AD Pro Toolkit you can easily bulk import, bulk update, and disable user accounts.
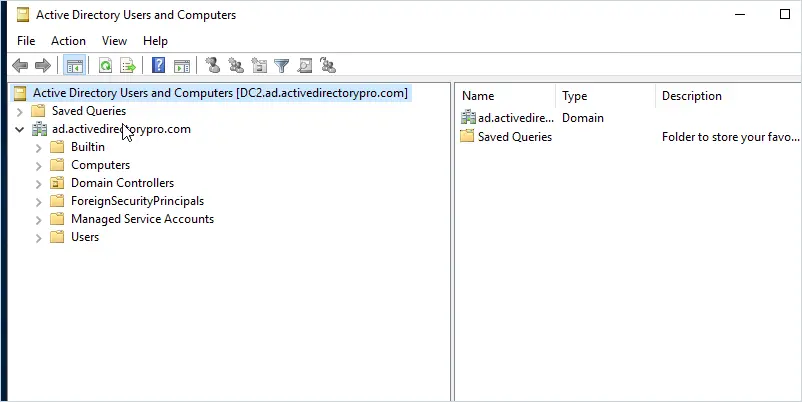
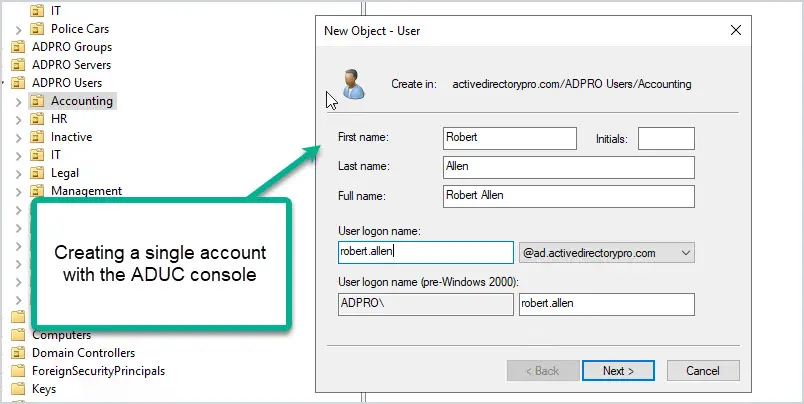
Below is a picture of how you would create an account with the built-in (ADUC) Active Directory Users and Computers console. Everything has to be manually entered and you have to go back and add users to groups.
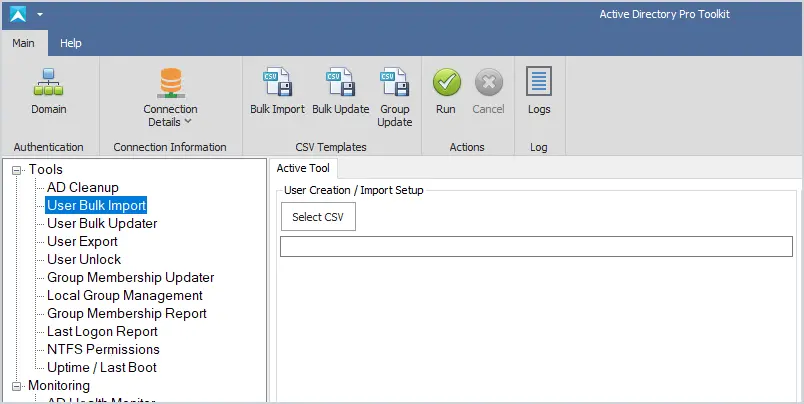
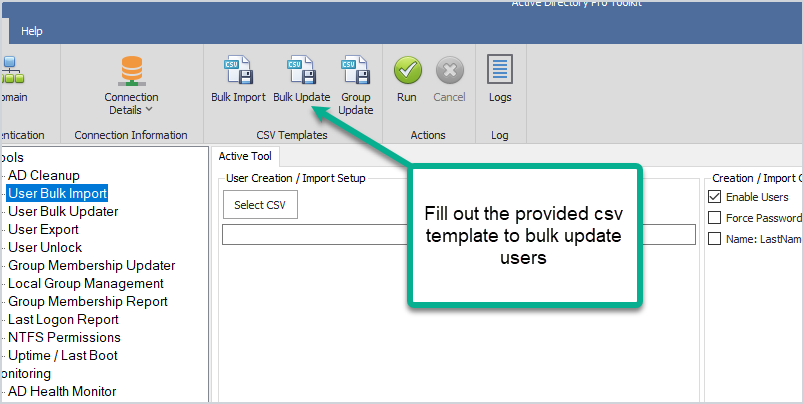
Using Active Directory tools like the AD Bulk Import tool, you can bulk import thousands of accounts at once. Plus you can automatically set user accounts fields and add users to groups. Let me show you how easy it is.
Step 1: Fill out the provided CSV template.
The template includes all the common user fields you need to create a new account. Just fill out what you need and save the file.
Step 2: Import new account
With this tool just select your CSV file and click run. This will import all of the account information from the CSV and automatically bulk create new Active Directory user accounts.
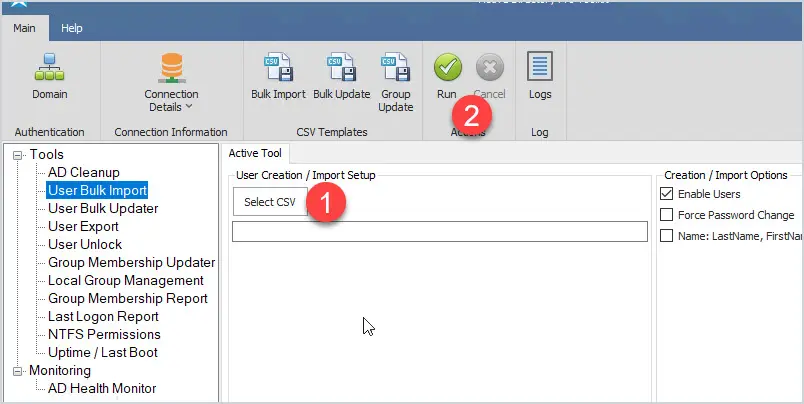
You can watch the import process and when complete you have a log file of the import.
You will at some point be asked to export users to a CSV and again there is no easy built in option for this. When I was an administrator at a large organization I would get this request at least once a week and it was a pain. When I developed the user export tool this process became so easy I was able to have other staff members take it over.
The ease of use is another benefit as many people don’t have time to learn PowerShell. PowerShell is a great tool and can do many things but it can be complex and time-consuming to learn. The AD Pro Toolkit has a very simple interface and you can start using it right away to perform many advanced tasks in your domain.
Frequently Asked Questions
Below are questions and answers regarding the AD Pro Toolkit.
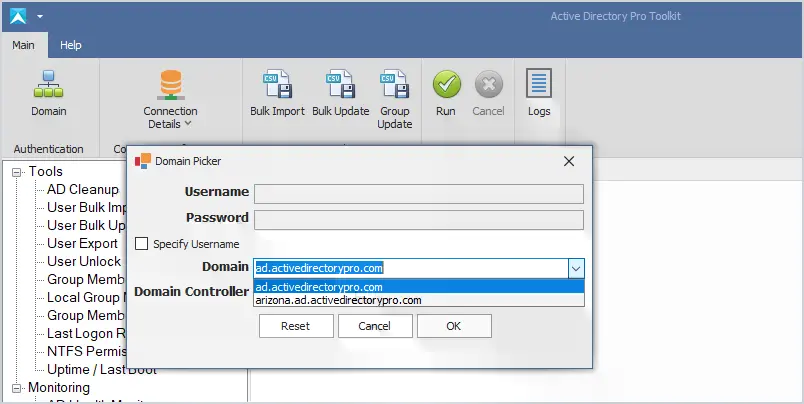
Does the AD Pro Tool support multiple domains?
Yes. It will auto-detect your domains based on current credentials. You can click the domain button to change authentication and connect to other domains or domain controllers.
Do you have a tool to help with account lockouts?
Yes, the user unlock tool can quickly display all locked users and the source of the lockout.
What is required to use the toolkit?
To create and bulk modify users you will need these rights in your Active Directory domain. This is often done by putting your account in the domain administrator group but can also be done by delegating these rights. Some tools like the last logon reporter, export, and group membership require no special permissions.
Do I need to know PowerShell or scripting?
No. All tools are very easy to use and require no scripting or PowerShell experience.
Is there a way to bulk update the manager, telephone numbers, and other user fields?
Yes, this is exactly what the bulk updater tool was created for. You can easily bulk update from a large list of user fields.
Can I bulk export or import on a scheduled task?
We are working on this right now. AD Cleanup, bulk import, update, and export tools will include an option to run on a scheduled task or from a script.
I was just hired and Active Directory is a mess. Can the Pro toolkit help?
The AD Cleanup tool can help you find old user and computer accounts and bulk disable or move them. We have many customers that use this tool to cleanup their domain environments.
Source :
https://activedirectorypro.com/tools/