FEBRUARY 23, 2024
BY PAUL G.
Much like a well-oiled machine, your WordPress requires regular maintenance to ensure peak performance and security. Without it, you can end up with a disorganised and bloated database, which can affect your site’s speed and leave it vulnerable to online threats.
But fear not! The solution lies in a simple yet often overlooked aspect of website management – database cleanup and optimisation.
In this comprehensive guide, we’ll show you how a little housekeeping can not only give your site the speed boost it desperately needs, but also strengthen its security against lurking threats. From manual tweaks to security plugins like Shield Security Pro, you’ll learn how to cleanse your digital space efficiently!
Understanding WordPress database health: Why it matters
Over time, a WordPress database accumulates old and unused data. Think of this as digital clutter – rows upon rows of data that are no longer in use but still take up space. This includes old post revisions, trashed items, spam comments, and data left by uninstalled plugins.
This clutter doesn’t just take up digital space. Every time your website performs a task, your server has to sift through everything. This creates an unnecessary workload that slows down your site, affecting user experience and potentially harming your SEO rankings.
Regular database maintenance ensures seamless website performance and significantly lowers the risk of malware infection. Since malware often hides in the clutter, a clean and optimised database is less vulnerable to attacks.
Here’s what to do to make sure your database is well-maintained:
- Regular backups: Before any cleanup, ensure you have a recent backup. It’s your safety net in case something goes wrong.
- Routine scanning for malware: Use reliable tools like the Shield Security Pro plugin for regular scans. Catching and removing malware early can prevent more significant issues down the line.
- Removing unused themes and plugins: Inactive themes and plugins are not just dead weight; they’re potential security risks. Regularly clean them out.
- Spam comment cleanup: Spam comments bloat your database and can harm your site’s credibility. Regularly purging them is crucial.
Optimising database tables
Table optimisation, or defragmentation, is about removing excess data from your site’s data tables. Think of it like organising a messy bookshelf so you can find books faster. It rearranges the data to use space more efficiently, improving performance. This process is important for larger websites, where data operations can become significantly slower over time.
Popular plugins like WP-Optimize, WP-DBManager, and Advanced Database Cleaner offer a user-friendly way to handle database optimisation without needing deep technical expertise. They help automate the cleanup process, ensuring your WordPress site remains speedy and efficient.
Backing up your site before initiating cleanup
Before you dive into the nitty-gritty of database cleanup, you must always back up your site first.
While database cleanup aims to remove only redundant data, the process isn’t infallible. There’s always a risk, however small, that something might go wrong. In such cases, a backup is your quick ticket to recovery, allowing you to restore your site to its pre-cleanup state with minimal fuss.
Here are some scenarios where backups save the day:
- User error: Sometimes, the biggest threat to your website can be accidental mishaps, like deleting important files or making erroneous changes.
- Platform and plugin updates: Updates are essential for security and performance, but they can occasionally lead to compatibility issues or data loss.
- Security breaches: In the unfortunate event of a hack or malware infection, a backup can be vital in restoring your site to a secure state.
The good news is that backing up your WordPress site can be made easy via backup plugins like WP-Staging, UpdraftPlus, BackupBuddy, and VaultPress (Jetpack Backup). These tools automate the process, ensuring that your site is regularly backed up without requiring manual intervention every time.
How often should you back up?
The frequency of backups should reflect how often your site is updated. For a dynamic site with daily changes, a daily backup is ideal. However, for smaller sites with less frequent updates, weekly or even monthly backups might suffice.
The key is to never skip backups altogether. It’s a small effort that can save a lot of time and stress in the long run.
Manual cleanup vs. plugin-assisted optimisation
When it comes to optimising your WordPress database, you have two primary approaches: manual cleanup or using plugins. While manual cleanup requires more technical know-how, it also gives you more precise control over the optimisation process.
Manual cleanup
- Before any changes, ensure you have a recent backup of your WordPress site, including the database. This step is non-negotiable and serves as your safety net.
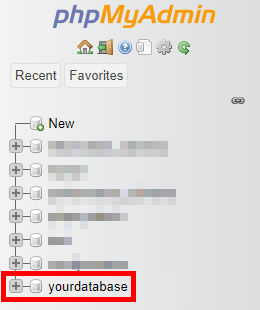
- Log in to your database using phpMyAdmin, which is typically available through your web hosting control panel.
- In phpMyAdmin, select your WordPress database from the list on the left.
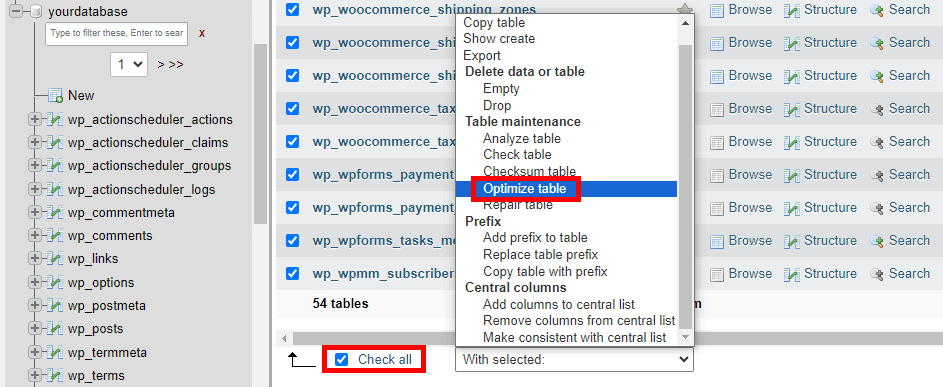
- You’ll see a list of all the tables in your database. Check the tables you want to optimise (or select all).
- From the drop-down menu, select Optimize table. This will defragment the selected tables and can improve performance.
- Navigate to the SQL tab.
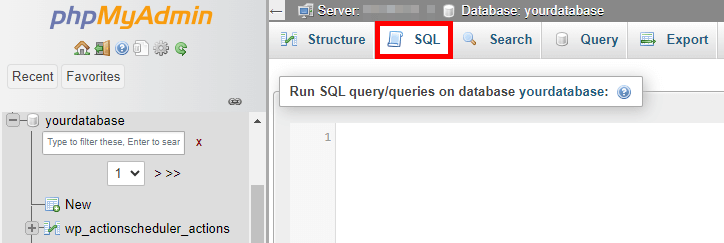
- WordPress saves every change you make in the posts as revisions. This can lead to a bloated database. To delete these post revisions, run this command:
DELETE FROM wp_posts WHERE post_type = "revision";Make sure to change the wp_ table prefix to the prefix you or your hosting provider set up during installation.
- To delete spam comments, run the following SQL command:
DELETE FROM wp_comments WHERE comment_approved = 'spam';
- In WordPress, ‘trash’ is a post status used for content that has been moved to the trash but not yet permanently deleted. To empty the trash and permanently delete what’s in it, run this query:
DELETE FROM wp_posts WHERE post_status = 'trash';
- Transients are used to speed up WordPress by caching data that is expensive to compute or retrieve. They are typically temporary and can be safely removed:
DELETE FROM wp_options WHERE option_name LIKE ('%\_transient\_%');
- Unused tags can be removed with a query like:
DELETE FROM wp_terms wt INNER JOIN wp_term_taxonomy wtt ON wt.term_id = wtt.term_id WHERE wtt.taxonomy = 'post_tag' AND wtt.count = 0;
This command deletes all tags (from both wp_terms and wp_term_taxonomy tables) that are not assigned to any posts on your WordPress website.
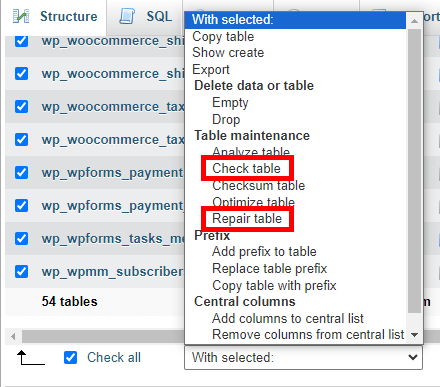
- After cleaning up, it’s a good idea to check the database for any errors. Select your database and use the Check table or Repair table options if needed.
- You might have tables from old plugins that are no longer used – many will leave tables behind even when the plugin itself have been removed from the site. Review these tables and delete them if they’re not needed. Be very careful with this step, as deleting the wrong table can cause issues with your site. If you’re in doubt, you can always reach out to the plugin developers to ensure you’re deleting the right items.
For plugin-assisted optimisation
For WordPress users who prefer a more straightforward, less technical approach to database optimisation, plugin-assisted methods are a game-changer. These tools offer:
- Ease of use: Plugins provide a simple interface for tasks that would otherwise require technical expertise. They’re designed to be intuitive and accessible, even for those with minimal technical background.
- Automation: Many WordPress plugins can operate in the background, performing routine cleanups and optimisations without your constant oversight. This automation saves time and ensures regular maintenance is carried out.
- Less technical involvement: By automating database optimisation, you free up valuable time and resources to focus on other areas of your business, like content creation, marketing, and customer engagement.
Among the most notable plugins for database optimisation include:
- WP-Optimize: This popular plugin cleans your database, compresses images, and caches your site, making it a comprehensive tool for site optimisation.

- WP-DBManager: Known for its database backup, repair, and optimisation features, WP-DBManager is a solid choice for those looking to maintain their database’s health.

WP-DBManger download page
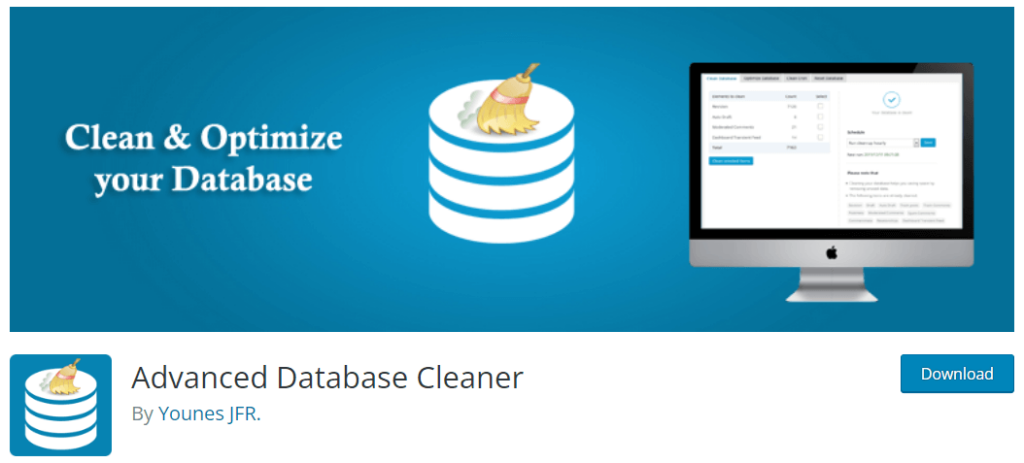
- Advanced Database Cleaner: If you’re looking for a plugin that goes beyond basic cleanup, this tool helps you get rid of orphaned items and old revisions with ease.
If you want even more plugin options, check out our post on the best backup plugins for WordPress websites.
Setting up and using database optimisation plugins
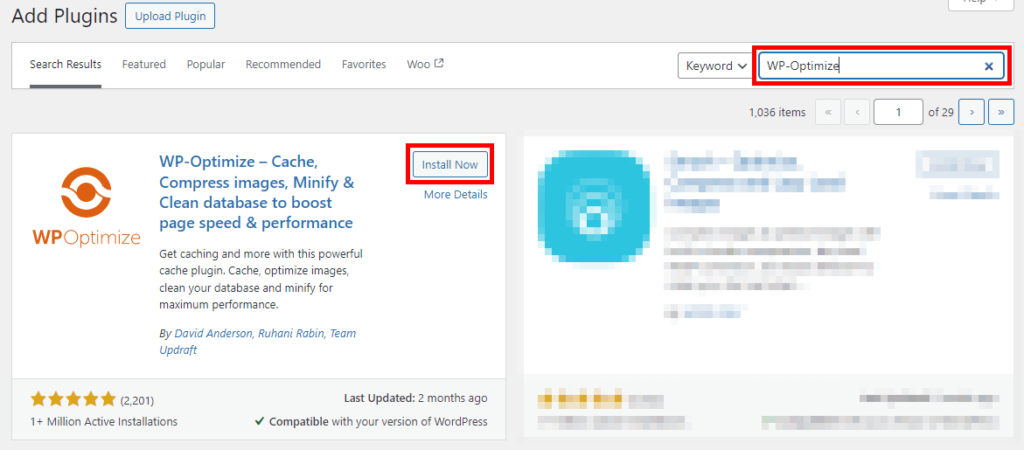
For the sake of this tutorial, we’re going to be using the WP-Optimize plugin:
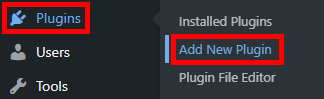
- From your WordPress admin dashboard, go to Plugins > Add New Plugin.
- Search for the WP-Optimize plugin and click on Install Now, then Active.
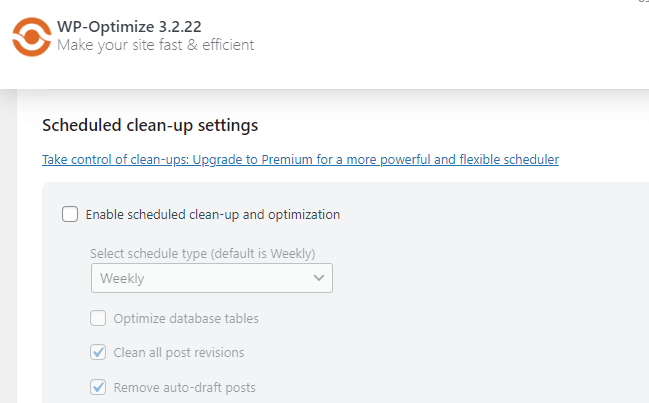
- A new icon for WP-Optimize will appear in your WordPress left-hand side menu. Click on it and go through the plugin settings to configure the optimisation tasks you want to automate, like spam comment cleanup, post-revision removal, and database table optimisation.
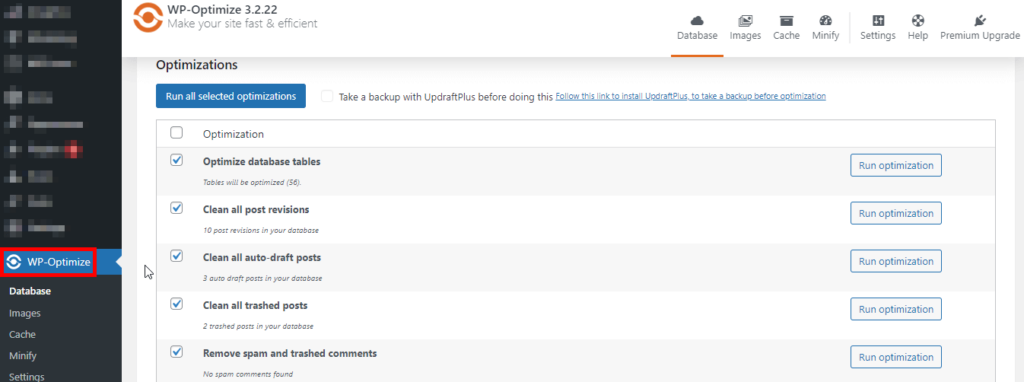
- Many plugins offer the option to schedule regular cleanups. Setting this up ensures your database remains optimised without manual intervention.
Choosing the right plugin
When selecting a plugin, especially those designed to modify or remove data, it’s necessary to pick one that is well-reviewed and regularly updated. Check the plugin’s ratings, user reviews, and update history to ensure reliability and compatibility with your version of WordPress.
By choosing the right plugin, you can significantly reduce the effort required in database maintenance, ensuring your WordPress site remains optimised, fast, and secure with minimal hassle.
Using Shield Security Pro for malware removal
When it comes to safeguarding your WordPress site against malware, Shield Security PRO stands out as a robust solution. Its advanced malware scanning and removal tool is specifically designed to protect your website by detecting and eliminating malicious code.
Features of Shield Security PRO’s malware scanner
- Comprehensive scanning: The malware scanner in Shield Security PRO thoroughly examines your files, looking for patterns that indicate malware infiltration. This proactive approach ensures that even the most cunningly hidden malware is identified.
- Detailed reporting: When it detects malware, the plugin creates a detailed report alerting you to the affected files. This feature allows you to download and inspect these files closely, giving you a clear understanding of the nature and extent of the malware.
- Automatic repair option: For those seeking a hands-off approach, Shield Security PRO offers an automatic repair feature. This functionality enables the plugin to edit and remove suspicious code autonomously, saving you the time and effort of manual intervention.
- Customisable repair settings: You have the flexibility to set automatic repairs for core files, plugin files, theme files, or all three, depending on your preference and website structure.
While automatic repair is a convenient feature, it’s essential to use it wisely, especially if you regularly modify your WordPress files. In such cases, automatic repairs might unintentionally alter your customisations. Therefore, if you often tweak your WordPress code, manual inspection and repair might be more suitable.
Regardless of whether you choose automatic repairs or prefer to handle file fixes manually, the key advantage of Shield Security PRO’s malware scanning lies in its prompt detection. Fast identification of malicious data is crucial in preventing it from causing significant damage to your site.
Enhance your WordPress site’s performance & security with Shield Security PRO
Regular WordPress database cleanups and optimisations are necessary for maintaining a high-performing, secure website.
While manual database maintenance is certainly an option, it can be time-consuming and requires a certain level of technical expertise. This is where plugins come into play, offering a simpler, more efficient solution. By automating key aspects of the maintenance process, these tools significantly reduce the workload on website owners.
Shield Security PRO is designed to address both the performance and security needs of your WordPress site. It features advanced vulnerability and malware scanning capabilities, which play a vital role in identifying and removing unused data and potentially dangerous elements from your site.
Don’t let the health and security of your WordPress site take a backseat. With Shield Security PRO, you have a powerful tool at your disposal to keep your site running smoothly and securely.
Download Shield Security PRO today, and take the first step towards a faster, safer, and more efficient WordPress experience!
Source :
https://getshieldsecurity.com/blog/clean-wordpress-database/